


Solana Price Forecast: SOL nears key breakout level as ETF inflows, strong fundamentals support upside
- Solana price is near the key resistance at $87.10 on Tuesday, a firm close above suggests a bullish move ahead.
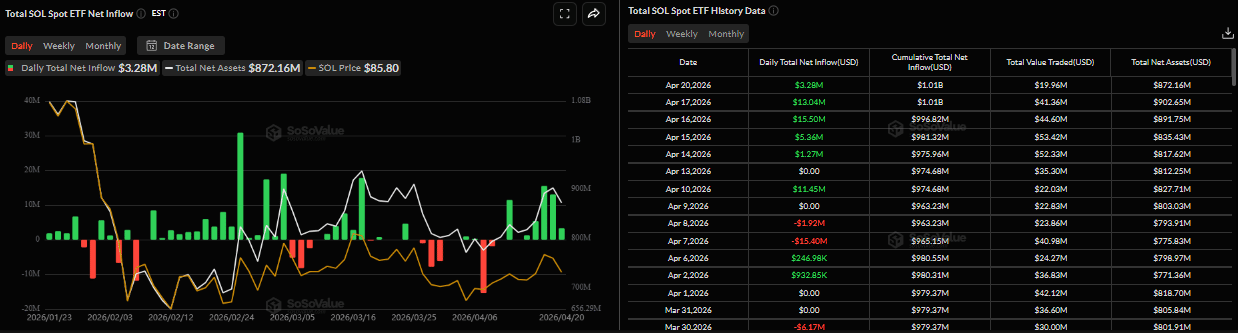
- US-listed SOL spot ETFs recorded an inflow of $3.28 million on Monday, marking the fifth consecutive day of positive flows.
- Lily Liu said Solana’s architecture prioritizes unified liquidity, highlighting it as the network’s core advantage for financial applications.
Solana (SOL) price is nearing a key resistance level around $87.10 on Tuesday, which could determine the next directional move. Meanwhile, positive sentiment around SOL builds, driven by rising institutional demand for SOL spot Exchange Traded Funds (ETFs). In addition, Lily Liu, President of Solana Foundation, emphasized that SOL’s architecture is designed around unified liquidity, highlighting its long-term strength as financial infrastructure for global-scale adoption.
Institutional demand remains robust for Solana
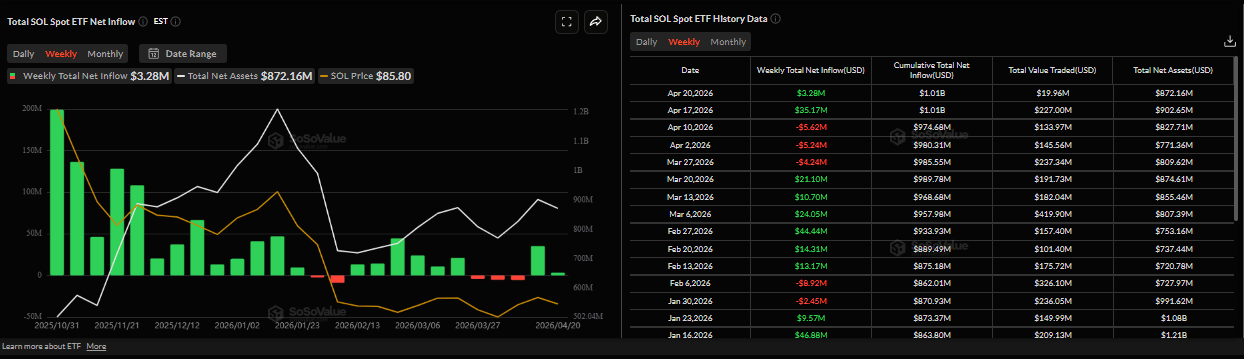
Institutional demand for SOL started the week on a positive note. SoSoValue data shows that spot Solana ETFs recorded inflows of $3.28 million on Monday, following $35.17 million last week and marking the fifth consecutive day of inflows. If this inflow continues and intensifies, SOL could see an upside move ahead.
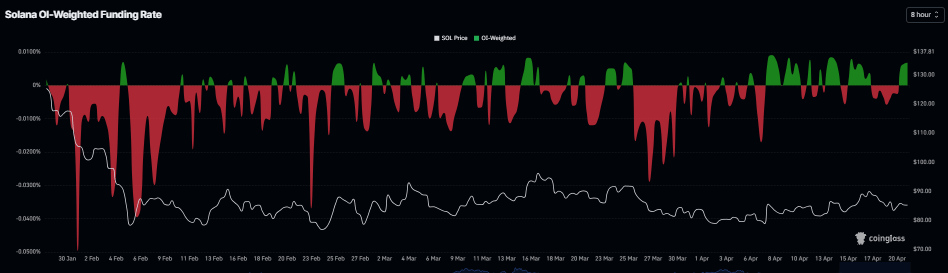
On the derivatives side, SOL’s funding rate data has flipped positive on Monday and is now 0.0068% on Tuesday, indicating longs are paying the shorts and highlighting bullish sentiment.
“Solana’s architecture prioritizes unified liquidity,” says the President of the Solana Foundation
Lily Liu, President of Solana Foundation, in an interview at the Solana Policy Institute’s Washington x Wall Street Summit, explained that Solana is fundamentally built around unified liquidity — what she considers the most important factor in finance.
Liu noted that markets are ultimately driven by liquidity, and the largest, most efficient pool of capital will always dominate.
With the internet connecting nearly 5.5 billion people globally, Liu argued that Solana’s architecture is designed to support the largest possible marketplace on a single network, reinforcing its long-term advantage as financial infrastructure for global adoption.
Solana Price Forecast: SOL approaches key resistance level
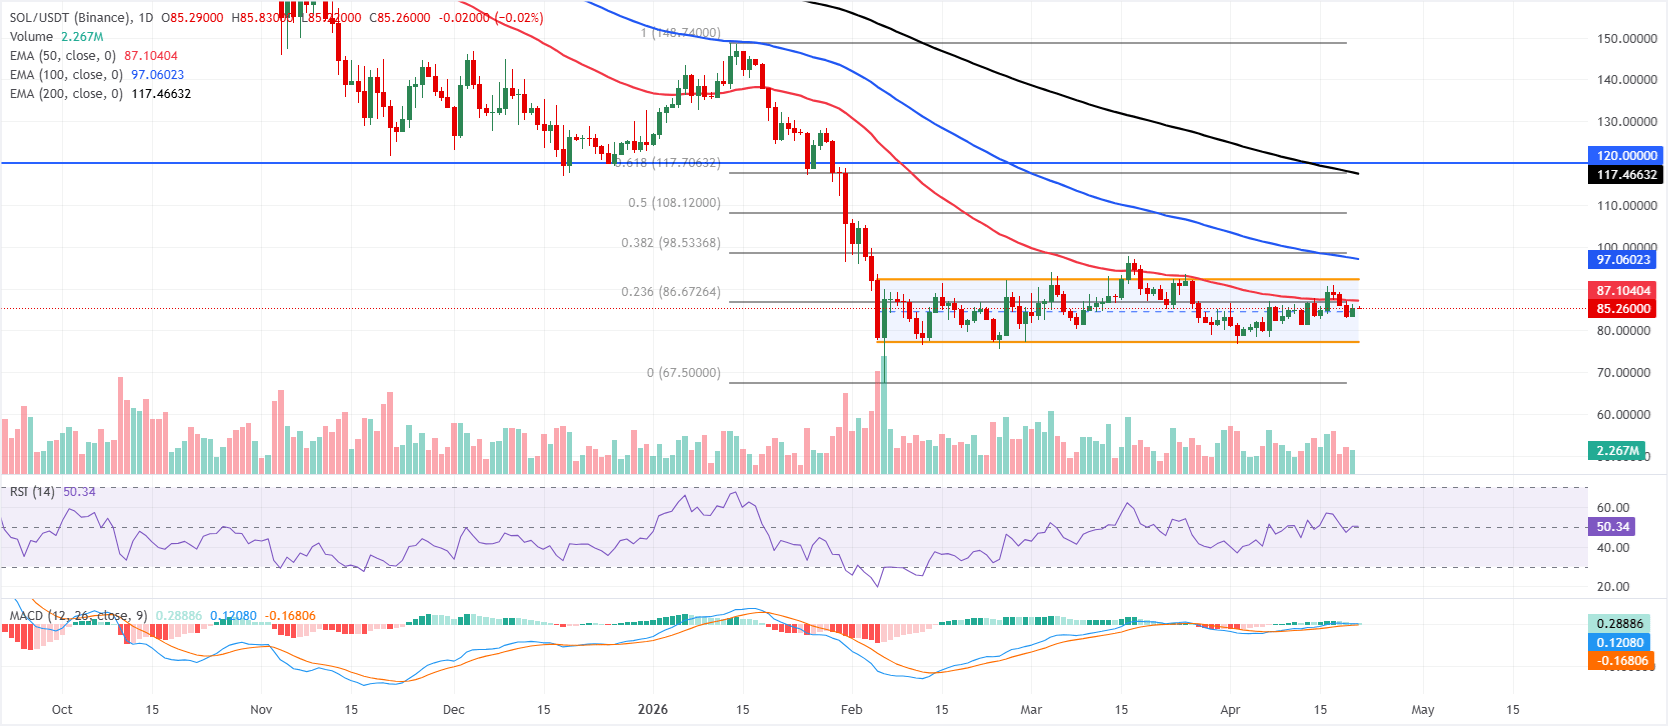
Solana is trading at $85.27 on Tuesday, up over 2% from the previous day. SOL nears the key 50-day Exponential Moving Average (EMA) at $87.10, where a close above suggests a bullish move.
The pair is consolidating near the session pivot around the prior open while still trading inside a parallel channel, with the top of that structure acting as dynamic resistance near $92.11. The Relative Strength Index (RSI) on the daily chart holds close to the midline around 50, hinting at neutral momentum, while the Moving Average Convergence Divergence (MACD) stays positive but moderates, suggesting only a tentative recovery within a broader capped structure.
On the topside, initial resistance appears at the 23.6% Fibonacci retracement of the latest swing near $86.67, followed by the 50-day EMA at $87.10, a break of which would be needed to ease immediate downside pressure. Above that, the channel ceiling at $92.11 aligns ahead of the 100-day EMA at $97.06 and the 38.2% retracement at $98.53, while more substantial barriers emerge around the 50% retracement at $108.12 and the 200-day EMA clustered with the 61.8% level near $117–$118, reinforced by horizontal resistance at $120.
(The technical analysis of this story was written with the help of an AI tool.)
Recommended Articles


