
Dow Jones Industrial Average sheds weight as tech rally fizzles
- The Dow Jones shed 300 points on Monday as investors recoil at the year-end.
- The broad-market tech rally that bolstered indexes to record highs in 2024 looks set to evaporate.
- Most investors are sitting on the sidelines ahead of the midweek holiday closure.
The Dow Jones Industrial Average (DJIA) shed over 300 points on Monday, plunging to a near-term low just south of 42,300 before a half-hearted recovery back to 42,500 as equities swoon in one of the last trading days of the year. The broad-market tech rally, buoyed into lofty heights by even loftier investor expectations for the AI-fueled future, looks set to drain out of the markets for the time being.
Markets are hurtling toward the new trading year on decidedly softer footing. The Dow Jones is down 5.5% from record highs set in late November following a two-week period of straight daily declines, a feat the index hasn’t achieved since the 1970s. Markets hit the holiday season in a flat spin, keeping the Dow Jones from further declines but also preventing a meaningful bullish recovery.
After the midweek market closure for the New Year’s Day holiday, traders will be returning to the fold en masse in a much trickier environment than they expected through most of 2024. The Federal Reserve (Fed) has clamped down on the number of rate cuts it expects to deliver in 2025, forecasting a meager two 25 bps rate cuts through the calendar year before pausing. Despite the Fed’s insistence that their approach to interest rates remains ‘data dependent’, investors will have a hard time believing that incoming President Donald Trump’s strategy of sparking a trade war with everybody at the same time won’t have at least a marginal impact on the Fed’s policy stance.
Dow Jones news
The Dow Jones is broadly lower on Monday, with all but one of the index’s listed securities tilting into the red on the day. Nvidia (NVDA) is the only bright spot on the DJIA, rising a little over 2% and knocking on $140 per share. On the low side, Boeing (BA) and Nike (NKE) are in a dead heat race to the bottom, both shedding around 1.7% since the day’s opening bell. Boeing has fallen below $178 per share while Nike is testing $75 per share after falling to four-week lows.
Dow Jones price forecast
The Dow Jones’ recent plunge from all-time peaks has left near-term price action battling the charts below the 50-day Exponential Moving Average (EMA), a moving average that has provided technical support for bids through the last 13 straight months. Prices are still holding north of the 42,000 key handle, but bullish momentum remains limited as bids remain caught below the last swing low into 43,000.
Dow Jones daily chart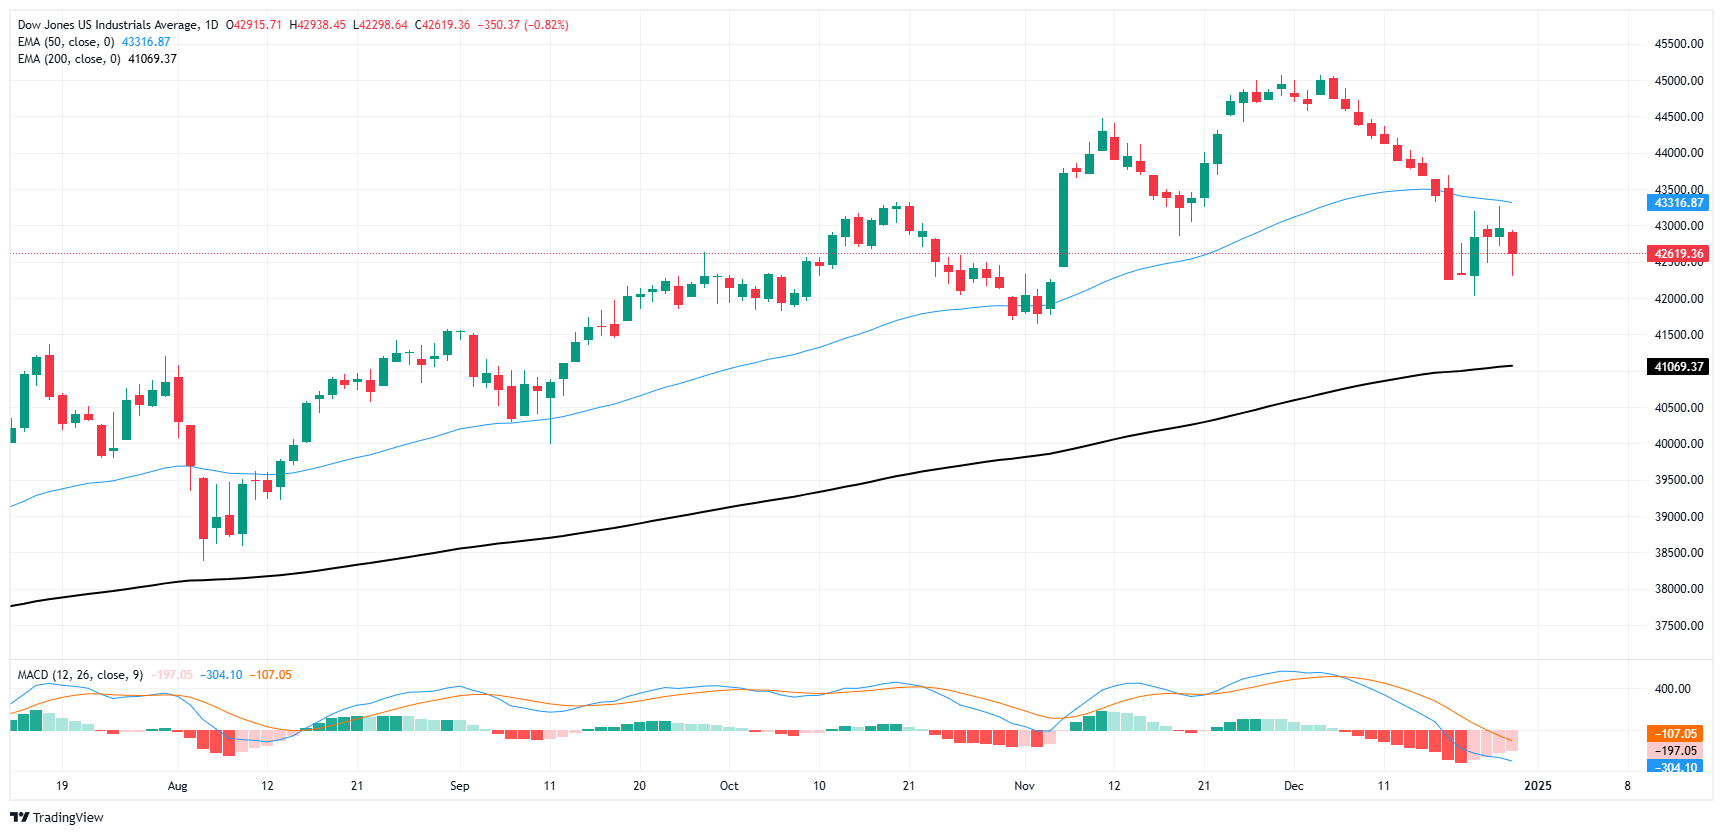
Dow Jones FAQs
The Dow Jones Industrial Average, one of the oldest stock market indices in the world, is compiled of the 30 most traded stocks in the US. The index is price-weighted rather than weighted by capitalization. It is calculated by summing the prices of the constituent stocks and dividing them by a factor, currently 0.152. The index was founded by Charles Dow, who also founded the Wall Street Journal. In later years it has been criticized for not being broadly representative enough because it only tracks 30 conglomerates, unlike broader indices such as the S&P 500.
Many different factors drive the Dow Jones Industrial Average (DJIA). The aggregate performance of the component companies revealed in quarterly company earnings reports is the main one. US and global macroeconomic data also contributes as it impacts on investor sentiment. The level of interest rates, set by the Federal Reserve (Fed), also influences the DJIA as it affects the cost of credit, on which many corporations are heavily reliant. Therefore, inflation can be a major driver as well as other metrics which impact the Fed decisions.
Dow Theory is a method for identifying the primary trend of the stock market developed by Charles Dow. A key step is to compare the direction of the Dow Jones Industrial Average (DJIA) and the Dow Jones Transportation Average (DJTA) and only follow trends where both are moving in the same direction. Volume is a confirmatory criteria. The theory uses elements of peak and trough analysis. Dow’s theory posits three trend phases: accumulation, when smart money starts buying or selling; public participation, when the wider public joins in; and distribution, when the smart money exits.
There are a number of ways to trade the DJIA. One is to use ETFs which allow investors to trade the DJIA as a single security, rather than having to buy shares in all 30 constituent companies. A leading example is the SPDR Dow Jones Industrial Average ETF (DIA). DJIA futures contracts enable traders to speculate on the future value of the index and Options provide the right, but not the obligation, to buy or sell the index at a predetermined price in the future. Mutual funds enable investors to buy a share of a diversified portfolio of DJIA stocks thus providing exposure to the overall index.
Recommended Articles


