
Bitcoin (BTC) Hit by Sharp Spot Outflows Amid Rising Middle East Tensions

- Tesla Stock Hits Record High as Robotaxi Tests Ignite Market. Why Is Goldman Sachs Pouring Cold Water on Tesla?
- Gold Price Hits New High: Has Bitcoin Fully Declined?
- Gold jumps above $4,440 as geopolitical flare, Fed cut bets mount
- U.S. November CPI: How Will Inflation Fluctuations Transmit to US Stocks? Tariffs Are the Key!
- US Q3 GDP Released, Will US Stocks See a "Santa Claus Rally"?【The week ahead】
- December Santa Claus Rally: New highs in sight for US and European stocks?

Bitcoin faces intensified selling pressure today, with a noticeable uptick in spot market outflows. This comes as markets grapple with the aftermath of Israel’s strike on Iran on Friday, sparking geopolitical uncertainty.
The coin is down 3% over the past 24 hours, and technical indicators point to waning buyer momentum. If the bearish pressure persists, BTC could slide further, potentially testing lower support levels in the days ahead.
Bitcoin Faces More Losses as Indicators Turn Red
Over the past 24 hours, BTC has declined by almost 5%, hovering around the $105,000 mark. The heightened risk-off sentiment is driving capital out of the spot market, signaling waning confidence among traders and institutional participants.
On the daily chart, BTC’s Relative Strength Index (RSI) has broken below the 50-neutral levels, confirming the rapidly declining buying momentum. As of this writing, this indicator is at 48.85, facing downward.
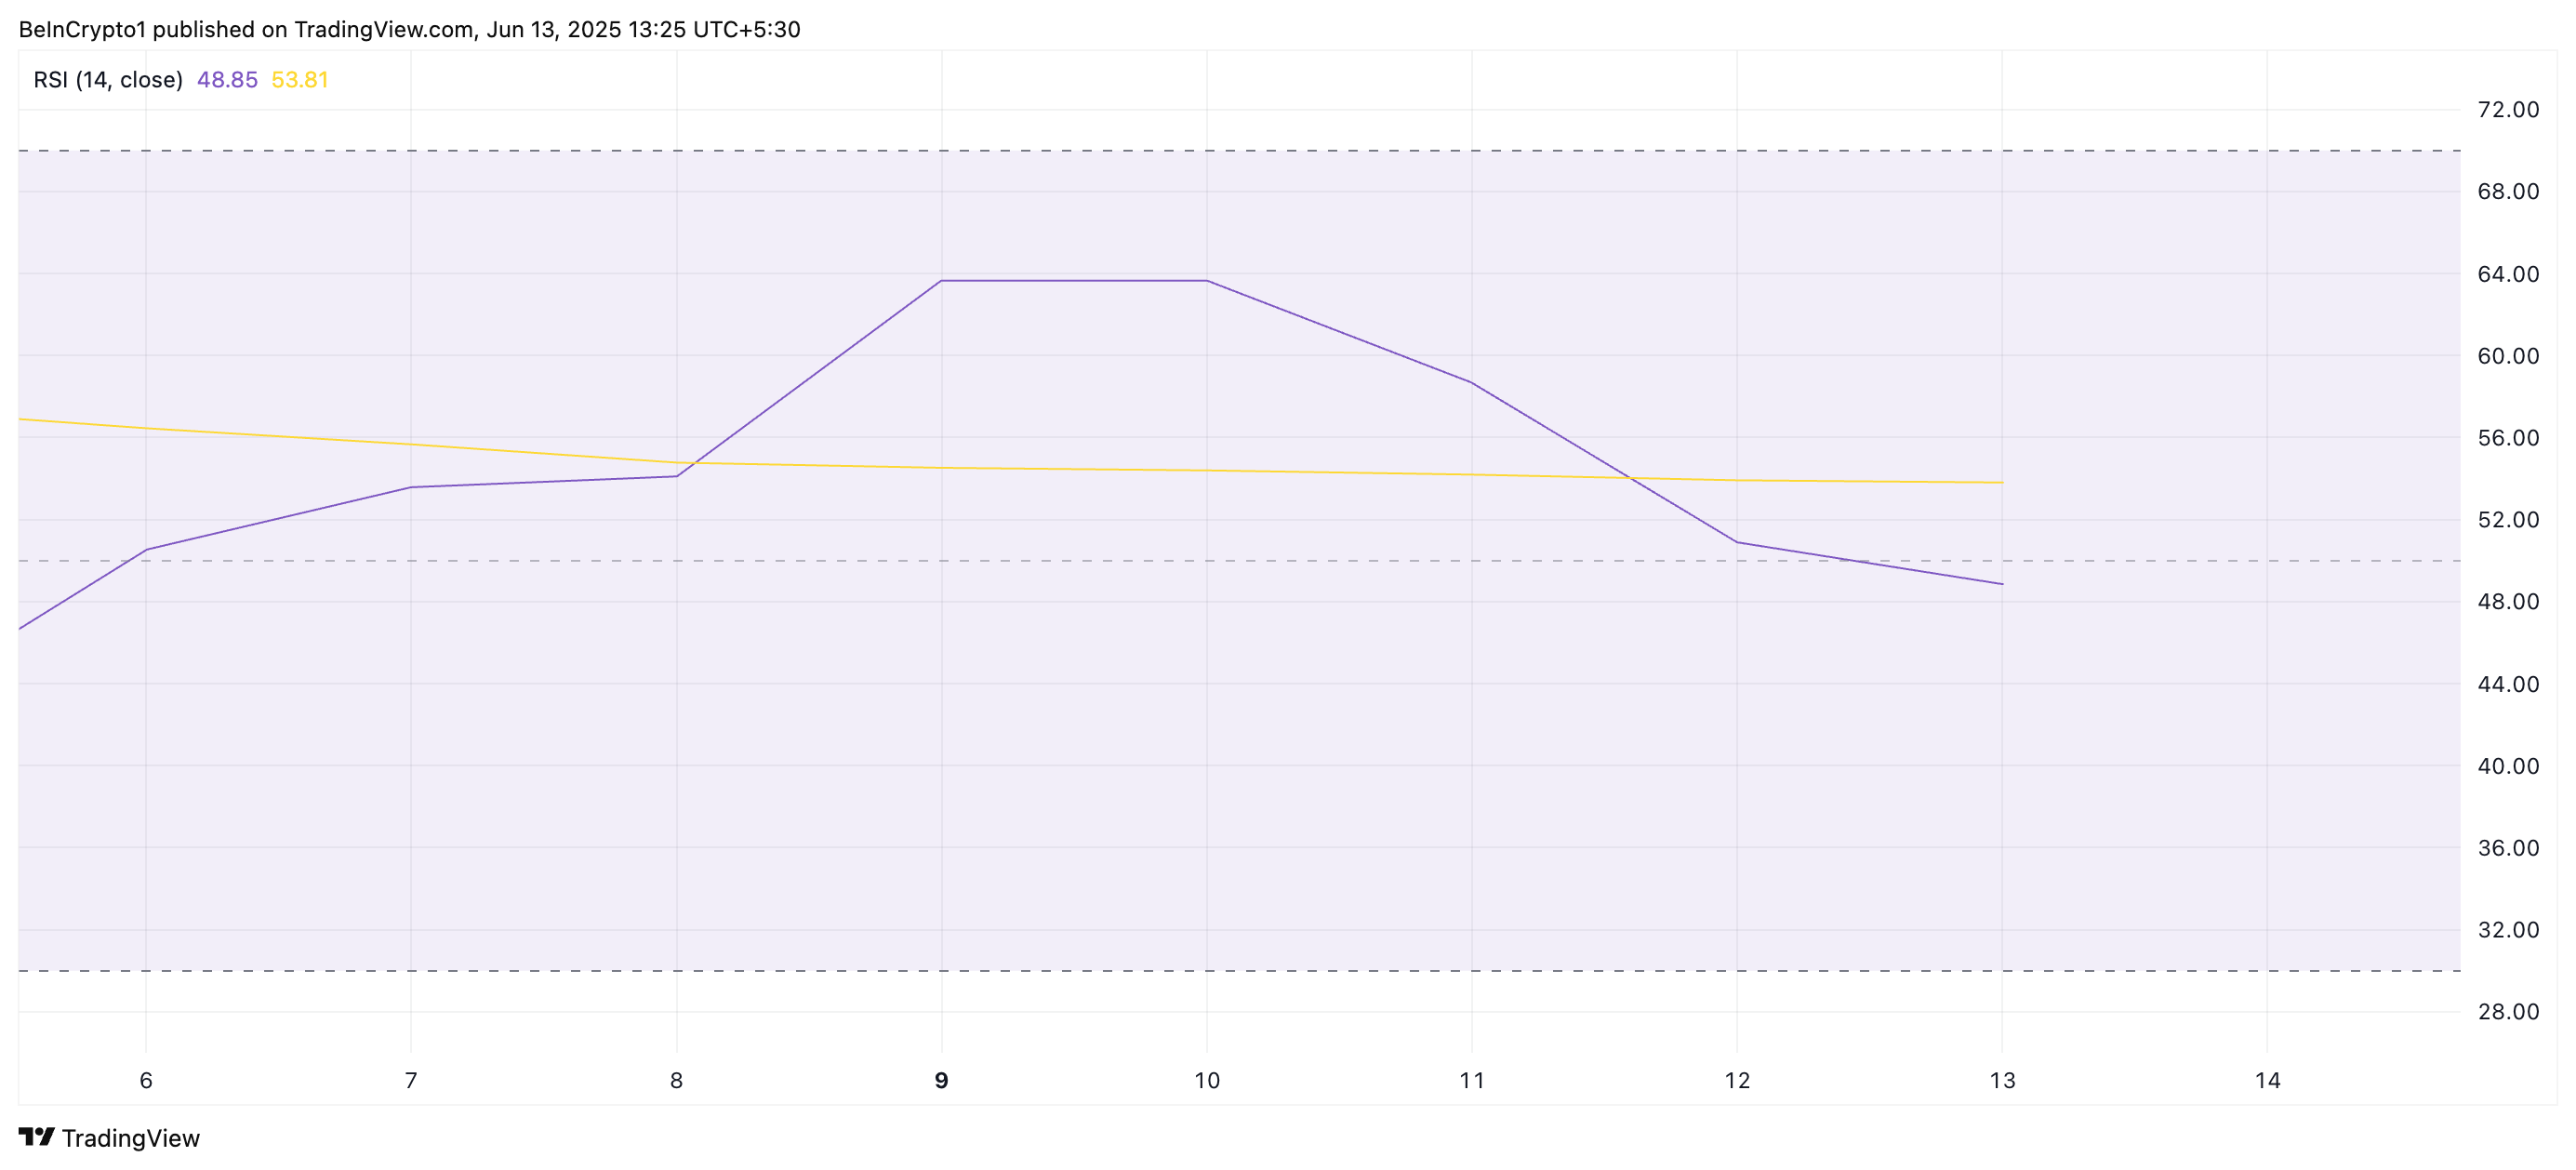 BTC RSI. Source: TradingView
The RSI indicator measures an asset’s overbought and oversold market conditions. It ranges between 0 and 100, with values above 70 suggesting that the asset is overbought and due for a price decline. Converesly, values under 30 indicate that the asset is oversold and may witness a rebound.
BTC’s current RSI reading reflects the weakening bullish momentum and hints at the likelihood of further price dips in the near term.
Moreover, the setup of the coin’s Moving Average Convergence Divergence (MACD) supports this bearish outlook. As of this writing, BTC’s MACD line (blue) rests below its signal line (orange), a trend that indicates the dominance of sell-side pressure.
 BTC MACD. Source: TradingView
An asset’s MACD indicator identifies trends and momentum in its price movement. It helps traders spot potential buy or sell signals through crossovers between the MACD and signal lines. When set up this way, selling activity dominates the market, hinting at further price drops.
BTC Bears Tighten Grip as Price Slips
BTC currently trades at $105,304, marking its third consecutive red candle on the daily chart. With demand for the coin continuing to wane, it risks a drop toward the support floor at $103,061. If the bulls fail to defend this level, a deeper decline to $101,610 could occur.
 BTC Price Analysis. Source: TradingView
However, if new demand emerges, BTC may break out of its downtrend and rally toward the $106,548 resistance level.
Read more
* The content presented above, whether from a third party or not, is considered as general advice only. This article should not be construed as containing investment advice, investment recommendations, an offer of or solicitation for any transactions in financial instruments.


