Gold price forecast 2024/2025/2026: How to analyze the gold price trend?

Although the US dollar and US bond yields have risen sharply, gold prices have remained at high levels and fluctuated in the range of $1800~$2100 in 2023 with a return of around 14% based on the international market price as of December 28.
The fluctuation of gold seems very difficult to predict because there are many factors impacting it at the moment, such as the strength of the US dollar, inflation, oil prices, the gold-buying power of large organizations or countries, the situation of the war in the Middle East, and so on.
Gold price volatility is a good opportunity for futures traders. Faced with price fluctuations, traders have an even greater opportunity to seek higher profits. In this article, let's go over some effective ways to analyze gold prices using common and easy-to-understand methods, so that you can more easily make predictions about gold prices in 2024/2025/2026.
1. Current gold price and gold price forecast for 2025
The current gold price on 7/12/2023 is trading steadily in the range of $2,020 - $2,030 per ounce. After a strong increase and reaching a peak of $2,150 on 4/12, the gold price has adjusted strongly on the same day and is now only fluctuating around the level of $2,000 to $2,040.
The technical signals all indicate that the gold price needs to adjust, however, the fact that the gold price is right above the psychological threshold of $2,000 suggests that this could be a short-term equilibrium zone. If it stays flat here long enough, gold may continue to gain momentum without needing to go through a strong correction below $2,000 again.
Technical chart showing gold price movement [Mitrade]
Moving into March 2024, the gold price continues to soar and sets a new high above the $2,100 mark. Why can the gold price dance at such a high peak?
There are many reasons leading to the gold price reaching a new high, but the key factor is said to be the weakening strength of the US dollar and the expectation of a prolonged interest rate cut cycle by the Fed to be activated in 2024.
On 19th Sep. 2024, the Federal Reserve's decision to lower interest rates by 50 basis points at the September 2024 FOMC meeting marks a significant shift in monetary policy, reflecting advancements in achieving its dual mandate of maximum employment and stable prices for the first time in four years.
Gold price forecast for 2025:
FED interest rate reduction speculation fueling gold prices The market currently estimates a 63% probability of a 50-basis point decrease, as reported by CME Group's FedWatch tool, indicating a significant increase in expectations of a very aggressive Federal Reserve rate drop in recent days. Exactly one week ago, the likelihood was at 34%. The change was driven by media reports indicating that the Federal Reserve may use more resolute measures to bolster the economy.
Due to the Federal Reserve's implementation of a 50-basis point reduction in interest rates today, it is probable that gold prices will continue their upward movement over $2,600 per ounce, indicating a positive view for the subsequent months.
There are some other forecast for 2025-2026 :
2025: Getting Higher
According to kitco.com, Geopolitical instability and further rate reduction might drive gold prices considerably higher by 2025. With investors looking to gold as a safe haven among world uncertainty, prices might vary from $2400 to $2600 per ounce specatively.
2026: New Peaks
Should the Federal Reserve's monetary policy produce what it presently projects, interest rates will return to normal by now (2% – 3%) and inflation will have been reduced to 2% or less. From an inflationary hedge to a refuge asset, this will alter the main forces behind gold pricing. A possible range of $2600 to $2800 per ounce is within reach as gold confirms its value as a consistent asset in trying conditions.
2. Why should you know how to analyze gold price trends?
The gold price trend over the past 3 years (2021 - 2023) has seen very strong fluctuations. The first few months of 2021 and 2022 saw prices rise quite high, above $1,900 per ounce. But from March 2022, prices have been continuously creating new lows, touching $1,643.2 per ounce.
In 2023, gold prices have also been volatile, with times when they have adjusted around 15% from the peak of $2,075 down to over $1,800, before rising again and reaching a new high of $2,150. The main event impacting the sharp rise in gold prices during this period has been the conflict between Israel and Palestine, which caused oil prices to rise sharply and raised the risk of inflation returning, along with expectations of the Fed lowering interest rates, weakening the US dollar.
Moving into early 2024, gold prices have been quite stable and maintained high levels around $2,000, striving to conquer new highs. At the beginning of March this year, gold prices recorded a new all-time high of $2,148.86.
Analyzing gold prices
Gold is considered a commodity that can substitute fiat currency and is widely used by hedge funds to hedge against inflation. Moreover, gold is also an asset often used for national reserves as a tool to combat economic recession.
In addition, gold is also seen as a favorite investment product for a large number of investors in the international financial market.
Therefore, monitoring and analyzing gold prices not only assesses the economic health of a country and the world, but also provides investment opportunities for traders.
Gold is affected by many factors such as the strength of the US dollar, wars, energy crises... In addition, the monetary policies of central banks also have a strong impact on the trend of gold.
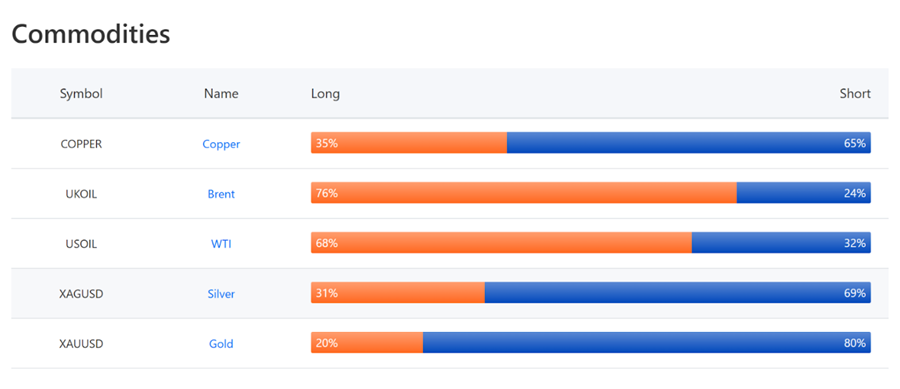
Gold market sentiment index and other commodities(19/9/2024)- Source: Mitrade
According to the market sentiment index on the Mitrade platform, the ratio of 20% (Long) - 80% shows that investor sentiment has a large gap and leaning more towards selling than buying. This may indicate that the market is waiting for gold prices to adjust further rather than wanting to buy right away.
If you trade without a clear understanding of gold price analysis methods and using key indicators, it will be very difficult to accurately determine the main trend and the price adjustments.
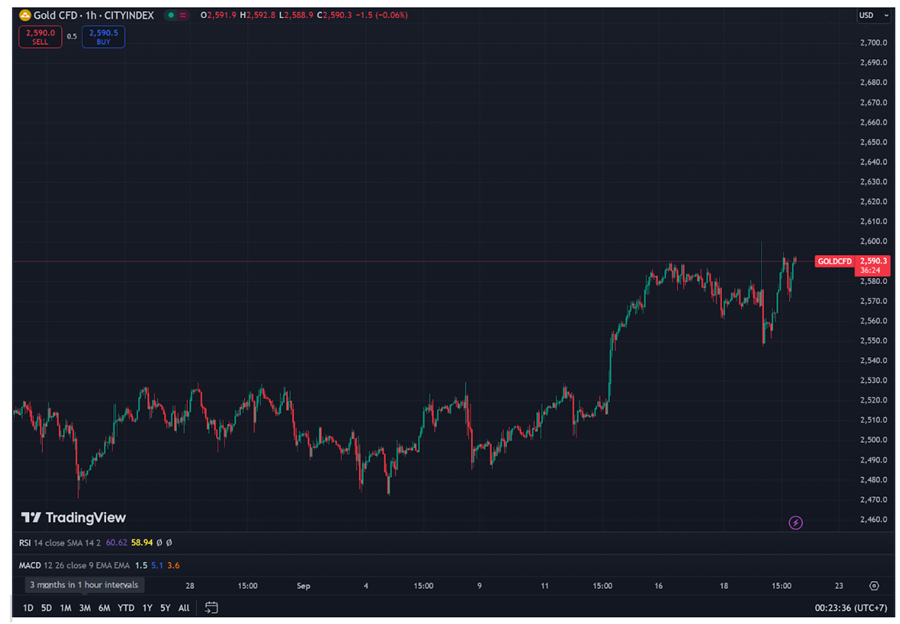
Gold price trend in the 1H timeframe - Source: Tradingview
Experts often use tools such as technical analysis, fundamental analysis and sentiment index to determine the future trend of gold.
Gold is considered a commodity for trading and also a form of currency in the market. Gold is usually priced in USD and can be traded both physically and online.

 0 commission, low spreads
 Diverse risk management tools
 Flexible leverages and instant analysis
 Practice with $50,000 risk-free virtual money
3. Looking back at the gold price chart over the past 5 years 2019 ~ half 2024
Gold price trend in 2019
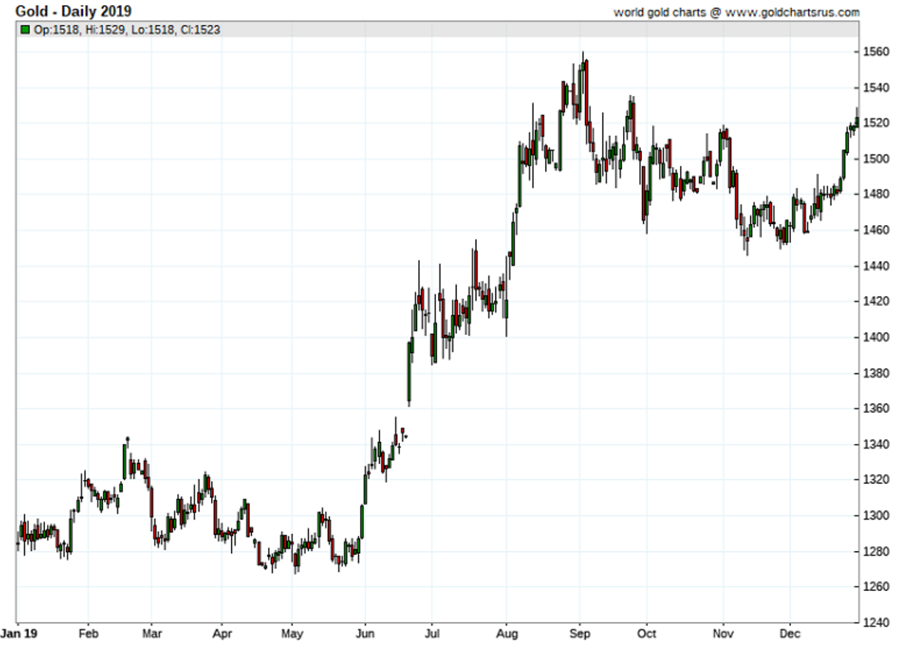
Gold Price Chart in 2019 (Source: Goldchartus)
With the Fed cutting interest rates and buying government bonds, combined with global political and economic instability, global gold prices have risen nearly 19%.
Gold has always been considered a highly secure asset and a safe haven for investors whenever there are global-scale political, economic, natural disaster, or pandemic events.
This has caused investors around the world to shift their money away from the stock market and into investing in gold.
Gold price trend in 2020
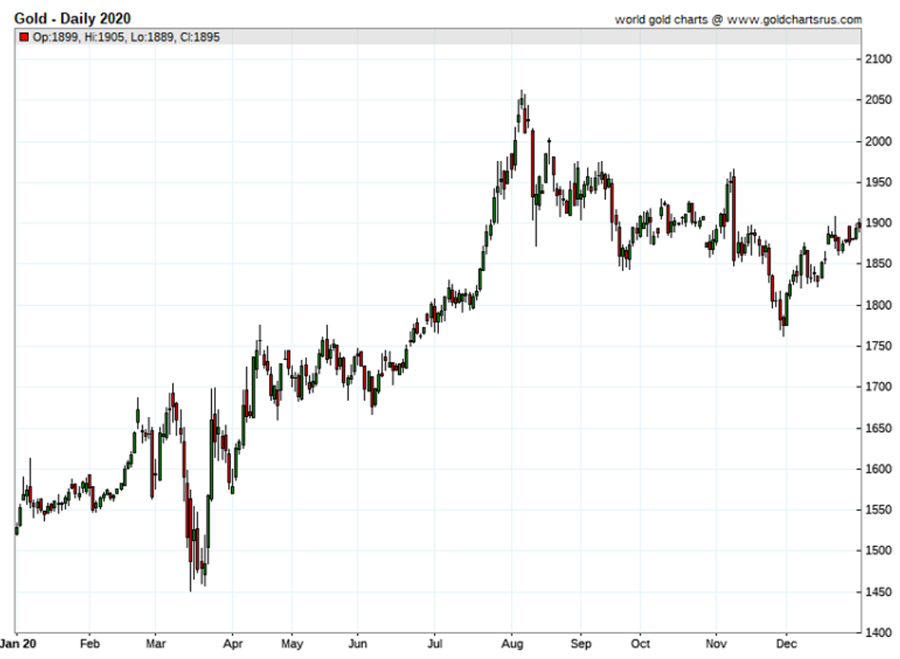
Gold Price Chart in 2020 (Source: Goldchartus)
The gold market closed 2020 with impressive growth. According to statistics, gold has increased by more than 25% in 2020.
Gold reached a peak in August at $2,072.5 per ounce, although prior to that, in March, it still struggled to rise from the $1,451 per ounce level. So gold grew by $600 in just 5 months.
The reason for this was the impact of the Covid-19 pandemic in March. The pandemic had devastated nearly the entire global financial market. However, shortly after, this precious metal was sought after as a safe haven asset. Subsequently, the US rollout of economic stimulus packages drove gold prices up to their peak in August.
Gold Trends in 2021
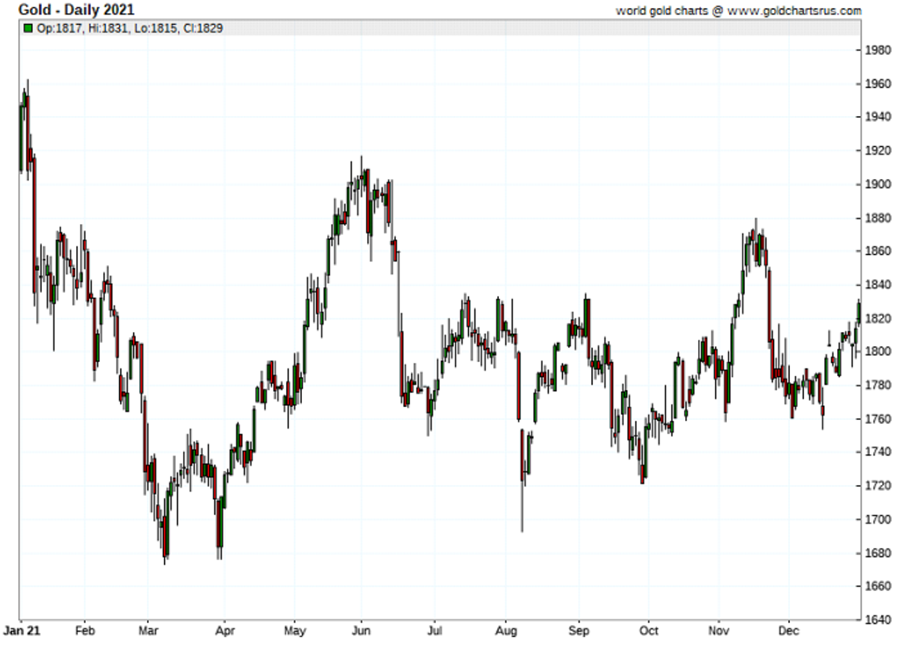
Gold Price Chart in 2021 (Source: Goldchartus)
The price of gold in 2021 did not have too many sudden fluctuations. Specifically, gold fell 8% in 2021. At the beginning of the year, gold was around $1,950, but it plummeted quickly in March to reach $1,700.
It took 3 months, until June, for gold to regain its $1,900 mark, but it only took another 3 months for gold to return to the $1,700 level. At the end of 2021, gold fluctuated around $1,800 and did not show many signs of significant change.
The reason for the downward movement of gold in 2021 is attributed to the tightening monetary policies of the Fed, ECB, BOE, etc. Major central banks simultaneously tightened monetary policies to combat the surge in prices in the context of economic recovery after the pandemic. Another reason is the rising trend of the US dollar. In 2021, the US dollar rose 7% against 6 other major currencies.
In addition, the explosion of other markets such as cryptocurrencies should also be mentioned. These markets were extremely active last year and overshadowed gold.
Gold Trends in 2022
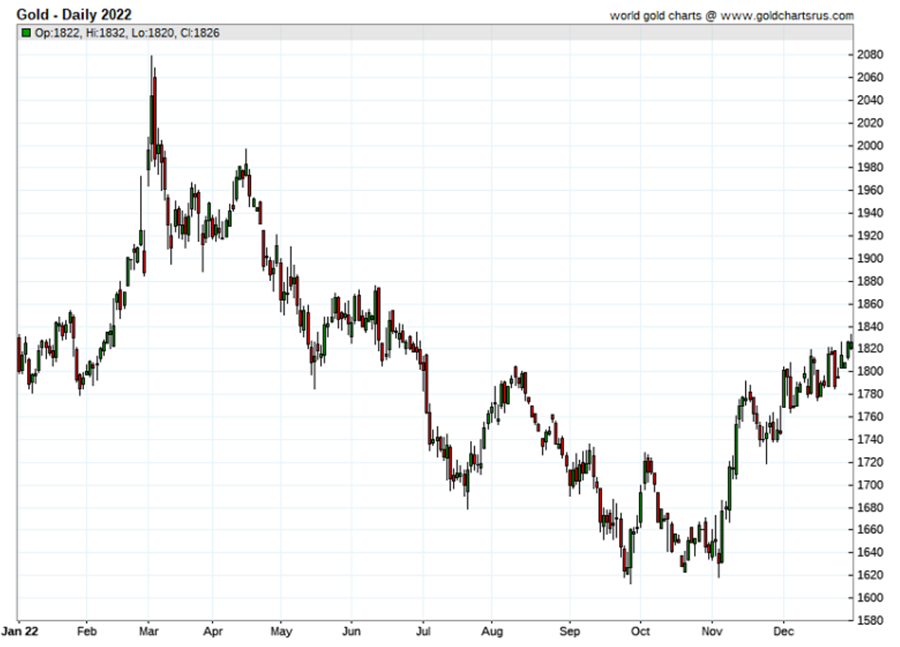
Gold Price Chart in 2022 (Source: Goldchartus)
In the first 3 months of 2022, gold prices soared due to the strong increase in inflation after the prolonged Covid-19 pandemic period, with central banks relaxing monetary policies to support the economy, along with disruptions in the global supply chain and political instability. However, as soon as the news about the Fed raising interest rates in March 2022 came out, gold prices started to plummet.
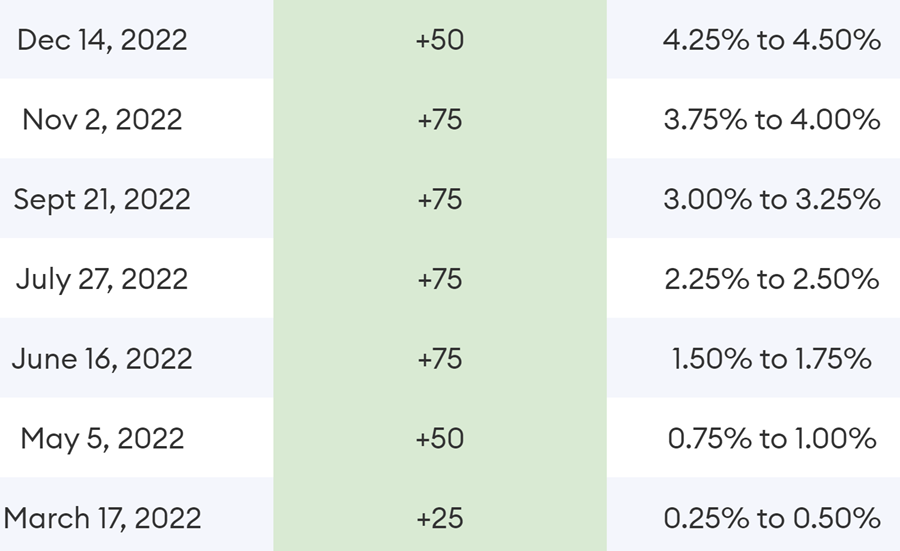
The FED raised interest rates during 2022 (Source: Forbes.com)
In 2022, the Fed raised interest rates 7 times, from 0.25% - 0.50% on March 17, 2022 to 4.25% - 4.50% on December 14, 2022. This caused the US dollar to strengthen, and gold touched a low of $1,618 per ounce in November 2022 (a loss of about 21% from the peak in March 2022).
However, the Fed's slowdown in the interest rate hike process since December 2022, along with many predictions about an economic recession in 2023, have helped gold prices rise strongly at the end of 2022 and end the year at $1,823 per ounce (up 12.6% from the November 2022 low).
Gold Trends in 2023
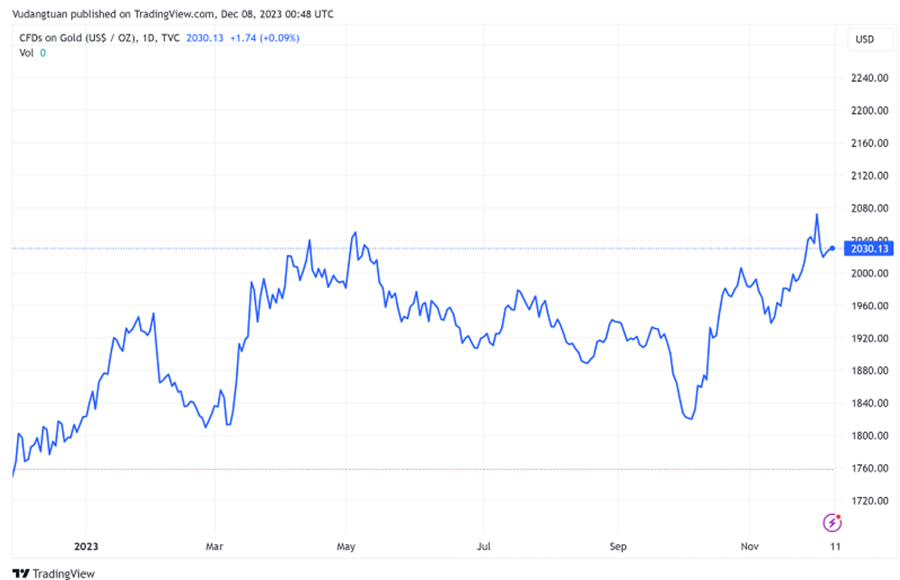
Gold price in 2023 (Source: Tradingview)
In 2023, gold received significant support from the Fed's slowdown in the interest rate hike process. By the end of 2023, expectations of the Fed cutting interest rates have helped gold prices reach a new all-time high of $2,150.
In addition, the factor driving gold prices this year also comes from the unexpected conflict that broke out in Israel-Palestine, which has caused oil prices to rise sharply and increased the risk of inflation returning. Looking at the chart, we can see that gold prices were adjusting at the end of October, but surged extremely strongly in mid-October when there was news of Hamas forces attacking Israel.
Gold Trends in 1 Half 2024
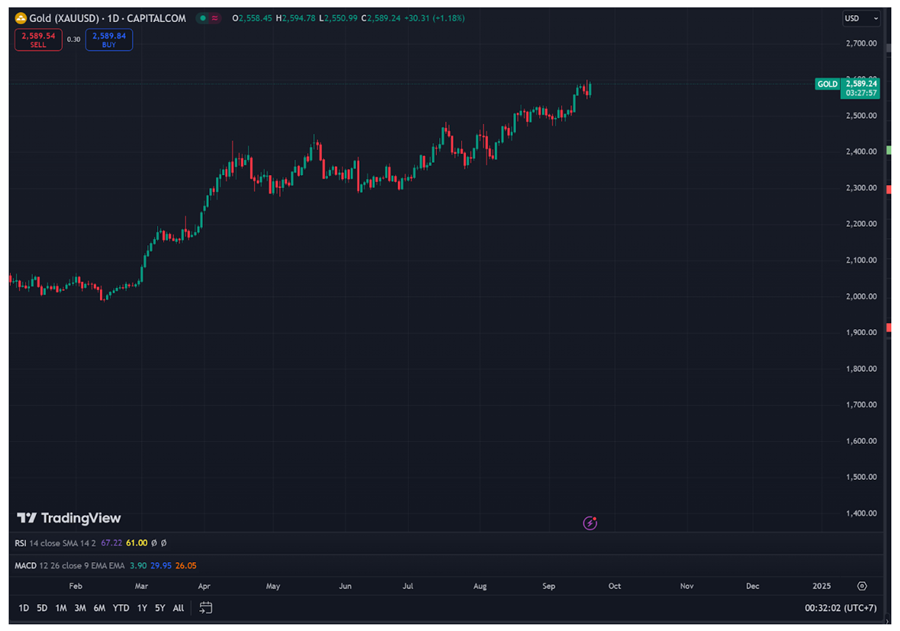
Gold price in 2024 (Source: Tradingview)
The gold price hit record levels in the first three months of 2024. Opening the period on January 2 at US$2,041.20 per ounce, gold maintained a relatively stable range for the first two months, hovering above US$2,000, before experiencing a brief dip in mid-February. This decline saw the price fall to a quarterly low of US$1,991.98 on February 13. However, the metal soon recovered, climbing steadily towards the start of March and ultimately reaching a quarterly high of US$2,251.37 on March 31.
In the first half of 2024, the price of gold experienced a significant surge, hitting several new record highs. The upward trend began in March, with the price of gold climbing to $2,160 per troy ounce. Gold's value continued to rise, reaching an all-time high of $2,472.46 per ounce in April. While the price moderated slightly in the following months, it remained elevated, with the current price (as of August 12, 2024) standing at $2,441 per ounce. This represents an increase of over $500 per ounce compared to one year ago
4. Gold Price Forecast for 2025/2026
Gold prices tend to fluctuate strongly during periods of economic difficulty with high inflation and investors' reactions to monetary policies in major economies such as the US, China, and Europe.
There are various forecasts for gold prices in 2025 and 2026 from major financial institutions and media around the world:
According to J.P.Morgan, gold prices are predicted to reach a new high above $2,300 per ounce in 2025.
Bloomberg Terminal forecasts gold prices will be in the range of $1,709.47 to $2,727.94 in 2025.
Coinpriceforecast believes gold prices could break the $27,000 mark by 2026.
Major banks and financial institutions like the World Bank and IMF also frequently adjust their gold price forecasts based on market developments.
Therefore, traders should regularly update and re-evaluate gold price forecasts for 2025/2026 to make wise investment decisions.
Additionally, considering the factors influencing gold prices is very important in the investment process.
Key Factors to Consider When Investing in Gold:
Strength of the US Dollar
A stronger US dollar usually means weaker gold. Always monitor US economic reports like the non-farm payroll and employment data.
Pace of Public Debt
Rising public debt levels in many countries are causing an increase in the money supply. This makes it likely that major central banks like China and India will aggressively buy gold, leading to scarcity and rising gold prices.
Central Bank Interest Rate Actions
The prospect of interest rate cuts will lead to an increase in gold prices to protect its value.
Geopolitical Tensions
Specifically, if tensions between Russia-Ukraine or Israel-Palestine show no signs of easing, gold prices will continue to rise. Both of these conflicts are the reason for surging oil prices and inflation, which particularly drive up gold prices.
5. How to analyze the price of gold?
Due to the fact that gold prices depend on many direct and indirect influences, analyzing gold prices requires investors to have broad knowledge in the fields of commodities, currency, politics, and economics, combined with analytical tools that can generate indicators such as MACD, RSI, and COT, in order to make accurate forecasts about the price trend of gold.
Below are some of the tools that investors often choose when determining the future direction of gold prices.
5.1 Gold price chart - MACD indicator
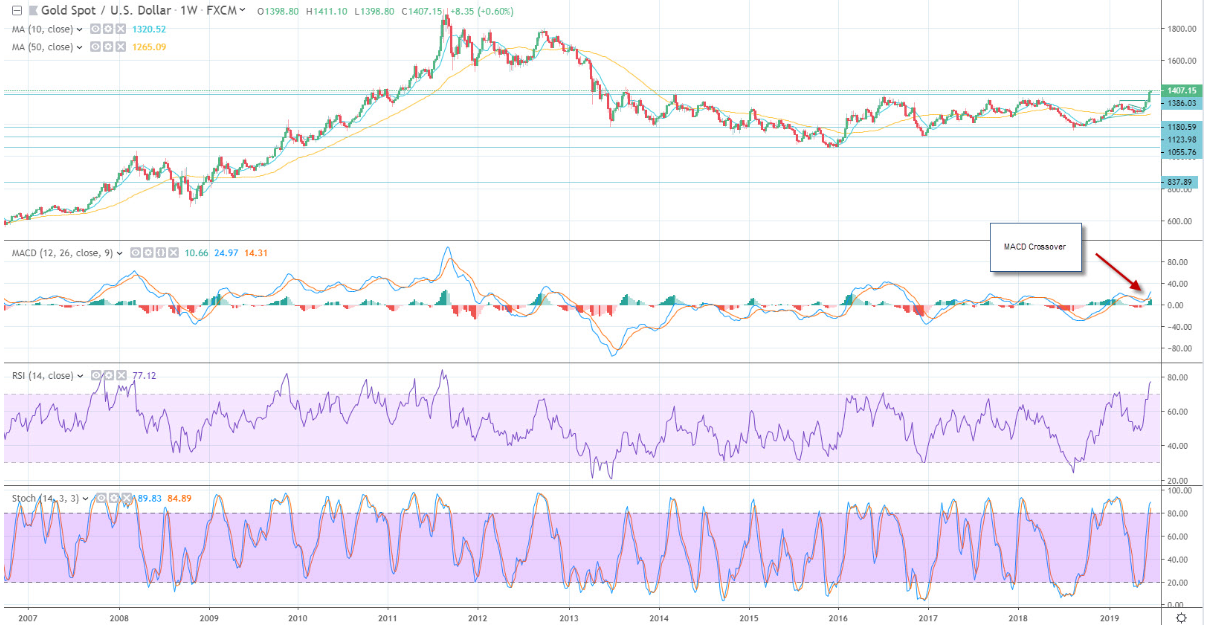
Using the MACD to Analyze Online Gold Price Charts - Source: Tradingview
The MACD (Moving Average Convergence Divergence) is a momentum indicator that uses moving averages (MA) or exponential moving averages (EMA) to calculate and identify reversal signals for a particular commodity in the market.
MACD is calculated using the 26-period EMA and the 12-period EMA, with the 9-period EMA as the signal line.
With the MACD indicator, investors can predict the trend as well as identify the price levels at which the price will rise or fall.
5.2 RSI (Relative Strength Index)
RSI (Relative Strength Index) is a popular and easily applicable momentum indicator used to identify overbought (sell signal) or oversold (buy signal) conditions in the gold market.
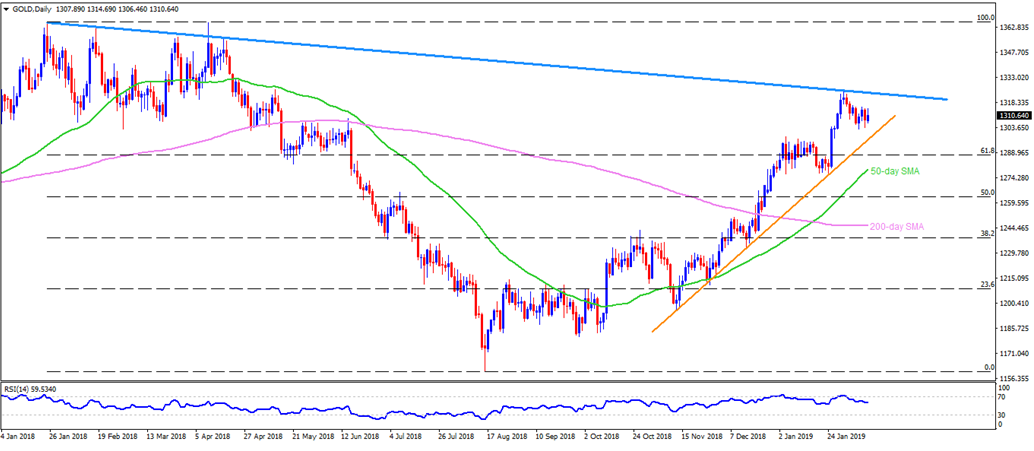
An online gold price analysis chart with the RSI indicator - Source: Forexcrunch
On a scale of 0 to 100, the gold market is considered overbought when the RSI is above 70 and oversold when it is below 30 (for a 14-day scale). However, investors often customize the 70 and 30 levels depending on whether they are using the RSI in a short-term or long-term trading cycle.
Another common way to use RSI is to look for regular and hidden divergence signals. Regular divergences occur when the asset (gold) is making a new high while the RSI is not surpassing its previous high, which signals an impending market reversal.
Furthermore, if the RSI drops below its recent low, a bearish divergence is giving a signal that a market reversal is about to occur.
To get more accurate results, determine whether the current market is trending or non-trending, as RSI divergences are not as strong in a trending market. RSI is particularly useful when used in conjunction with other indicators.
5.3 Gold Market Sentiment - COT Report
The COT (Commitment of Traders) report is a summary of the long/short positions in the market on the CME (a non-profit organization headquartered in Chicago that provides futures, options, and is the world's leading diversified derivatives marketplace) and is finalized on Tuesdays for over 20 investors holding positions equal to or greater than the reportable level set by the CFTC (Commodity Futures Trading Commission).
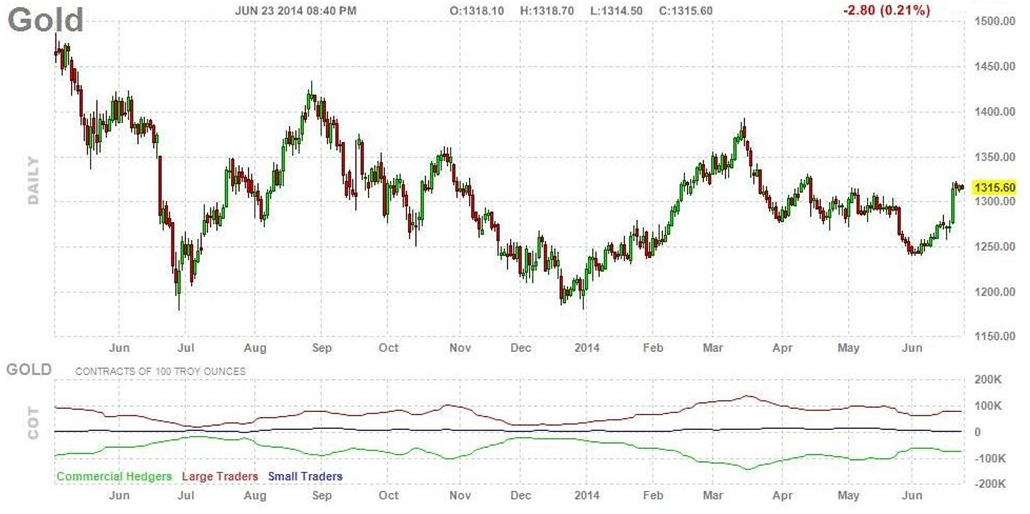
A COT report on gold - Source: Staticflickr
The weekly COT report is released every Friday at 3:30 p.m. (EST), which corresponds to 4:30 a.m. on Saturday in Vietnam.
The COT report is used as a tool to determine the direction of the money flow in the market and from there, decide the next market trend.
Commercial Hedgers (those avoiding risk): Green line
Large Traders (large speculators): Red line
Small Traders (small speculators): Purple line
5.4 The Value of the US Dollar
Fundamentally, the value of gold is usually inversely proportional to the value of the US dollar. When the value of the US dollar is strong, it tends to make the price of gold more stable, and when the value of the US dollar is weak, it can lead to gold being pushed to higher prices because when the US dollar depreciates, investors tend to seek a safer asset that has the potential for price appreciation.
Gold has a term interest rate, similar to the US dollar. This interest rate is called the Gofo rate, which rises compared to the US dollar when the demand for gold increases.
5.5 Gold Demand
Demand for gold from industries (especially technology, jewellery and gemstones) and financial institutions such as ETFs and central banks has a significant impact on the price of gold. Investment demand and the use of gold in business operations will drive up the price of gold. At the same time, central banks increasing their gold reserves also affects investor sentiment in holding gold long-term and helps stabilise the price of gold.
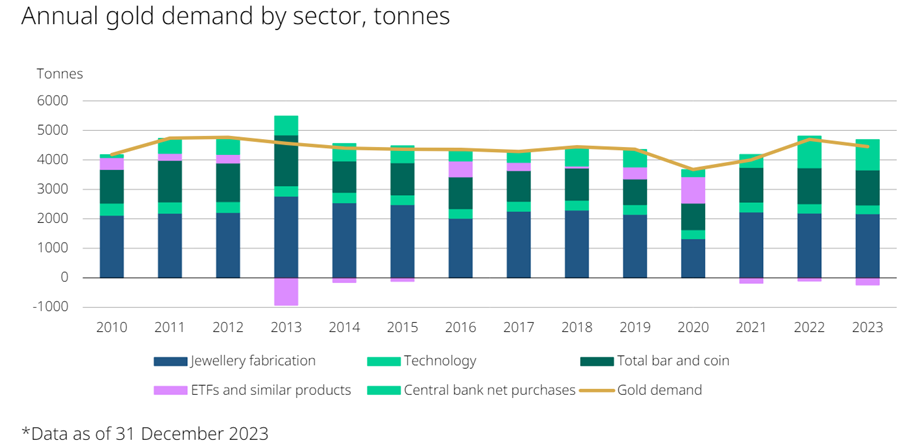
Gold Demand Chart (Source: Metals Focus, Refinitiv GFMS, World Gold Council)
The high gold price in 2023 reflects an overall strong demand environment for the precious metal. Central bank buying remained at a breakneck pace, nearly matching the record purchases seen in 2022. This robust official sector demand, combined with resilient jewellery consumption globally, was able to offset sizable outflows from gold-backed exchange traded funds (ETFs).
5.6 New Gold Mines
Gold production has increased significantly in recent years, but many experts predict that production has reached its peak.
The reason is that the "easy to mine" gold mines have all been exhausted, and now we have to dig deeper to find quality gold sources. This means we have to spend more money to extract it, but we get less gold, leading to higher gold prices.
6. Gold investment experiences and tips
To invest in gold effectively, in addition to using fundamental and technical analysis methods to evaluate trends and buying and selling points, apply investment tips summarised and shared by rich investors. Experience will bring many benefits to traders. Here are 10 effective gold investment tips:
Investment form: Depending on the purpose and gold investment strategy, traders choose the appropriate form such as short-term, medium-term or long-term investment.
For investors with long-term idle capital and low risk tolerance, long-term physical gold investment will be a good choice in the near future when gold is forecast to follow an upward trend.
On the contrary, investors with small investment capital or high risk tolerance can participate in the derivatives market (futures or CFDs ) to take advantage of financial leverage as well as two-way profit advantages. However, investing in the derivatives market requires traders to have good investment knowledge and experience to effectively manage risks.
Time to invest: Time to invest will depend on the form and purpose of the trader's investment. If investing long-term, traders can choose to buy gold from January to June when gold prices are often forecast to decrease compared to the last months of the year.
If investing short-term, during the day or during the week in the derivatives market, traders need to monitor when gold has a clear trend to be safer when entering orders.
Allocating investment capital: traders should not invest all of their existing capital in gold, but instead can choose to allocate it at a rate of 10%, 20%, 30%... depending on the level of clarity of the investment. Market trends and trader's analytical abilities.
Choosing financial leverage ratio: for traders new to the market, choosing high financial leverage can bring high risks. Leverage 1:2 ~ 1:5 may be more suitable for new traders.
Risk management: always use stop loss orders when trading in the derivatives market to avoid large losses when prices go against the predicted trend. In addition, traders can use trailing stop loss orders to increase profits when the price is following the predicted trend.
7. Conclusion
It can be seen that the current trend of gold price in the short term is sideways or adjusting. However, most markets are expecting it to continue to increase in price in 2025 - 2026 due to the approaching FED interest rate cutting cycle and unstable situations in many hot spots in the world such as Russia - Ukraine and Israel. - Palestine.
That's why short-term investment - contracts for difference (margin trading/leverage) is being mentioned as a wise form of investment at the moment because of its two-way nature, with contracts for difference between investors and investors. Investors can completely rely on short-term market flows to conduct transactions because margin trading is a form of investment that allows investors to execute both buy and sell orders.
Is gold a safe-haven investment?
What are the key factors driving the gold price forecast for 2024-2026?
How do interest rates affect gold prices?
What role does inflation play in gold price forecasting?
Before making any trading decisions, it is important to equip yourself with sufficient fundamental knowledge, have a comprehensive understanding of market trends, be aware of risks and hidden costs, carefully consider investment targets, level of experience, risk appetite, and seek professional advice if necessary.
Furthermore, the content of this article is solely the author's personal opinion and does not necessarily constitute investment advice. The content of this article is for reference purposes only, and readers should not use this article as a basis for any investment decisions.
Investors should not rely on this information as a substitute for independent judgment or make decisions solely based on this information. It does not constitute any trading activity and does not guarantee any profits in trading.
If you have any inquiries regarding the data, information, or content related to Mitrade in this article, please contact us via email: insights@mitrade.com. The Mitrade team will carefully review the content to continue improving the quality of the article.


