


Silver Price Forecast: XAG/USD trades near $36.00 support, ascending channel’s lower boundary

 Trending Articles
- Gold Price Forecast: XAU/USD keeps looking for direction above $4,500
- WTI declines below $102.00 after Trump says he called off Iran attacks
- Gold falls below $4,500 on rising global rate hike bets
- Forex Today: Risk flows dominate markets on US-Iran deal hopes
- Gold holds steady near $4,550 as market eyes Middle East developments
- US President Donald Trump will swear in Kevin Warsh on Friday to lead Fed
Silver price may find immediate resistance at $36.89, the highest since February 2012.
The 14-day Relative Strength Index remains below the 70 level, indicating a persistent bullish bias.
The ascending channel’s lower boundary around $36.10 acts as the immediate support.
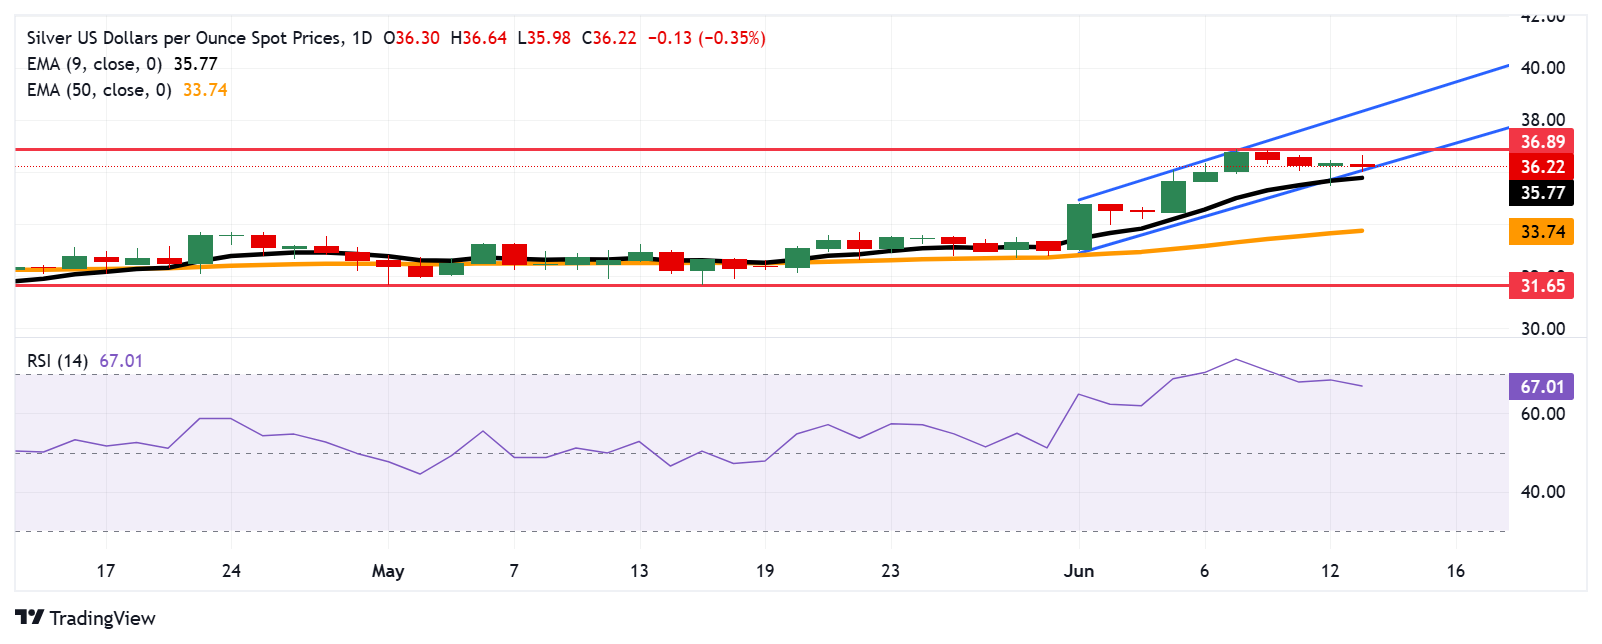
Silver price (XAG/USD) retraces its recent gains registered in the previous session, trading around $36.30 per troy ounce during the Asian hours on Friday. A bullish bias is prevailing as the technical analysis of the daily chart shows the price of the precious metal remains within an ascending channel pattern.
The Silver price is remaining above the nine-day Exponential Moving Average (EMA), further highlighting that the short-term momentum is stronger. Additionally, the 14-day Relative Strength Index (RSI) hovers slightly below the 70 level after retreating from higher levels, indicating a prevailing bullish bias while also suggesting the potential for a continued downward correction.
The XAG/USD pair may test the immediate barrier at $36.89, the highest since February 2012. A break above this level may strengthen the bullish bias and support the pair to approach the upper boundary of the ascending channel around $38.50.
Silver price is testing the ascending channel’s lower boundary around $36.10, followed by the nine-day EMA at $35.77. A break below this crucial support zone could weaken the short-term price momentum and put downward pressure on the 50-day EMA at $33.74.
A successful breach below the 50-day EMA could dampen the medium-term price momentum and prompt the price of the precious metal to navigate the region around the two-month low at $31.65, which was recorded on May 15.
XAG/USD: Daily Chart
Read more
* The content presented above, whether from a third party or not, is considered as general advice only. This article should not be construed as containing investment advice, investment recommendations, an offer of or solicitation for any transactions in financial instruments.


