Oil Price Forecast: WTI rallies to $74 before settling above $72

Source Fxstreet
  • WTI Oil surges above $72 as Israel-Iran tensions trigger a breakout.
  • Gains for June are near 20%, pushing prices above key Fibonacci levels from longer-term moves.
  • The 12-month moving average provides additional support below $70.

WTI crude oil is surging amid escalating geopolitical tensions, with Israel’s recent strikes on Iran fueling a rally that pushed prices above the $74.00 handle on Friday. At the time of writing, WTI is trading just below $72.00 after Iran responded with its own missile barrage, marking a near 20% gain for June and reversing much of the weakness observed earlier this year.

Despite broad-based pressure in the first half of 2025, the recent price surge has lifted WTI back above several key technical levels, with bullish momentum building across multiple timeframes.

WTI Oil long-term setup

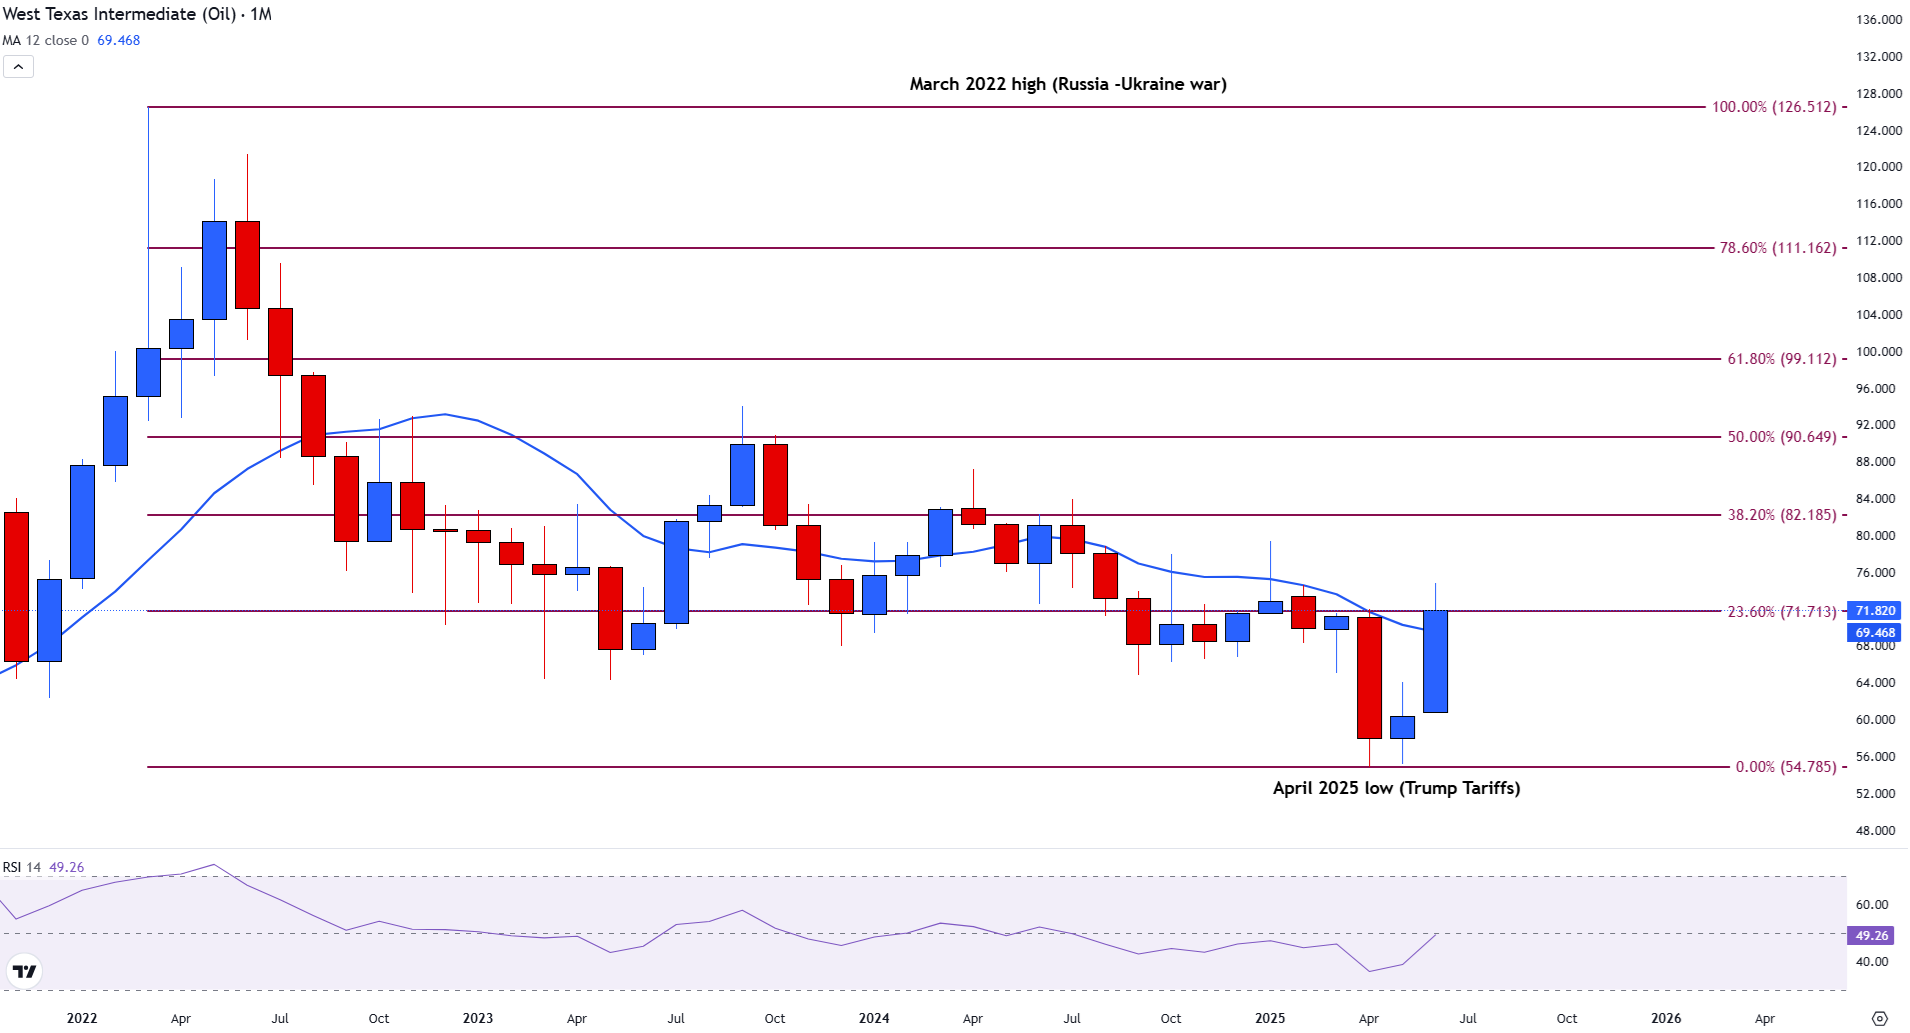
From a longer-term perspective, WTI has reclaimed the 12-month Simple Moving Average (SMA), currently sitting at $69.46. This level now serves as dynamic support. Above, resistance is forming at the 23.6% Fibonacci retracement of the March 2022 high to the April 2025 low, located at $71.71.

WTI Oil Monthly Chart
WTI Oil medium-term setup

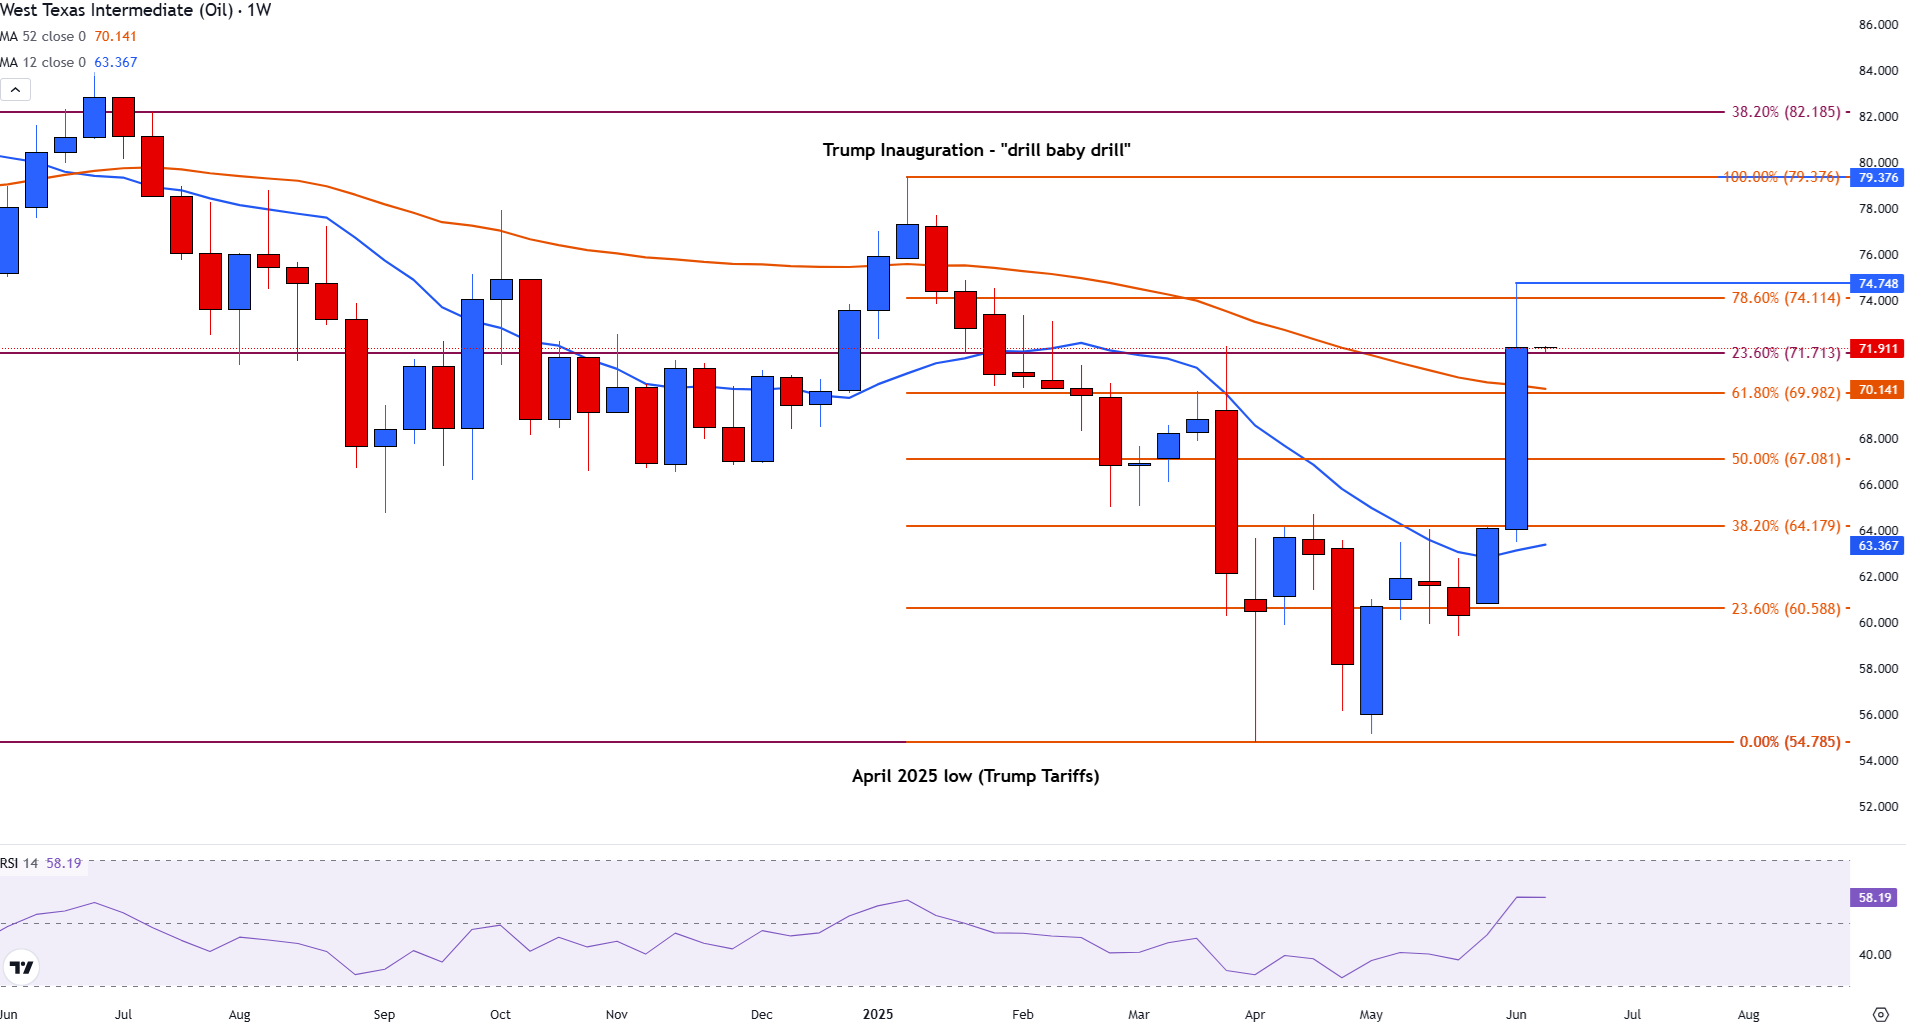
On the weekly chart, WTI broke above the 12-week SMA at $63.29 following the Iran-Israel escalation, marking a pivotal shift in sentiment. This surge has brought prices up to the 78.6% Fibonacci retracement of the January–April decline at $74.11. The 12-week SMA continues to offer support near $63.31, underlining a strong base for bulls.

WTI Oil Weekly Chart
WTI Oil short-term setup

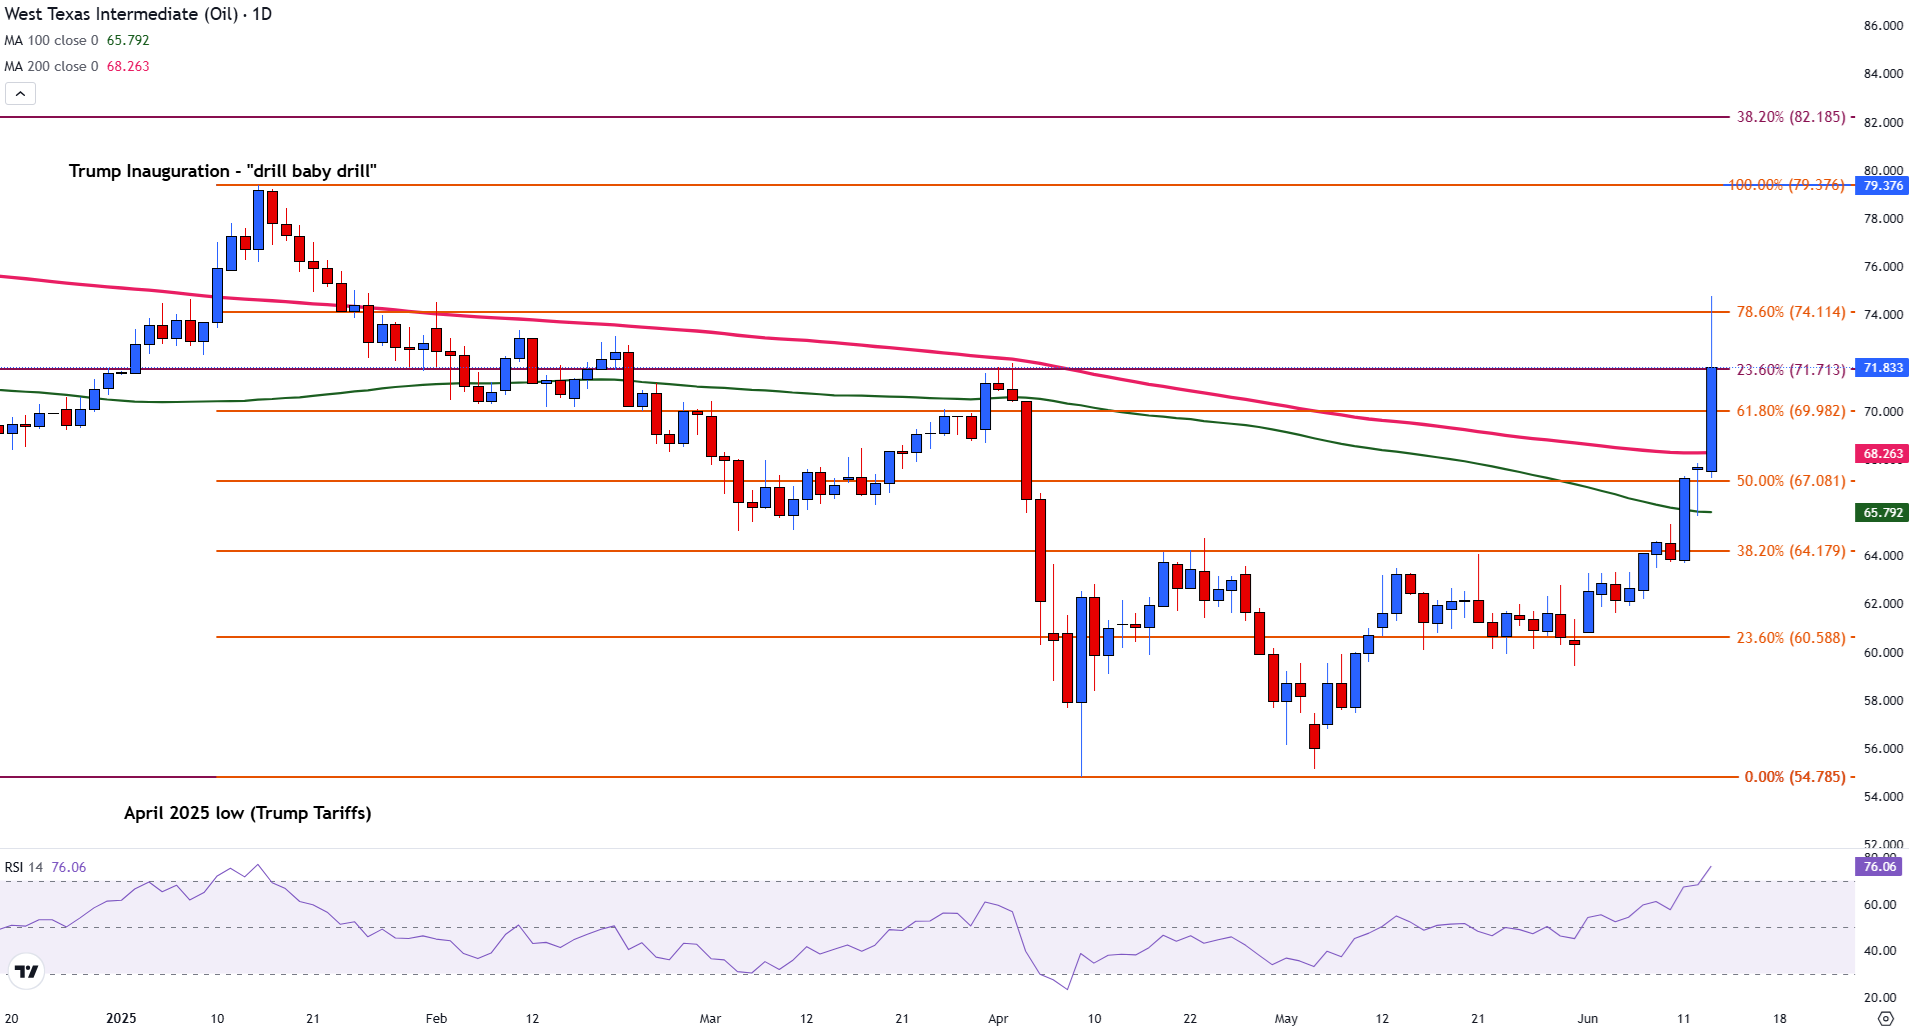
Zooming into the daily chart, Friday’s bullish momentum drove a decisive move above both the 100-day and 200-day SMAs, strengthening the case for further upside. Technical confluence with long-term Fibonacci levels adds credibility to the breakout.

The Relative Strength Index (RSI) on the daily timeframe currently sits at 76, signaling overbought conditions. However, with the geopolitical backdrop intensifying, fundamental support may ultimately prevail over short-term exhaustion.

WTI Oil Daily Chart
Looking ahead: What’s next for Oil?

If WTI breaks and holds above $74.11 early next week, momentum could carry it toward $76.00 and eventually $78.00. Conversely, failure to maintain levels above $71.71 may trigger a retracement, especially if geopolitical tensions ease or if market focus returns to demand-side concerns.


Disclaimer: For information purposes only. Past performance is not indicative of future results.
placeholder
Bitcoin ETF Inflows For 2025 Now Outpace 2024, Data ShowsUS Bitcoin spot exchange-traded funds (ETFs) have seen more inflows this year so far compared to the same point in 2024, according to data.
Author  Bitcoinist
Jul 16, Wed
US Bitcoin spot exchange-traded funds (ETFs) have seen more inflows this year so far compared to the same point in 2024, according to data.
placeholder
Australian Dollar declines as US Dollar gains amid nearing government shutdown endThe Australian Dollar (AUD) weakens against the US Dollar (USD) on Wednesday, extending its losses for the second successive session. The AUD/USD pair declines as the US Dollar (USD) gains support from the ongoing process to reopen the United States (US) government.
Author  FXStreet
Yesterday 02: 29
The Australian Dollar (AUD) weakens against the US Dollar (USD) on Wednesday, extending its losses for the second successive session. The AUD/USD pair declines as the US Dollar (USD) gains support from the ongoing process to reopen the United States (US) government.
placeholder
Gold consolidates near three-week high as risk-on mood offsets dovish Fed betsGold (XAU/USD) is seen hovering near a three-week high during the Asian session on Wednesday, with bulls awaiting a move beyond the $4,150-4,155 horizontal barrier before positioning for any further appreciating move.
Author  FXStreet
20 hours ago
Gold (XAU/USD) is seen hovering near a three-week high during the Asian session on Wednesday, with bulls awaiting a move beyond the $4,150-4,155 horizontal barrier before positioning for any further appreciating move.
placeholder
USD/JPY tests 155 as Tokyo fix buying lifts pair – INGThe US Dollar (USD) recovered overnight after a brief dip on weaker ADP jobs data, with USD/JPY leading gains toward the key 155 resistance. Buying around the Tokyo fix and ongoing investment inflows into the US are keeping the pair supported, even as Japanese officials step up verbal warnings.
Author  FXStreet
16 hours ago
The US Dollar (USD) recovered overnight after a brief dip on weaker ADP jobs data, with USD/JPY leading gains toward the key 155 resistance. Buying around the Tokyo fix and ongoing investment inflows into the US are keeping the pair supported, even as Japanese officials step up verbal warnings.
placeholder
Gold edges toward $4,200 as shutdown deal fuels aggressive December Fed cut betsGold trades near $4,195 in early Asian dealings, brushing up against the $4,200 mark as hopes for a U.S. shutdown-ending funding bill and a nearly 64% market-implied chance of a December Fed rate cut support XAU/USD, even as a divided Federal Reserve and upcoming policymaker speeches threaten to steady the dollar and cap bullion’s latest advance.
Author  Mitrade
52 mins ago
Gold trades near $4,195 in early Asian dealings, brushing up against the $4,200 mark as hopes for a U.S. shutdown-ending funding bill and a nearly 64% market-implied chance of a December Fed rate cut support XAU/USD, even as a divided Federal Reserve and upcoming policymaker speeches threaten to steady the dollar and cap bullion’s latest advance.
goTop
quote