


Dow Jones Industrial Average flattens on tepid Monday
- The Dow Jones huddled close to 42,000 to kick off the new week.
- Investors are awaiting key US labor data due on Friday.
- Despite quiet Monday, the Dow Jones is coming off a winning month.
The Dow Jones Industrial Average (DJIA) was hamstrung near Monday’s opening bids at the start of a fresh trading week. The major equity index stuck close to the 42,200 level, with stock traders eyeing data risks and rate markets grappling with the odds of a follow-up cut from the Federal Reserve (Fed) in November.
Market focus will be slowly swinging around toward Friday’s US Nonfarm Payrolls report as investors look for further data on the state of the US economy. Rate traders continue to muse over November’s Fed rate call, with odds tipped slightly in favor of a meager 25 bps cut. However,m many market participants are still hoping for a follow-up double cut for 50 bps when the Fed gathers again for another rate call on November 7.
A looming port strike along the East and Gulf Coasts is hampering investor expectations for economic activity in the near term, crimping investor demand and cooling stock advances. Adding to downside pressure in equities, Fed officials drew a line in the sand on Fed rate cuts, noting that it would take a further deterioration of the US labor market to spur further large moves from the Fed. This proposition weighs poorly on otherwise rate-cut-hungry market participants, as further declines in jobs data would signal greater risk of an impending US recession.
Dow Jones news
The Dow Jones is broadly weaker on Monday, with over two-thirds of the stock index testing into the red early in the new trading week. However, firm gains for major components are helping to constrain broader losses in the DJIA.
Boeing (BA) is getting weighed down by its own ongoing strike, which has now gone on for two weeks. The aerospace company shed 2.45% on Monday, slipping below $125.50 per share. On the high side, Apple (AAPL) rose 1.6% to over $231 per share despite the company announcing it was walking away from a capital-raising round for a planned investment into OpenAI. Apple’s pullback from an investment into a major AI project has raised some eyebrows, flashing warning signs that OpenAI’s recent pivot into seeking profitability may have some roadblocks on the way ahead.
Dow Jones price forecast
Despite a tepid Monday, the Dow Jones is set to chalk in a stellar September performance. The major equity index hit a record new high last week of 42,636, and added over 1.5% over the month. The Dow Jones is on pace to close for a fifth consecutive month in the green, climbing over 13.5% bottom-to-top from April’s lows near 37,550.
Dow Jones daily chart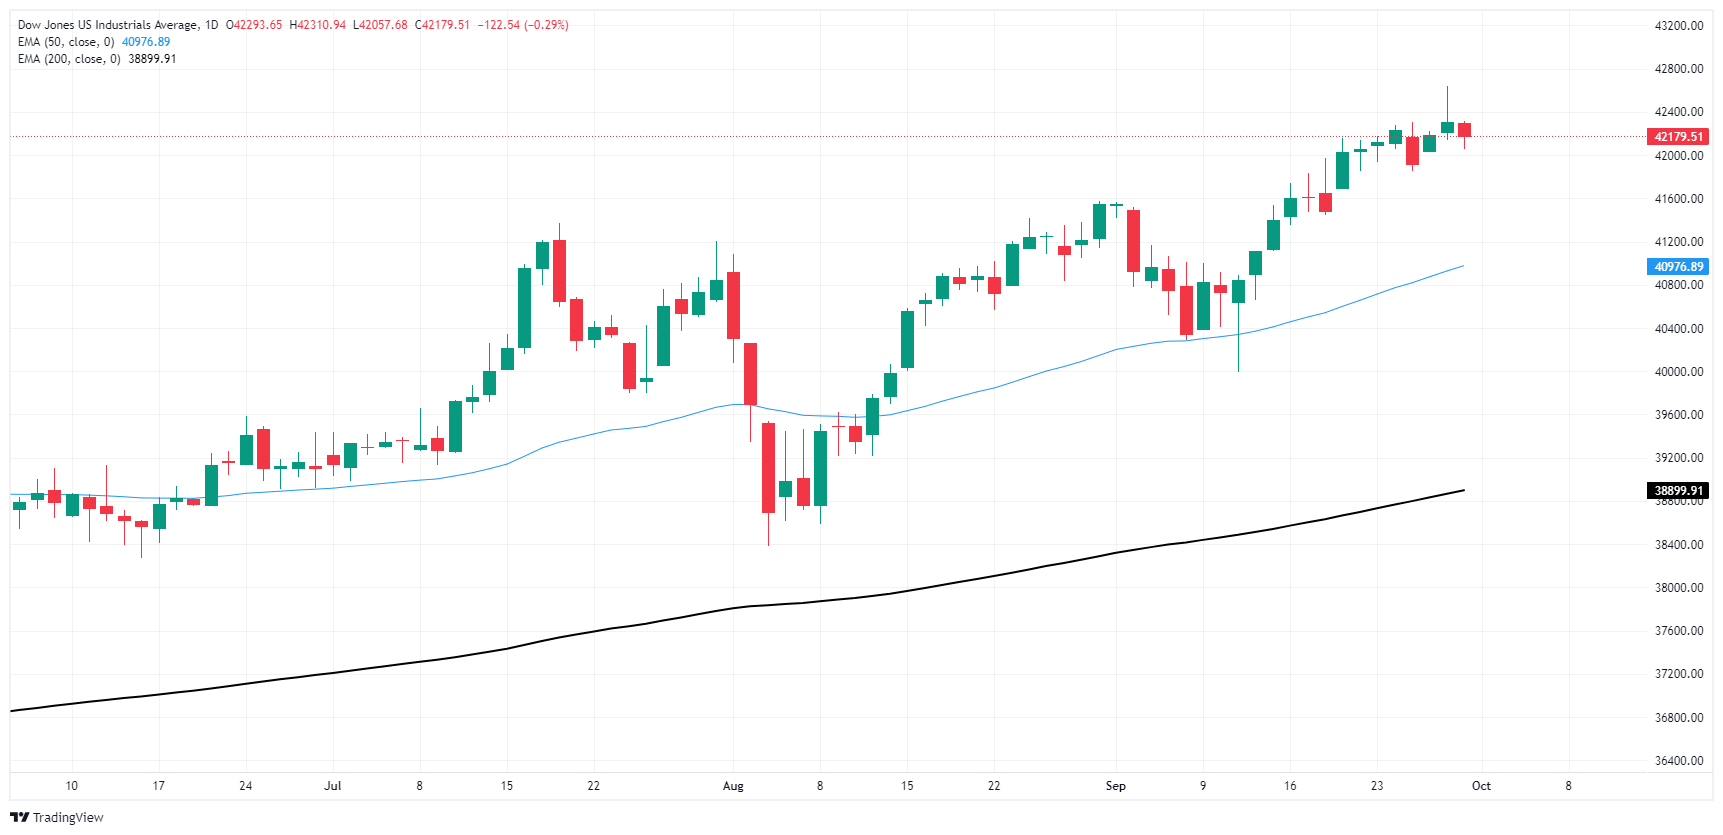
Dow Jones FAQs
The Dow Jones Industrial Average, one of the oldest stock market indices in the world, is compiled of the 30 most traded stocks in the US. The index is price-weighted rather than weighted by capitalization. It is calculated by summing the prices of the constituent stocks and dividing them by a factor, currently 0.152. The index was founded by Charles Dow, who also founded the Wall Street Journal. In later years it has been criticized for not being broadly representative enough because it only tracks 30 conglomerates, unlike broader indices such as the S&P 500.
Many different factors drive the Dow Jones Industrial Average (DJIA). The aggregate performance of the component companies revealed in quarterly company earnings reports is the main one. US and global macroeconomic data also contributes as it impacts on investor sentiment. The level of interest rates, set by the Federal Reserve (Fed), also influences the DJIA as it affects the cost of credit, on which many corporations are heavily reliant. Therefore, inflation can be a major driver as well as other metrics which impact the Fed decisions.
Dow Theory is a method for identifying the primary trend of the stock market developed by Charles Dow. A key step is to compare the direction of the Dow Jones Industrial Average (DJIA) and the Dow Jones Transportation Average (DJTA) and only follow trends where both are moving in the same direction. Volume is a confirmatory criteria. The theory uses elements of peak and trough analysis. Dow’s theory posits three trend phases: accumulation, when smart money starts buying or selling; public participation, when the wider public joins in; and distribution, when the smart money exits.
There are a number of ways to trade the DJIA. One is to use ETFs which allow investors to trade the DJIA as a single security, rather than having to buy shares in all 30 constituent companies. A leading example is the SPDR Dow Jones Industrial Average ETF (DIA). DJIA futures contracts enable traders to speculate on the future value of the index and Options provide the right, but not the obligation, to buy or sell the index at a predetermined price in the future. Mutual funds enable investors to buy a share of a diversified portfolio of DJIA stocks thus providing exposure to the overall index.
Recommended Articles


