


Dow Jones Industrial Average slides as yields beat the Fed to tomorrow's hike
- DJIA slides just under 52,000, down around 450 points, as yields top 5% before the Fed
- Fed set to hike a quarter-point Wednesday, first since July 2023, priced at 92.5%
- Treasury buybacks tripled to $6 billion, 10-year up 0.4 of a point since August 19
The Dow Jones Industrial Average trades just under 52,000, down around 450 points, a day before the Fed's first expected hike since July 2023. Bets in the futures market put the odds of a quarter-point at 92.5%, so Wednesday's vote is not the news. The rate that moved is the yield on the 10-year Treasury, the price the government pays to borrow for a decade. It touched 5.04% on Tuesday, its highest since 2007, and it is the rate the Dow's companies and their customers borrow at. The Fed sets the other one.
A third of a point from the market, a quarter-point from the Fed
The Fed's rate is what banks pay for money overnight, and on Wednesday it is expected to move from 3.50-3.75% to 3.75-4.00%. The 10-year is the one a mortgage, a car loan and a corporate bond are priced off, not the Fed's. It has risen five sessions in a row and close to a third of a point in four weeks, and the committee has not voted yet.
That splits the index. The quarter-point is a bank event first. JPMorgan (JPM) and Goldman Sachs (GS) pay and charge the overnight rate, and because the index weights by share price, the two of them are about a sixth of it.
The third of a point is a customer event for the other 28. It sets what their customers pay to finance a house or a factory, and the customers have been paying it since August. Wednesday's hike comes with a statement and a press conference. The bond market's came without either.
A month of Treasury buybacks bought a higher yield
The Treasury said on August 19 that it would at least double its buybacks, the operations in which it buys back its own 10- to 30-year debt, from $2 billion each to $4 billion. The 10-year yield fell to 4.64% that afternoon. On September 9 it raised that week's operation to $6 billion, the yield rose to 4.85% the same day, and the index lost about 400 points.
The September 10 operation took $5.19 billion of the $10.49 billion holders put up for sale, because the Treasury would not pay the prices asked. Treasury Secretary Scott Bessent said last week that the Treasury market is in very good shape and that he is the house now, a line he later softened. The 10-year touched 5.04% on Tuesday, the morning he was due before the House Financial Services Committee. The rate the buybacks were meant to lower is the one the index's customers pay.
The Fed will answer a shut pipeline by charging banks more overnight
The hike lands on an economy whose New York Fed factory survey fell to 7.6 on Tuesday, against a forecast of 14.75 and 20.6 in August. Thursday's Philadelphia version is forecast to fall from 47.4 to 30.5. Those surveys ask factories whether orders are rising, and orders are what Caterpillar (CAT), about a tenth of the index at its share price, and 3M (MMM) sell into.
Consumer prices rose 3.4% in the year to August, with fuel doing much of the work, and that is the inflation the hike answers. West Texas Intermediate (WTI) Crude Oil trades near $104.00 and Brent near $108.00, a cost line for every member of the index except Chevron (CVX). Saudi Arabia shut the pipeline that carries its Crude Oil around the Strait of Hormuz after a strike it blames on Iran-backed groups in Iraq, and some Saudi sources put the repair at more than a month. The vote takes an afternoon.
Wednesday's hike was written down in June
The decision lands at 18:00 GMT on Wednesday, with the forecast taking the top of the Fed's range to 4.00% from 3.75%. It would be the first hike of the Chair's tenure and the first increase since 2023 in what the index's two banks pay for overnight money. Futures have a second hike by December, a third by March, and the rate at 4.25% or higher through the end of 2027.
The committee's June projections, the chart of dots showing where each member expects the rate to be, already had it. The median for the end of 2026 was 3.8%, with 3.6% for the end of 2027, and nine of the 18 who submitted one saw at least one hike this year. The chart the market has now overtaken has 18 dots and no Chair, because he chose not to submit one.
Retail sales at 12:30 GMT the same day are forecast up 0.8% after a 0.6% fall, counted in dollars. The control group, which strips out fuel, cars and building materials, fell 0.4% in July and carries no forecast. Thursday's housing starts, forecast at 1.31 million against 1.239 million, are the first August read on the customers of Home Depot (HD). A Fed governor speaks at 07:30 GMT on Friday, and August industrial production follows at 13:15 GMT, forecast up 0.3%.
Levels and bias
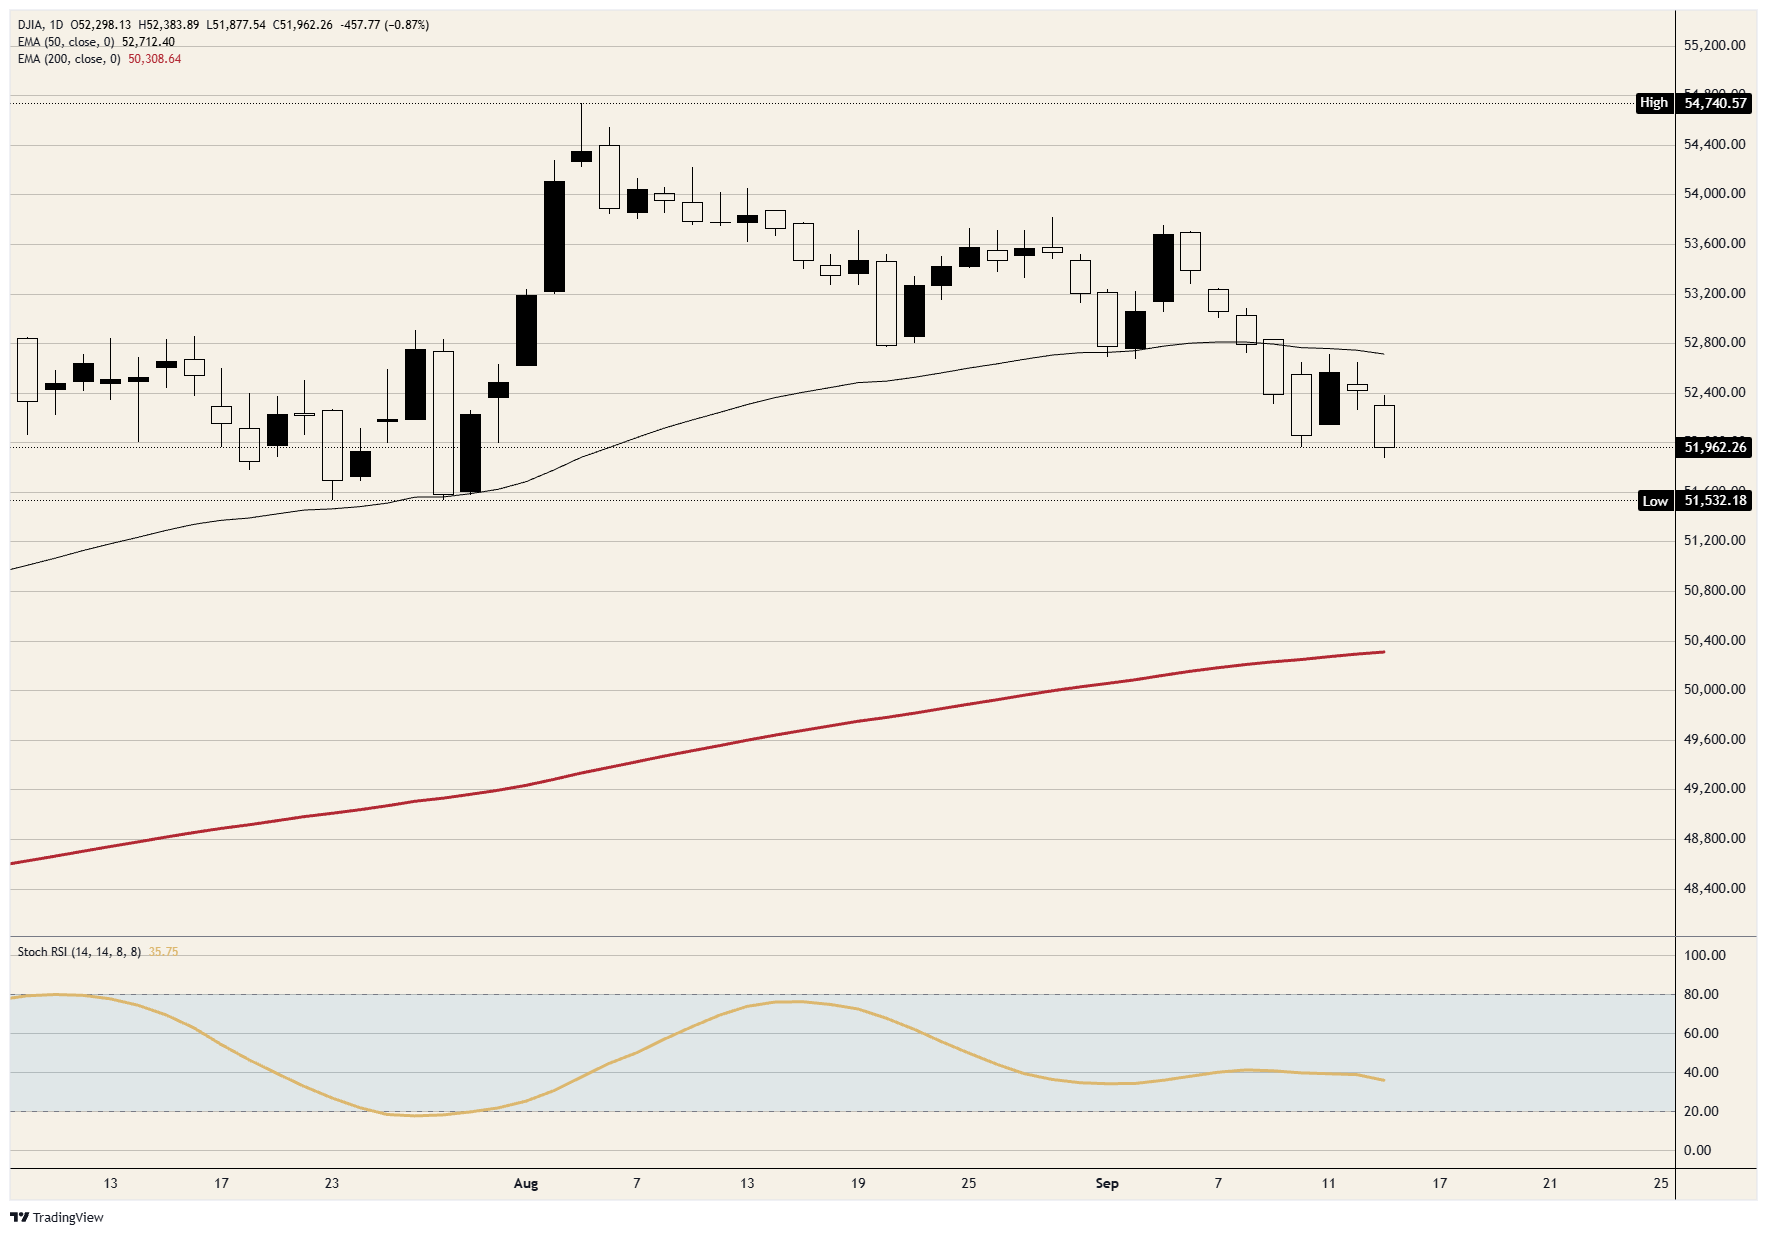
Resistance: Today's high just under 52,400 is the first hurdle. The 50-day Exponential Moving Average (EMA) near 52,700 is the cap, and the index has now spent four sessions failing to get back above it. 53,000 is the next one, last traded on September 8.
Support: Today's low just under 51,900 is the first floor, and it already sits below Thursday's. The late-July base just above 51,500 is the one that matters, and 51,000 is the next round number beneath it.
Bias: Bearish while the 50-day EMA near 52,700 caps, with the late-July base just above 51,500 the first objective and 51,000 the second. The daily Stochastic Relative Strength Index (Stoch RSI), a momentum gauge, reads near 36 and is still pointing down, so the selling has not run out. A daily close back above the 50-day EMA voids the case.
Dow Jones daily chart
Dow Jones FAQs
The Dow Jones Industrial Average, one of the oldest stock market indices in the world, is compiled of the 30 most traded stocks in the US. The index is price-weighted rather than weighted by capitalization. It is calculated by summing the prices of the constituent stocks and dividing them by a factor, currently 0.152. The index was founded by Charles Dow, who also founded the Wall Street Journal. In later years it has been criticized for not being broadly representative enough because it only tracks 30 conglomerates, unlike broader indices such as the S&P 500.
Many different factors drive the Dow Jones Industrial Average (DJIA). The aggregate performance of the component companies revealed in quarterly company earnings reports is the main one. US and global macroeconomic data also contributes as it impacts on investor sentiment. The level of interest rates, set by the Federal Reserve (Fed), also influences the DJIA as it affects the cost of credit, on which many corporations are heavily reliant. Therefore, inflation can be a major driver as well as other metrics which impact the Fed decisions.
Dow Theory is a method for identifying the primary trend of the stock market developed by Charles Dow. A key step is to compare the direction of the Dow Jones Industrial Average (DJIA) and the Dow Jones Transportation Average (DJTA) and only follow trends where both are moving in the same direction. Volume is a confirmatory criteria. The theory uses elements of peak and trough analysis. Dow’s theory posits three trend phases: accumulation, when smart money starts buying or selling; public participation, when the wider public joins in; and distribution, when the smart money exits.
There are a number of ways to trade the DJIA. One is to use ETFs which allow investors to trade the DJIA as a single security, rather than having to buy shares in all 30 constituent companies. A leading example is the SPDR Dow Jones Industrial Average ETF (DIA). DJIA futures contracts enable traders to speculate on the future value of the index and Options provide the right, but not the obligation, to buy or sell the index at a predetermined price in the future. Mutual funds enable investors to buy a share of a diversified portfolio of DJIA stocks thus providing exposure to the overall index.
Recommended Articles


