

Dow Jones Industrial Average drops as hot PPI data fuels stagflation fears

Source Fxstreet
  • US wholesale inflation came in well above expectations, with producer prices rising 0.7% in February against a 0.3% forecast.
  • The Federal Reserve (Fed) is set to hold interest rates steady as markets brace for updated economic projections.
  • Oil prices climbed above $95 per barrel after Iran threatened to strike energy infrastructure in Saudi Arabia, Qatar and the UAE.
  • Consumer staples and healthcare names led losses on the Dow, while energy and industrial stocks bucked the trend.

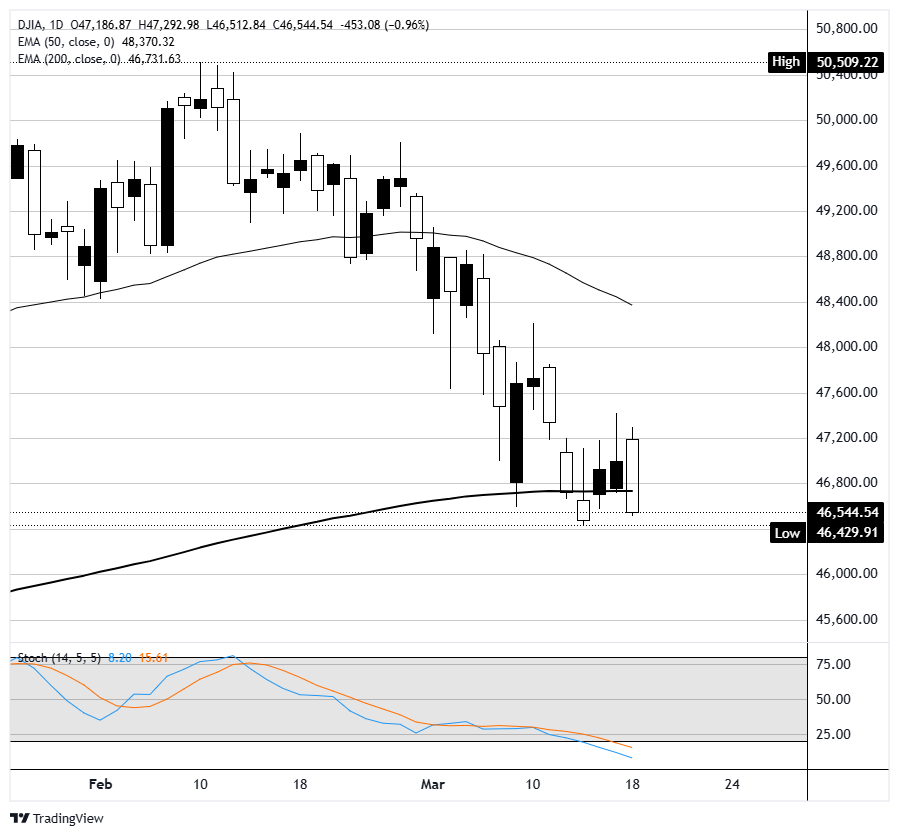
The Dow Jones Industrial Average fell nearly 1% on Wednesday, shedding over 450 points as a hotter-than-expected Producer Price Index (PPI) print landed on the same day as the Federal Open Market Committee (FOMC) rate decision. The S&P 500 dropped around 0.7% and the Nasdaq Composite lost roughly 0.5%, with risk appetite squeezed by accelerating inflation data and elevated Crude Oil prices. The session reflected growing unease about the Fed's ability to cut rates this year, with price pressures still building.

Wholesale inflation accelerates across the board

The Bureau of Labor Statistics (BLS) reported that the PPI for final demand rose 0.7% month-over-month in February, more than double the 0.3% consensus estimate and up from a 0.5% increase in January. On a year-over-year basis, headline PPI accelerated to 3.4%, its highest reading in a year and well above the 2.9% forecast. Core PPI, stripping out food and energy, rose 0.5% on the month against expectations for 0.3%, while the annual core reading jumped to 3.9% from 3.5%. The data is particularly concerning because it captures price pressures before the full impact of surging energy costs from the Iran conflict showed up. Analysts noted that tariff-related input costs in metals and industrial materials were a key driver.

Fed holds rates as stagflation risk builds

The FOMC is broadly expected to hold the federal funds rate steady on Wednesday, however the accompanying Summary of Economic Projections (SEP) and updated dot plot will be the main event, with Wall Street watching for any shift in the committee's rate path. In December, the median dot had pointed to just one 25-basis-point cut in 2026, and most analysts expected little change given the conflicting signals from a softening labor market and sticky inflation. The CME FedWatch Tool showed futures pricing in only a single rate cut by year-end, most likely in December, with a near-zero probability of any easing before September. Chair Jerome Powell, in what will be one of his final press conferences before his term expires in May, is expected to emphasize the uncertainty created by the Middle East conflict while reinforcing a data-dependent stance.

Iran escalation keeps Oil bid and equities on edge

Oil prices surged roughly 3% on Wednesday after Iran threatened retaliatory strikes against energy infrastructure in Saudi Arabia, Qatar and the UAE. West Texas Intermediate (WTI) crude pushed above $95 per barrel, adding to a rally that has seen prices climb roughly 50% since the start of the year. Israel reportedly struck Iran's largest gas processing facility, further escalating the conflict and tightening the effective closure of the Strait of Hormuz. The Trump administration issued a 60-day Jones Act waiver to allow Oil, natural gas, fertilizer and coal to move freely between US ports in an attempt to ease domestic supply pressures. Gold, meanwhile, pulled back below $5,000 per ounce as rate uncertainty weighed on the metal ahead of the Fed decision.

Energy and industrials outperform while consumer names lag

On the Dow, Caterpillar (CAT) led gainers with a roughly 1% advance after KeyBanc upgraded Dow (DOW) to overweight, citing benefits to US ethylene producers from higher Oil prices and tight global capacity. Goldman Sachs (GS) also added about 1% as elevated volatility continued to support trading revenue expectations. On the downside, Amgen (AMGN), Sherwin-Williams (SHW) and Procter & Gamble (PG) each fell around 2%, with consumer staples under pressure from margin concerns tied to rising input costs. Elsewhere, Nvidia (NVDA) edged higher after Reuters reported that China approved the sale of its H200 chips, while the chipmaker's ongoing GTC conference continued to generate headlines around a $1 trillion revenue opportunity through 2027.

Dow Jones daily chart

Dow Jones FAQs

The Dow Jones Industrial Average, one of the oldest stock market indices in the world, is compiled of the 30 most traded stocks in the US. The index is price-weighted rather than weighted by capitalization. It is calculated by summing the prices of the constituent stocks and dividing them by a factor, currently 0.152. The index was founded by Charles Dow, who also founded the Wall Street Journal. In later years it has been criticized for not being broadly representative enough because it only tracks 30 conglomerates, unlike broader indices such as the S&P 500.

Many different factors drive the Dow Jones Industrial Average (DJIA). The aggregate performance of the component companies revealed in quarterly company earnings reports is the main one. US and global macroeconomic data also contributes as it impacts on investor sentiment. The level of interest rates, set by the Federal Reserve (Fed), also influences the DJIA as it affects the cost of credit, on which many corporations are heavily reliant. Therefore, inflation can be a major driver as well as other metrics which impact the Fed decisions.

Dow Theory is a method for identifying the primary trend of the stock market developed by Charles Dow. A key step is to compare the direction of the Dow Jones Industrial Average (DJIA) and the Dow Jones Transportation Average (DJTA) and only follow trends where both are moving in the same direction. Volume is a confirmatory criteria. The theory uses elements of peak and trough analysis. Dow’s theory posits three trend phases: accumulation, when smart money starts buying or selling; public participation, when the wider public joins in; and distribution, when the smart money exits.

There are a number of ways to trade the DJIA. One is to use ETFs which allow investors to trade the DJIA as a single security, rather than having to buy shares in all 30 constituent companies. A leading example is the SPDR Dow Jones Industrial Average ETF (DIA). DJIA futures contracts enable traders to speculate on the future value of the index and Options provide the right, but not the obligation, to buy or sell the index at a predetermined price in the future. Mutual funds enable investors to buy a share of a diversified portfolio of DJIA stocks thus providing exposure to the overall index.

Disclaimer: For information purposes only. Past performance is not indicative of future results.
placeholder
Natural Gas sinks to pivotal level as China’s demand slumpsNatural Gas price (XNG/USD) edges lower and sinks to $2.56 on Monday, extending its losing streak for the fifth day in a row. The move comes on the back of China cutting its Liquified Natural Gas (LNG) imports after prices rose above $3.0 in June. It
Author  FXStreet
Jul 01, 2024
Natural Gas price (XNG/USD) edges lower and sinks to $2.56 on Monday, extending its losing streak for the fifth day in a row. The move comes on the back of China cutting its Liquified Natural Gas (LNG) imports after prices rose above $3.0 in June. It
placeholder
Bitcoin briefly loses 2025 gains as crypto plunges over the weekend.Bitcoin experienced a sharp decline this weekend, briefly erasing its 2025 gains and dipping below its year-opening value of $93,507. The cryptocurrency fell to a low of $93,029 on Sunday, representing a 25% drop from its all-time high in October. Although it has rebounded slightly to around $94,209, the pressures on the market remain significant. The downturn occurred despite the reopening of the U.S. government on Thursday, which many had hoped would provide essential support for crypto markets. This year initially appeared promising for cryptocurrencies, particularly after the inauguration of President Donald Trump, who has established the most pro-crypto administration thus far. However, ongoing political tensions—including Trump's tariff strategies and the recent government shutdown, lasting a historic 43 days—have contributed to several rapid price pullbacks for Bitcoin throughout the year. Market dynamics are also being influenced by Bitcoin whales—investors holding large amounts of Bitcoin—who have been offloading portions of their assets, consequently stalling price rallies even as positive regulatory developments emerge. Despite these sell-offs, analysts from Glassnode argue that this behavior aligns with typical patterns seen among long-term investors during the concluding stages of bull markets, suggesting it is not indicative of a mass exodus. Notably, Bitcoin is not alone in its struggles, as Ethereum and Solana have also recorded declines of 7.95% and 28.3%, respectively, since the start of the year, while numerous altcoins have faced even steeper losses. Looking ahead, questions linger regarding the viability of the four-year cycle thesis, particularly given the increasing institutional support and regulatory frameworks now in place in the crypto landscape. Matt Hougan, chief investment officer at Bitwise, remains optimistic, suggesting a potential Bitcoin resurgence in 2026 driven by the “debasement trade” thesis and a broader trend toward increased adoption of stablecoins, tokenization, and decentralized finance. Hougan emphasized the soundness of the underlying fundamentals, pointing to a positive outlook for the sector in the longer term.
Author  Mitrade
Nov 17, 2025
Bitcoin experienced a sharp decline this weekend, briefly erasing its 2025 gains and dipping below its year-opening value of $93,507. The cryptocurrency fell to a low of $93,029 on Sunday, representing a 25% drop from its all-time high in October. Although it has rebounded slightly to around $94,209, the pressures on the market remain significant. The downturn occurred despite the reopening of the U.S. government on Thursday, which many had hoped would provide essential support for crypto markets. This year initially appeared promising for cryptocurrencies, particularly after the inauguration of President Donald Trump, who has established the most pro-crypto administration thus far. However, ongoing political tensions—including Trump's tariff strategies and the recent government shutdown, lasting a historic 43 days—have contributed to several rapid price pullbacks for Bitcoin throughout the year. Market dynamics are also being influenced by Bitcoin whales—investors holding large amounts of Bitcoin—who have been offloading portions of their assets, consequently stalling price rallies even as positive regulatory developments emerge. Despite these sell-offs, analysts from Glassnode argue that this behavior aligns with typical patterns seen among long-term investors during the concluding stages of bull markets, suggesting it is not indicative of a mass exodus. Notably, Bitcoin is not alone in its struggles, as Ethereum and Solana have also recorded declines of 7.95% and 28.3%, respectively, since the start of the year, while numerous altcoins have faced even steeper losses. Looking ahead, questions linger regarding the viability of the four-year cycle thesis, particularly given the increasing institutional support and regulatory frameworks now in place in the crypto landscape. Matt Hougan, chief investment officer at Bitwise, remains optimistic, suggesting a potential Bitcoin resurgence in 2026 driven by the “debasement trade” thesis and a broader trend toward increased adoption of stablecoins, tokenization, and decentralized finance. Hougan emphasized the soundness of the underlying fundamentals, pointing to a positive outlook for the sector in the longer term.
placeholder
ECB Policy Outlook for 2026: What It Could Mean for the Euro’s Next MoveWith the ECB likely holding rates steady at 2.15% and the Fed potentially extending cuts into 2026, EUR/USD may test 1.20 if Eurozone growth proves resilient, but weaker growth and an ECB pivot could pull the pair back toward 1.13 and potentially 1.10.
Author  Mitrade
Dec 26, 2025
With the ECB likely holding rates steady at 2.15% and the Fed potentially extending cuts into 2026, EUR/USD may test 1.20 if Eurozone growth proves resilient, but weaker growth and an ECB pivot could pull the pair back toward 1.13 and potentially 1.10.
placeholder
My Top 5 Stock Market Predictions for 2026Five 2026 market predictions written in a native, news-style voice: AI’s winners and losers, broader sector leadership, dividend demand, valuation cooling as the Shiller CAPE sits at 39 (Dec. 31, 2025), and quantum-computing bursts—while keeping all original facts and numbers unchanged.
Author  Mitrade
Jan 06, Tue
Five 2026 market predictions written in a native, news-style voice: AI’s winners and losers, broader sector leadership, dividend demand, valuation cooling as the Shiller CAPE sits at 39 (Dec. 31, 2025), and quantum-computing bursts—while keeping all original facts and numbers unchanged.
placeholder
Gold Price Forecast: Oil Price Breaking $100 Fuels Inflation Concerns, Will Gold Prices Fall Further?As of the Asian session on July 24, gold prices ( XAUUSD) fell continuously during intraday trading, briefly approaching the $4,000 mark. Looking at the chart, gold prices rebounded this
Author  TradingKey
Jul 24, Fri
As of the Asian session on July 24, gold prices ( XAUUSD) fell continuously during intraday trading, briefly approaching the $4,000 mark. Looking at the chart, gold prices rebounded this
Related Instrument
goTop
quote