


Top Gainers HYPE ZEC VIRTUAL: Social chatter fuels altcoin rally, HYPE and ZEC target new peaks
- Hyperliquid leads the altcoin rally with a 13% surge to a new all-time high at $39.80.
- Zcash jumps 10% as social mentions of ZEC near 1,000 unique daily mentions.
- Virtuals Protocol is up over 6%, hinting at a range breakout rally to $2.50.
Top cryptos survive the weekends, avoiding any major drawdown or loss in momentum, to start a fresh week on a bullish note. Bitcoin (BTC) holds above $109k, with Hyperliquid (HYPE) and Zcash (ZEC) dominating the top performers chart with rising social sentiments. HYPE hits a new all-time high as it nears a $40 breakout, with ZEC crossing above $50. Virtuals Protocol (VIRTUAL) captures the broader market tailwinds, breaking a consolidation range with bulls targeting $2.50.
Hyperliquid moves into untested waters
Hyperliquid trades at $39.80 with a 1.70% leap on Monday, printing a new all-time high at press time. The 12% jump on Sunday forms a bullish engulfing candle, breaking the 1.272 Fibonacci level, retraced over the 70% crash from $32.12 on December 21 to $10.26 on April 5.
As the HYPE rally enters a price-discovery mode, the momentum indicators overheat. The Relative Strength Index (RSI) at 86 scales higher in the overbought zone, posing risks of trend reversal. The Moving Average Convergence/Divergence (MACD) at 4.32 with its signal line at 3.17 shows a positive trend at play, supporting upside chances.
According to Lunarcrush, the social momentum metrics showcase rising retail interest as engagements reach 25.61 million and social mentions hit 21.01K.
As per the Fibonacci levels, the 1.272 retracement level breakout puts the $45 level on the bullish radar as it aligns with the 1.618 Fibonacci level.
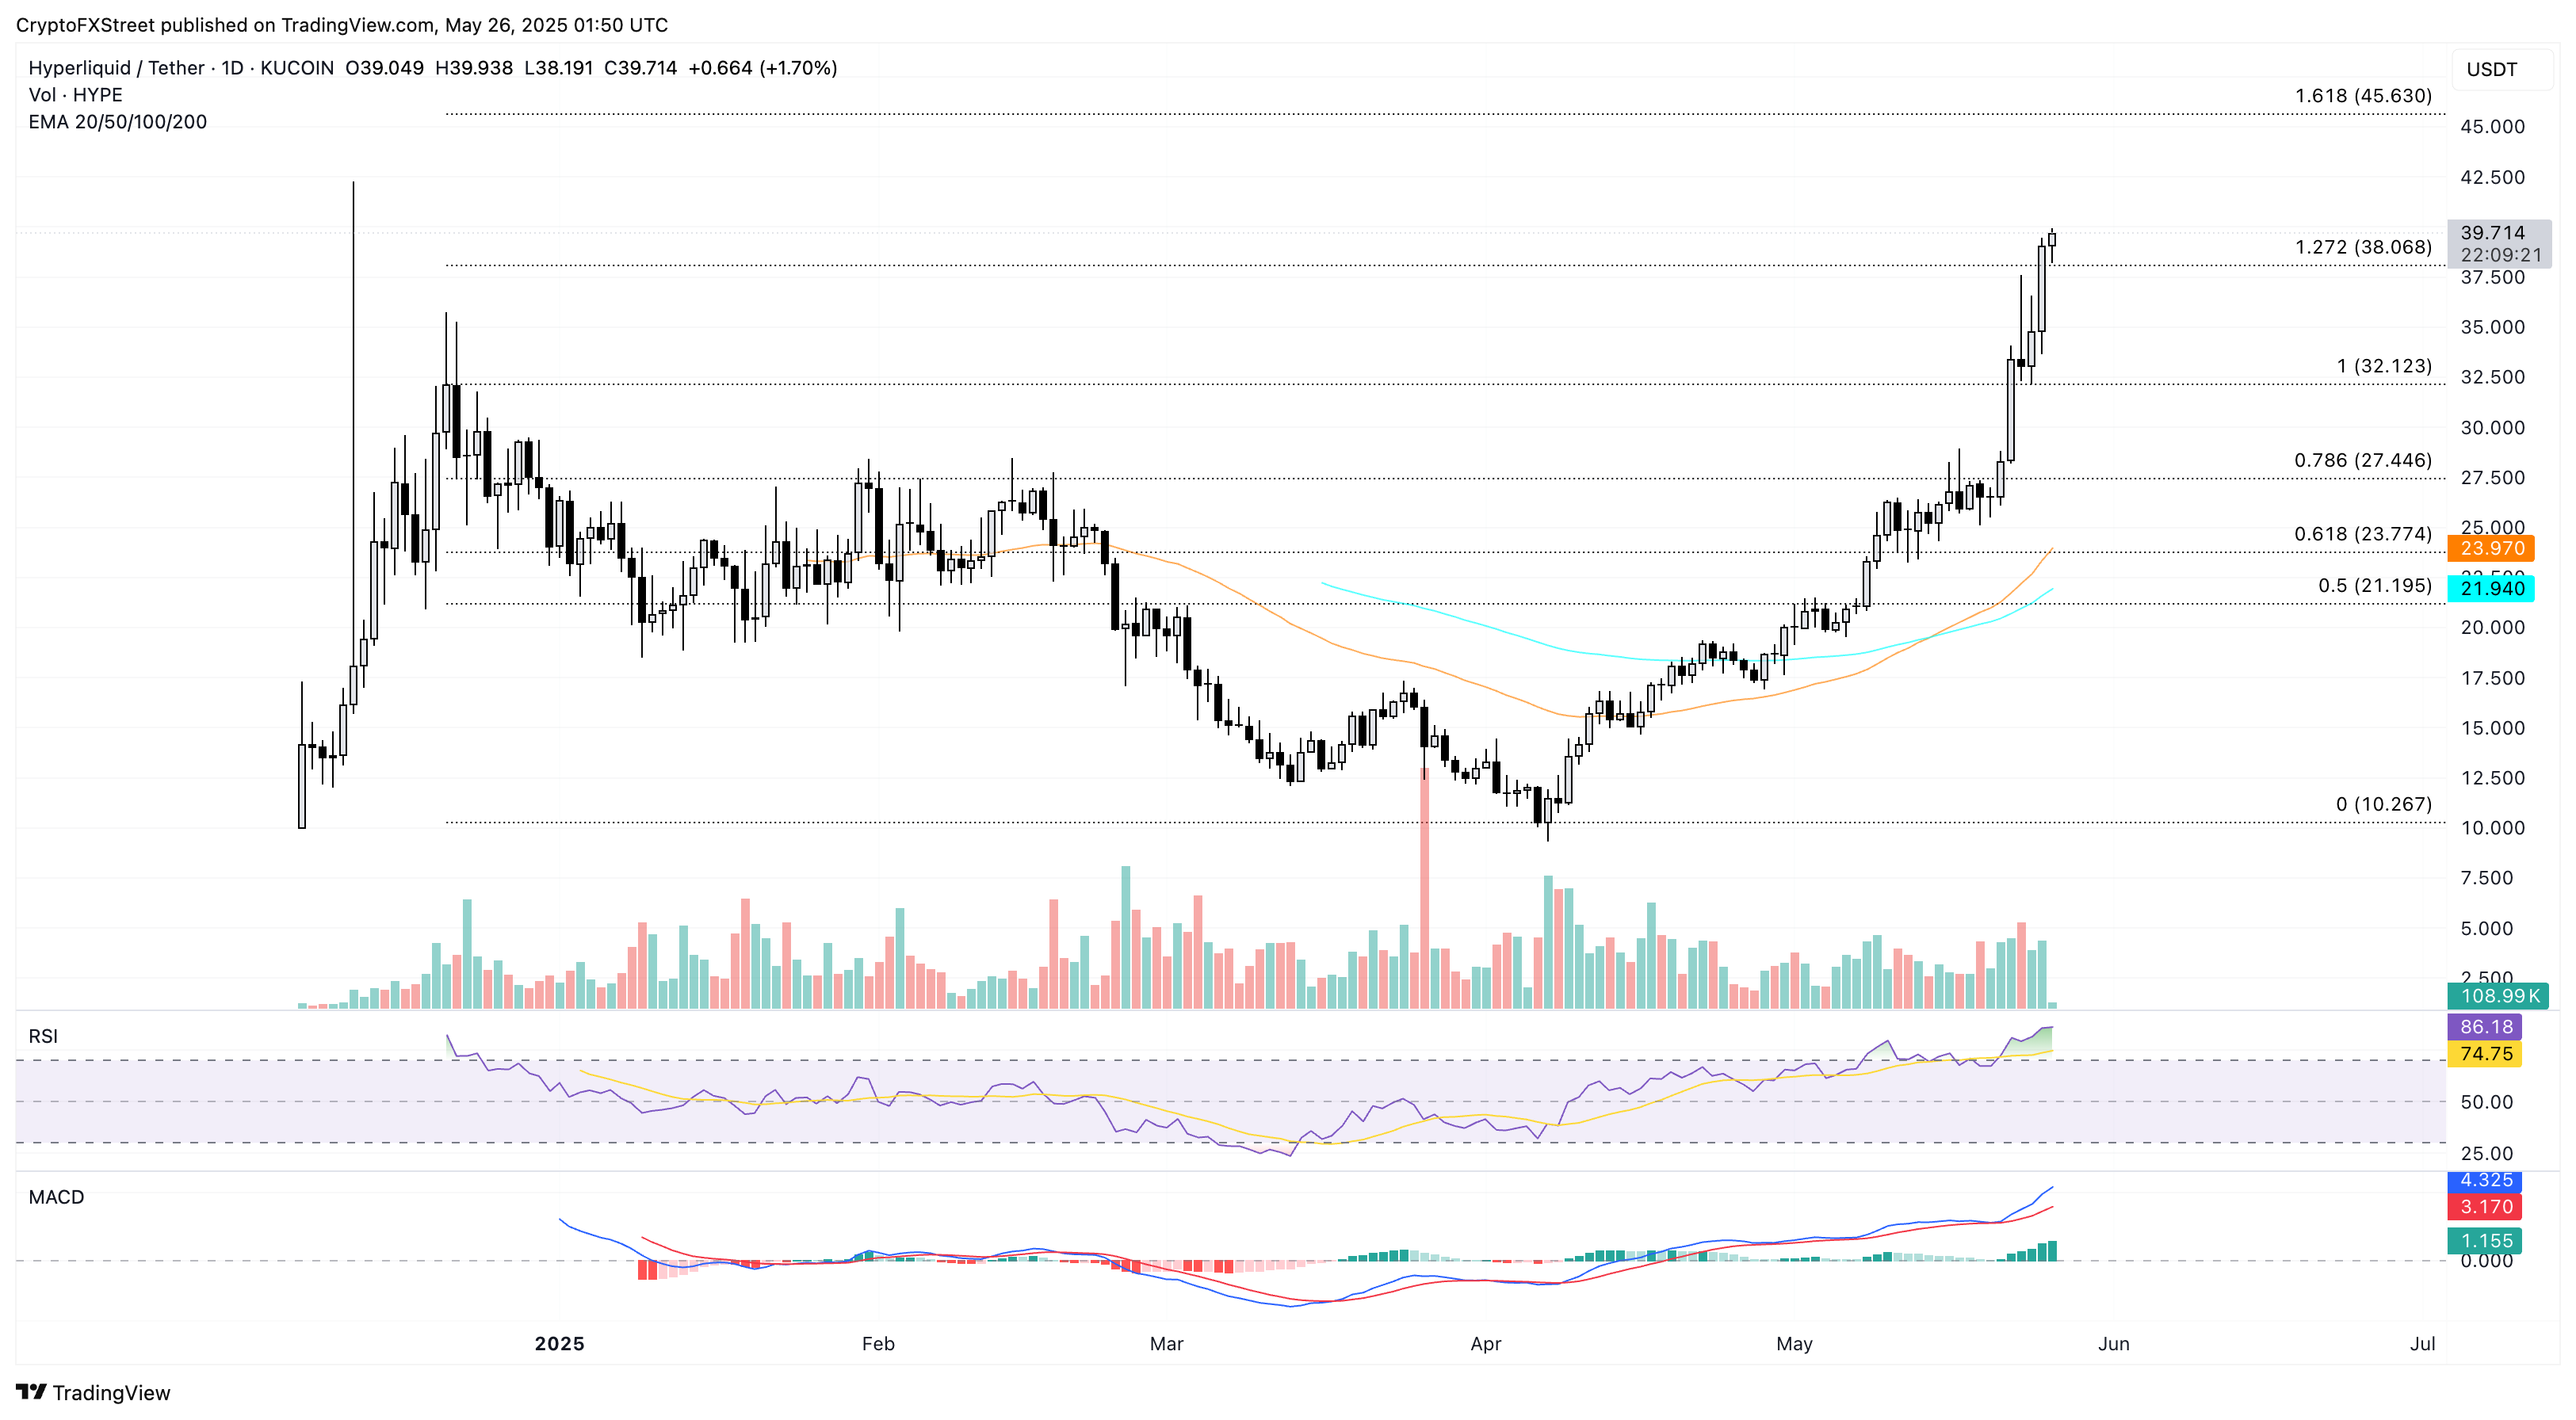
HYPE/USDT daily price chart. Source: Tradingview
On the flip side, a daily closing under $38 could extend a decline to the 100% level at $32.12.
Zcash hits a crucial crossroads
Zcash jumps by 10% on Sunday, fueling the bullish start to this week. At the time of writing, ZEC trades at $54.55 as it drops back to the opening price after a 24-hour formation at $56.79.
The altcoin is up 51% this week, pumping the 50-day Exponential Moving Average (EMA) above the 200-day EMA, triggering a golden crossover. This marks the short-term trend overcoming the longer-term price action, signaling a bullish trend reversal.
The daily RSI at 76 crosses above the overbought boundary, signaling a rising flow of bullish momentum. However, the overbought risks surge as RSI trades higher. After a minor volatility phase, the MACD and its signal line regain positive alignment with a bullish crossover on May 22. With a new wave of rising histograms, the momentum indicator supports the uptrend thesis.
The privacy coin leads the trend as social activity grows. As per Lunarcrush, the social mentions of ZEC hit 15.1K, a 3-month high. In addition, the unique mentions of Zcash are close to surpassing 1,000.
The Fibonacci levels retraced over the 60% decline from $75.49 to $29.19 between December 2 and March 11, marking the 50% level at $51.89. As the 10% surge on Sunday forms a bullish engulfing candle surpassing the halfway level, the uptrend faces opposition at $57.25, aligning with the 61.80% Fibonacci level. A potential breakout rally could target $64.87, targeted by the 78.6% level.
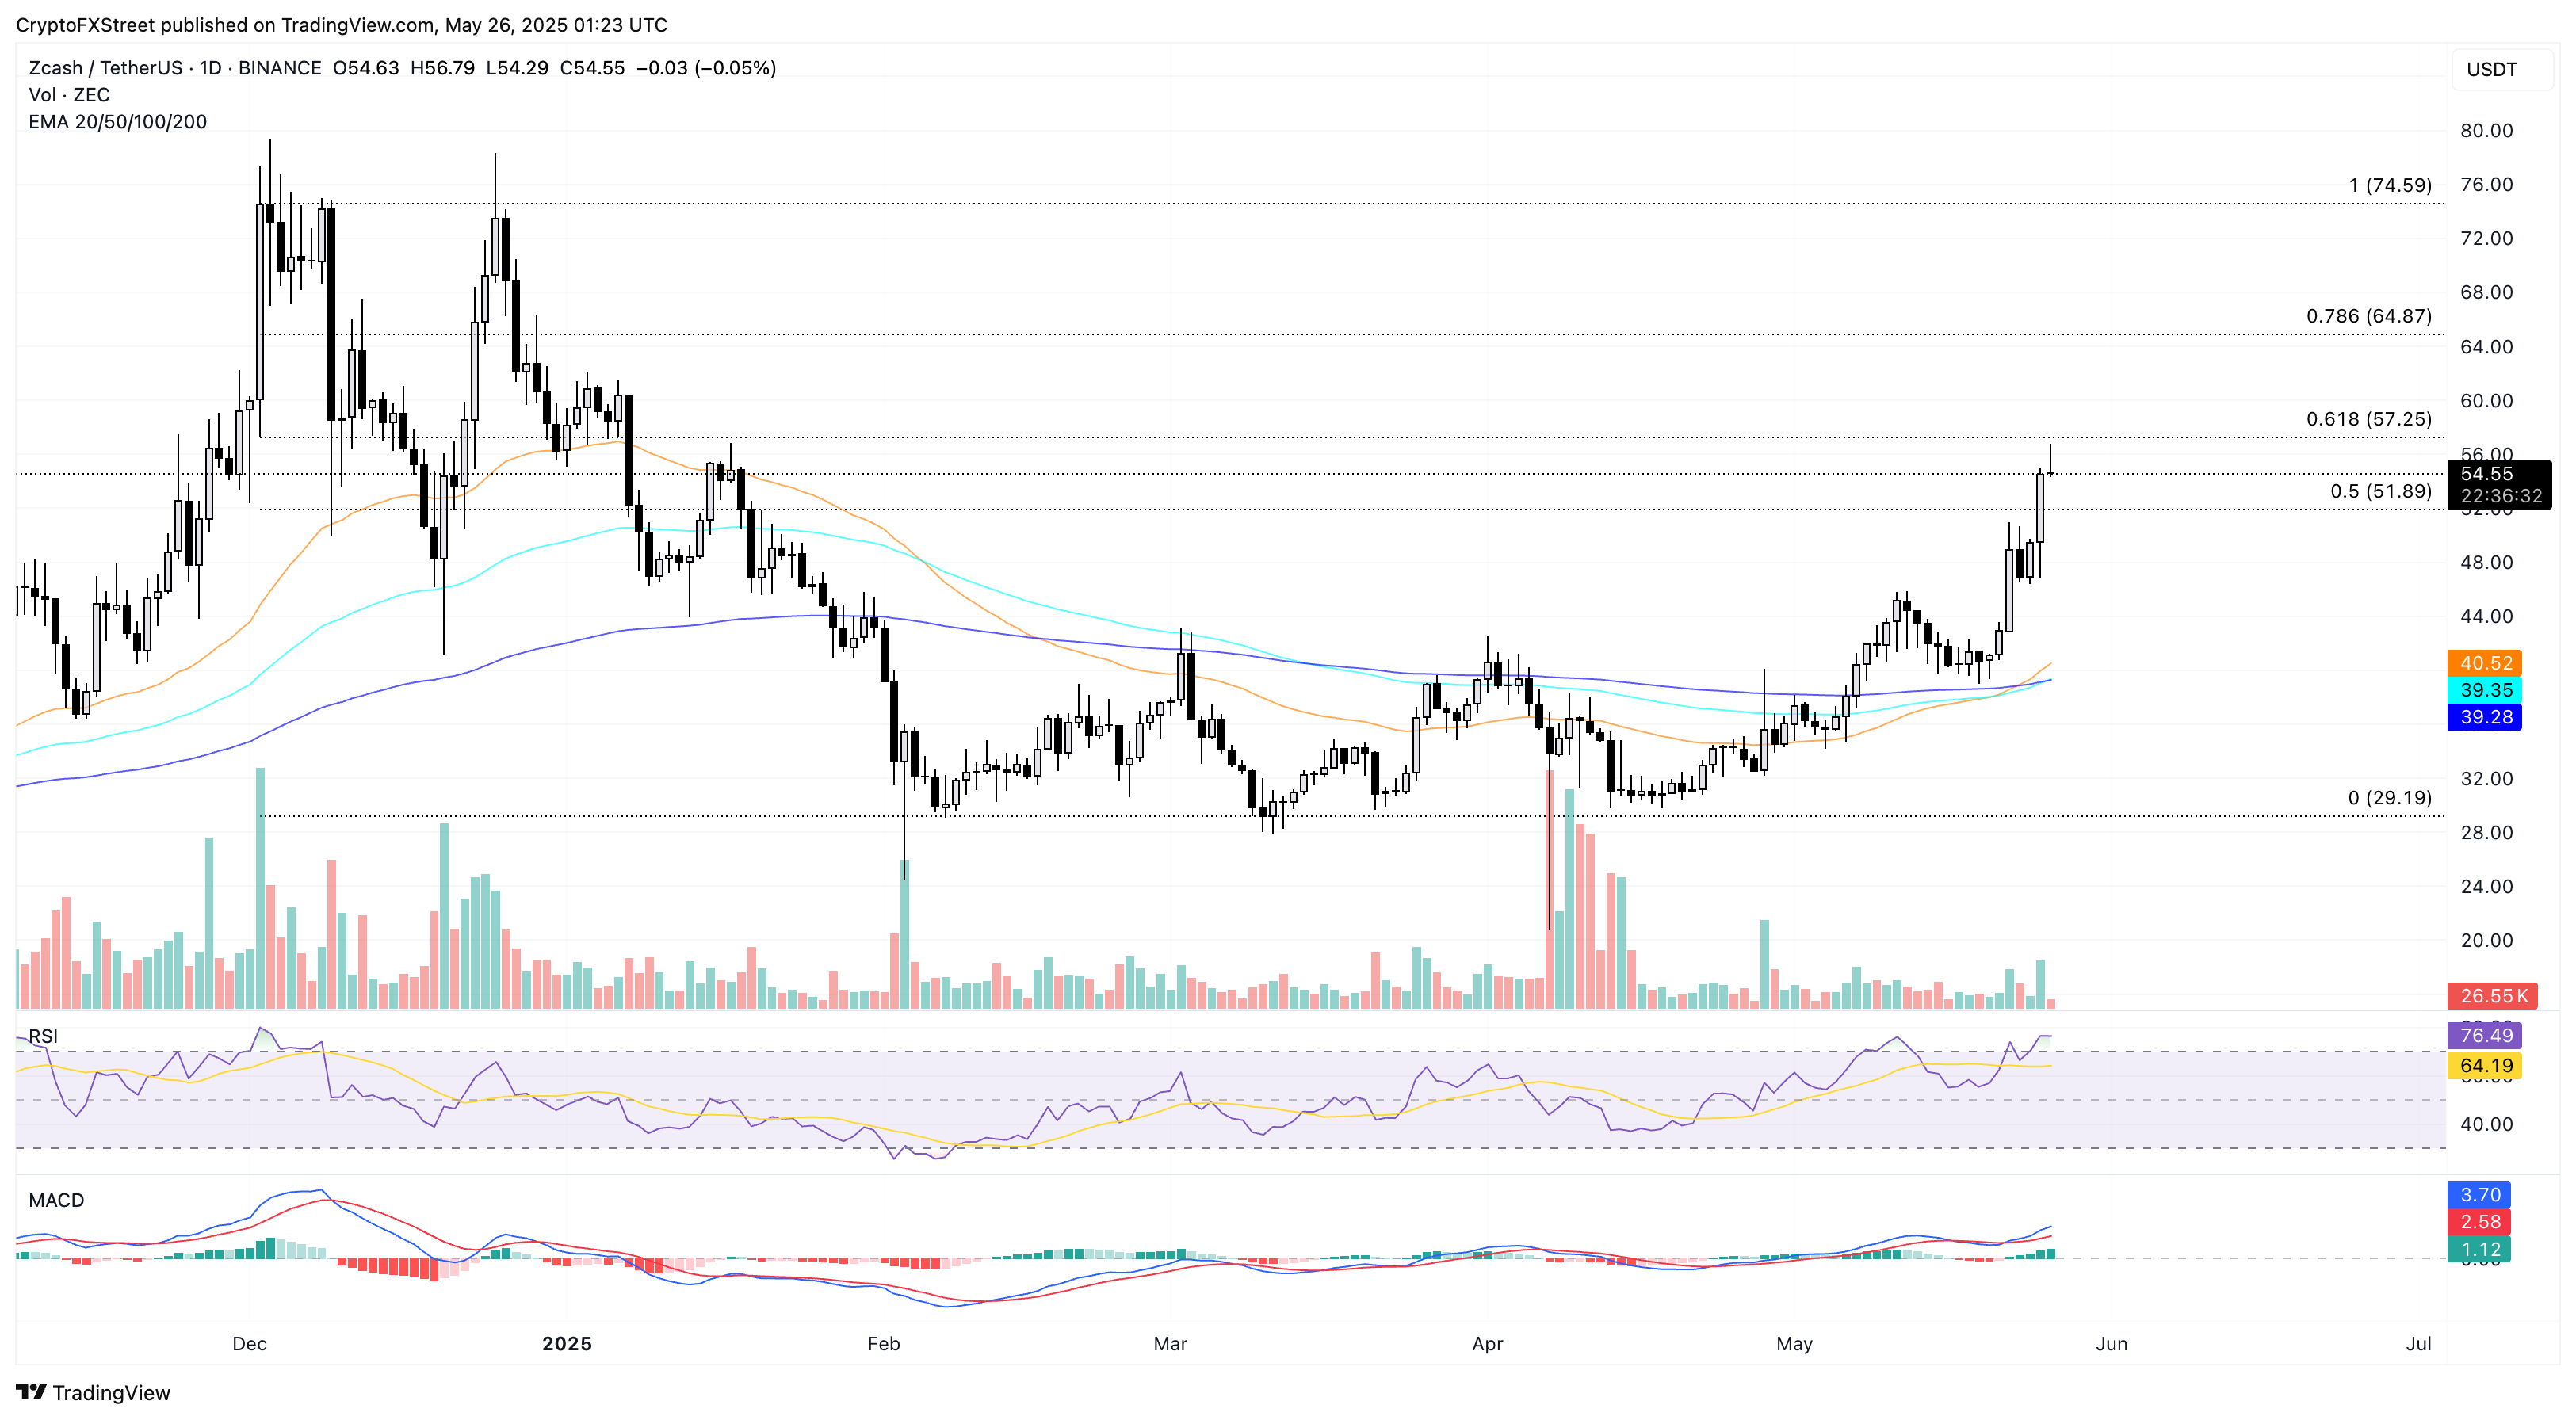
ZEC/USDT daily price chart. Source: Tradingview
On the other hand, a steeper correction under the 50% level could retest the $46 horizontal level, a high activity resistance turned support area.
VIRTUAL holds its trend momentum, targets $2.50 with range breakout
VIRTUAL is up over 6% on Monday, trading at $2.15 at press time. With a positive start this week, the Solana-based AI agent is close to outgrowing a consolidation period over the last 17 days.
A daily closing price above $2.08 will mark the range breakout and prolong the 40% rally this month. The ongoing reversal in VIRTUAL accounts for a 271% rise with a 165% return in April, projecting a strong bullish reversal in motion.
The MACD and signal lines are close to a bullish crossover, signaling a trend reversal. Furthermore, the RSI is at 65 points upside, reflecting rising momentum with room for growth until it enters the overbought territory.
Based on the Fibonacci levels retraced over the 90% pullback from $4.62 to $0.41 between January 1 and April 9, the 50% level is near $2.50. Hence, a potential range breakout in the AI agent token could scale nearly 17% higher from the current market price to reach the psychological level.
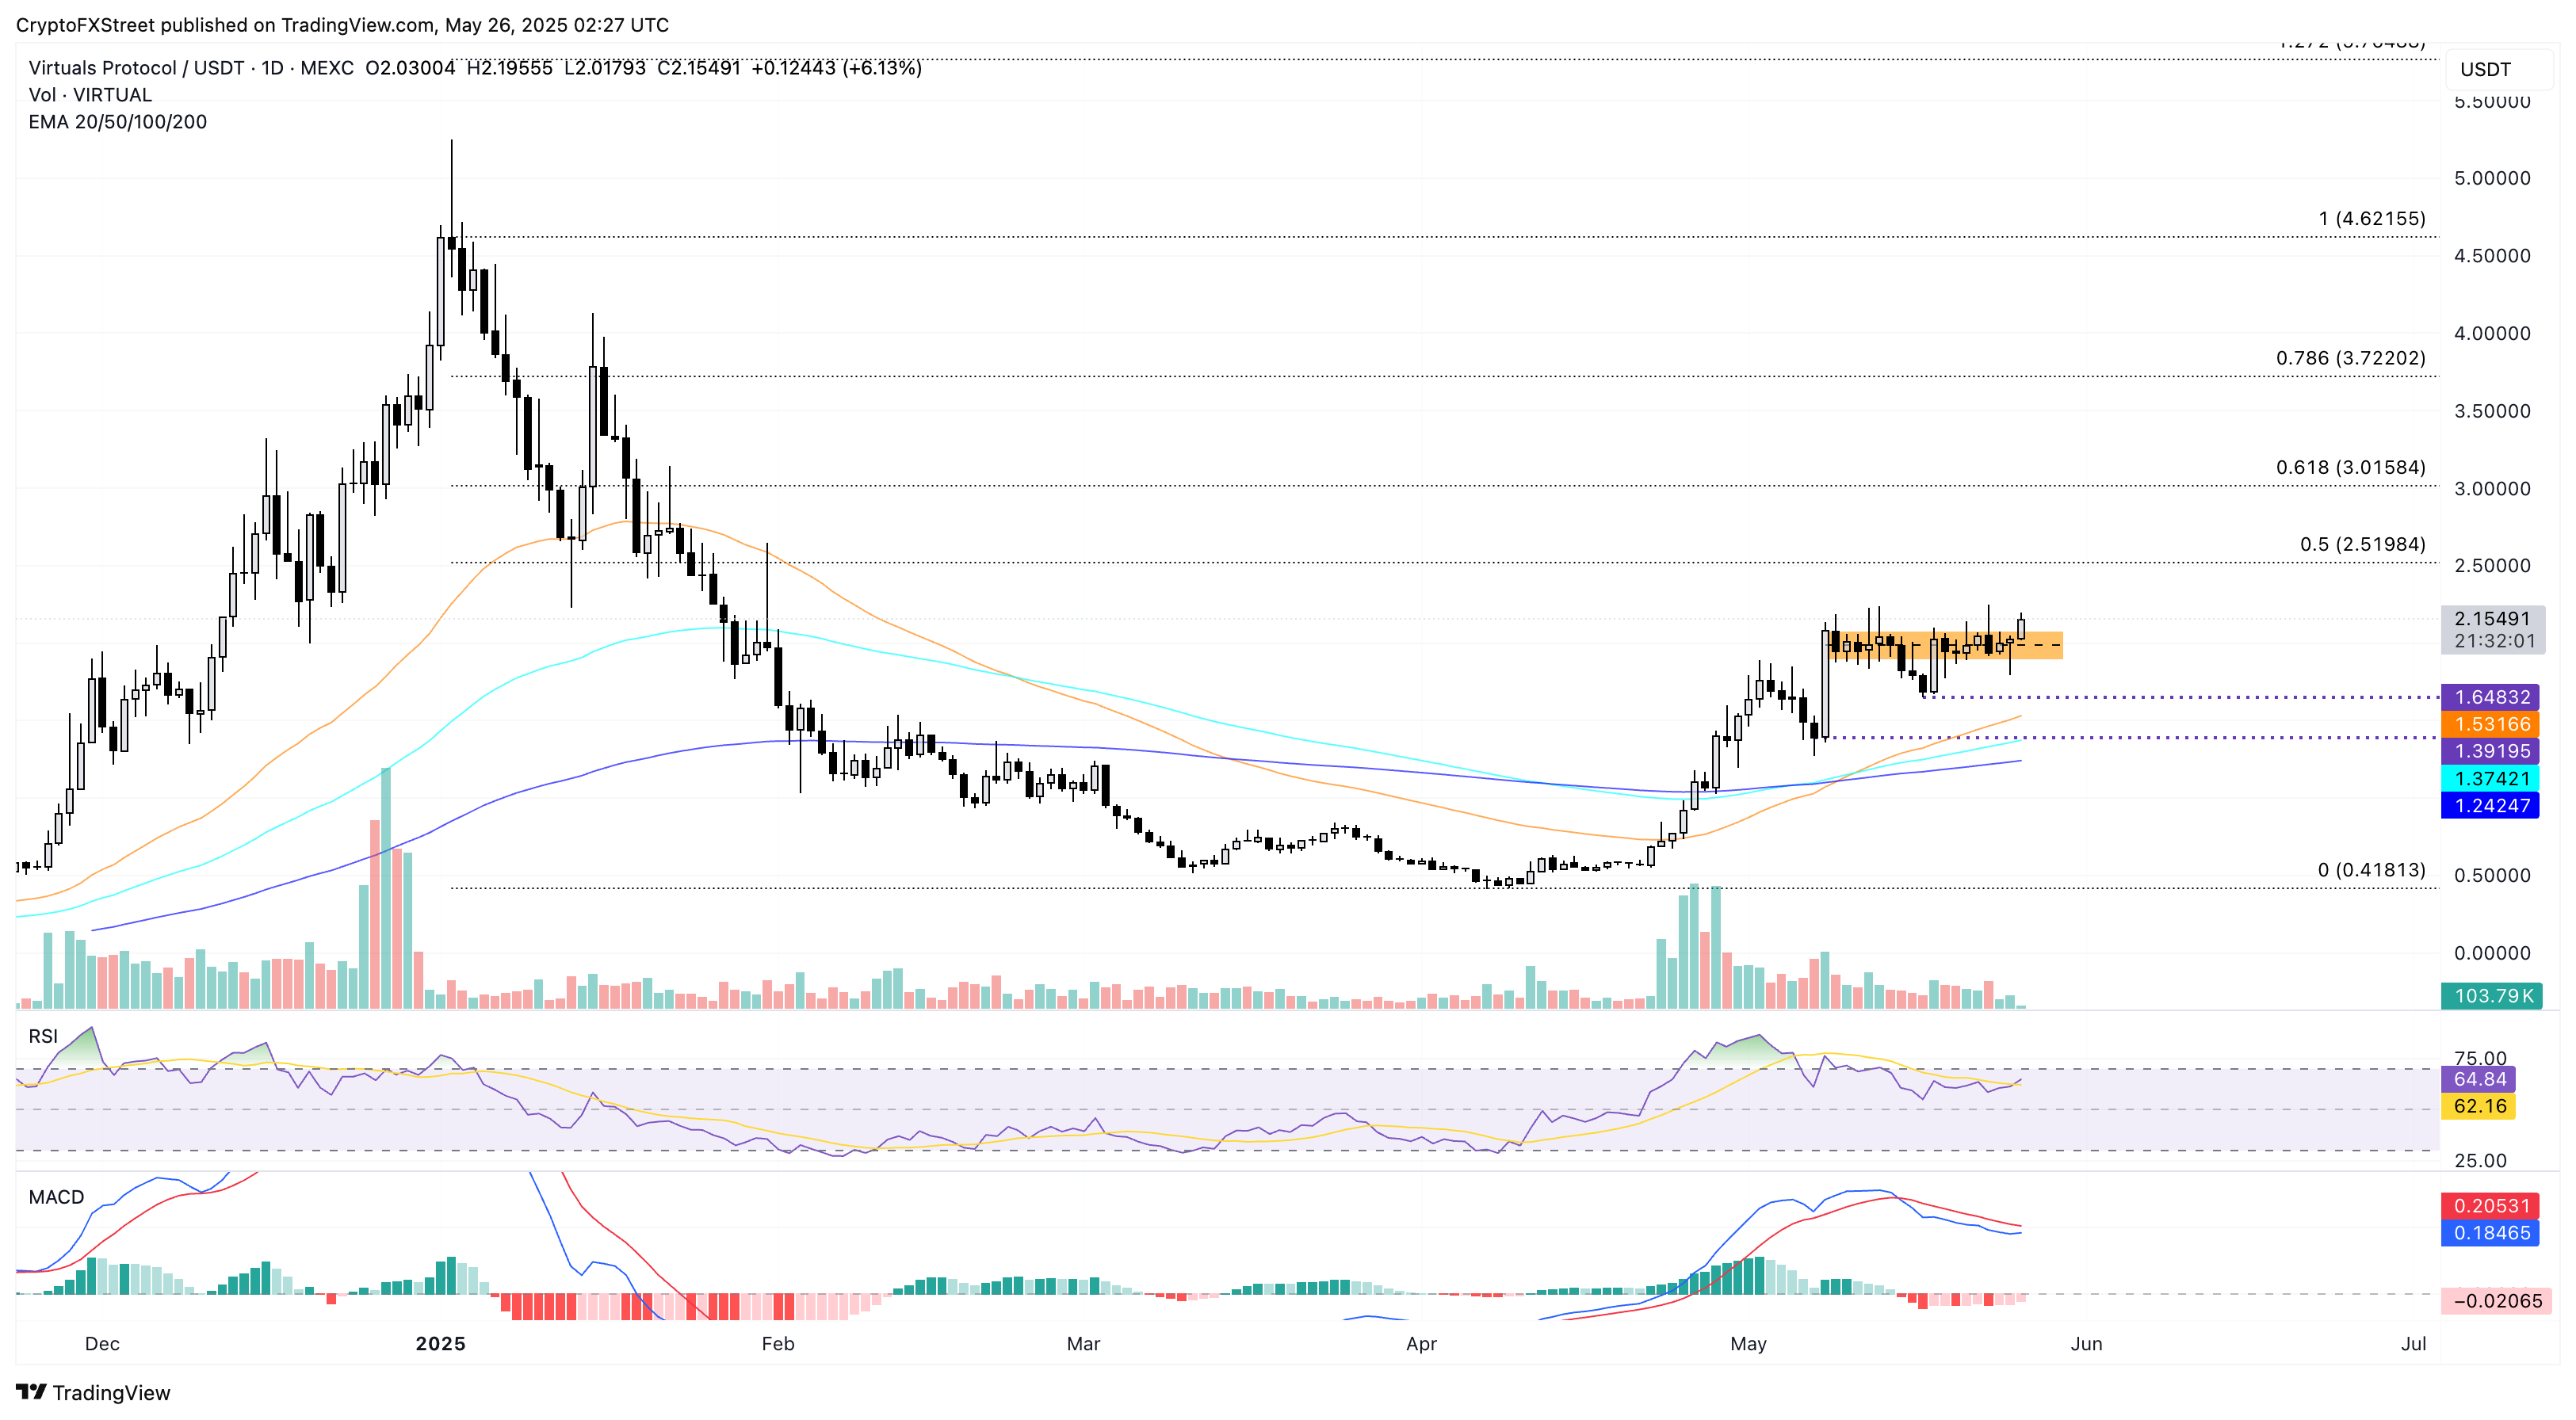
VIRTUALS/USDT daily price chart. Source: Tradingview
Conversely, a price below $2 will undermine the breakout chances and prolong the consolidation in the best-case scenario. A steeper correction could test the previous lows at $1.64 or $1.39.
Recommended Articles


