

Bitcoin Ready To Reclaim $90,000? BTC’s ‘Next Big Move’ Could Come Next Week

Source Newsbtc

Amid the market volatility, Bitcoin (BTC) has been unable to reclaim the $85,000-$86,000 zone despite its weekly performance. However, some analysts suggest that a breakout from the key resistance level might be around the corner.

Bitcoin To Resume Its Bullish Rally?

Over the past week, Bitcoin has traded between the $83,000-$86,000 price range, recovering from the sub-$80,000 correction at the start of the month. Notably, the flagship crypto experienced significant volatility last week due to the ongoing trade tariff war between the US and dozens of countries.

BTC’s recent recovery began after the US President Donald Trump paused the tariff on over 75 countries for 90 days, which sent BTC’s price back above the $80,000 mark. Amid the volatility, Bitcoin retested the key $78,500 as support and its four-month downtrend resistance, compressing between these two levels.

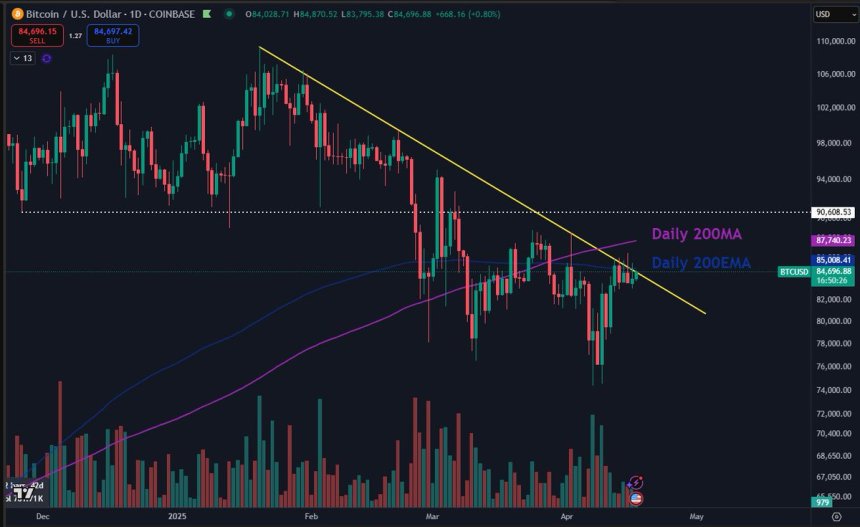
According to market watcher Daan Crypto Trades, Bitcoin has been moving within a significant area, as it was retesting its downtrend line as well as the Daily 200 Exponential Moving Average (EMA) and Moving Average (MA), which “has been a tough price region to crack in recent weeks.”
Bitcoin

Amid Thursday’s pump, BTC is finally breaking out of its downtrend, which could lead to a surge toward the “ultimate level to break for the bulls,” the $90,000-$91,000 barrier, as he suggested that the sideways move in the mid-$80,000 region won’t continue for much longer.

Nonetheless, the trader considers that the coming days might not have significant swings due to the Easter weekend, with low volumes and liquidity expected. “Likely going to be quite boring absent any major new headlines,” he asserted, adding that “we’ll see where this wants to go next week.”

BTC’s Key Levels To Reclaim

Analyst Sjuul from AltCryptoGems pointed out that Bitcoin is trapped below the 50-day EMA, which is “what separated us from a bull run resumption.”

He explained that the cryptocurrency has been moving between $78,000-$95,000 since March, with the 50 EMA coinciding with the price range’s mid-zone and seemingly acting as resistance for the past week.

Breaking out of the mid-range, between $85,000-$86,000 levels, could send BTC’s price above the $90,000 mark and toward the range’s high.

According to the post, Bitcoin’s current price action resembles May 2021’s performance, before the bull run resumed. At the time, BTC reclaimed the 50 EMA on the daily chart, which “right now, just as back then, (…) has been the line in the sand between the bull and bear markets.”

The analyst explained that strong spot buying pressure is necessary to break this resistance and resume BTC’s rally. “Should we finally have this spot buying pressure, and should we finally see the EMA 50 Daily being flipped, all you want next is for that liquidity wall at $87K to be properly broken,” he concluded.

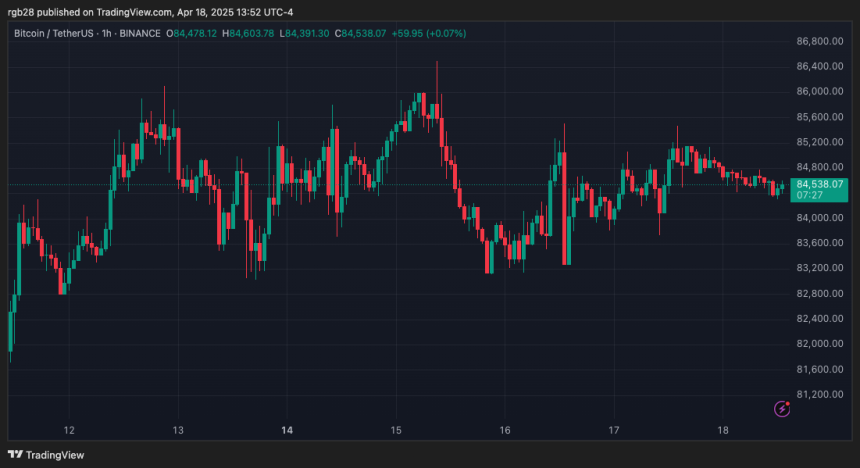
As of this writing, Bitcoin trades at $84,521, a 1.2% increase in the weekly timeframe.
Bitcoin, BTC, BTCUSDT
Disclaimer: For information purposes only. Past performance is not indicative of future results.
placeholder
Anthropic is six times oversubscribed at $1.4 trillion while Nvidia is down 32% — the AI trade has two pricesAnthropic lists on Nasdaq as ANT on Thursday at $70 ~ $78 a share, raising up to $64.4 billion at a target valuation near $1.4 trillion, and the book is reportedly six times covered. In the same six weeks, Nvidia has fallen 32% and the QQQ is 10.9% below its October peak. Private capital and public markets are marking the same AI complex at two very different prices. This piece separates the two books: what the S-1 shows, who is anchoring the $26 billion private placement, and what Thursday's debut would have to do to change the public tape.
Author  Irene Q.
Nov 16, Mon
Anthropic lists on Nasdaq as ANT on Thursday at $70 ~ $78 a share, raising up to $64.4 billion at a target valuation near $1.4 trillion, and the book is reportedly six times covered. In the same six weeks, Nvidia has fallen 32% and the QQQ is 10.9% below its October peak. Private capital and public markets are marking the same AI complex at two very different prices. This piece separates the two books: what the S-1 shows, who is anchoring the $26 billion private placement, and what Thursday's debut would have to do to change the public tape.
placeholder
Gold Price Analysis Today | Forex Gold Analysis | XAU/USD Analysis - November 16, 2026Get the latest gold price analysis, forex gold insights, and XAU/USD analysis for November 16, 2026. Read on for the details.
Author  Mitrade
Nov 16, Mon
Get the latest gold price analysis, forex gold insights, and XAU/USD analysis for November 16, 2026. Read on for the details.
placeholder
Weekly Report: DXY 103.41, 10-year 5.15%, AUD carry 3bp — three FX regimes flipped in one weekThe dollar index rose 1.09% to 103.41, a 19-month high, while the US 10-year closed at 5.154% and the Australia-US two-year spread collapsed to about 3 basis points from 36. EURUSD fell 1.59% to 1.1024, USDJPY rose 1.51% to 159.78 and AUDUSD fell 1.79% to 0.6764, a 10-month low. Three FX regimes — the broad dollar, the US rate level and the Australian carry premium — flipped in the same week. This report marks the thresholds, ranks which one can flip back first, and lists the week's calendar.
Author  Irene Q.
Nov 16, Mon
The dollar index rose 1.09% to 103.41, a 19-month high, while the US 10-year closed at 5.154% and the Australia-US two-year spread collapsed to about 3 basis points from 36. EURUSD fell 1.59% to 1.1024, USDJPY rose 1.51% to 159.78 and AUDUSD fell 1.79% to 0.6764, a 10-month low. Three FX regimes — the broad dollar, the US rate level and the Australian carry premium — flipped in the same week. This report marks the thresholds, ranks which one can flip back first, and lists the week's calendar.
placeholder
Gold Price Analysis Today | Forex Gold Analysis | XAU/USD Analysis - November 17, 2026Get the latest gold price analysis, forex gold insights, and XAU/USD analysis for November 17, 2026. Read on for the details.
Author  Mitrade
Yesterday 05: 40
Get the latest gold price analysis, forex gold insights, and XAU/USD analysis for November 17, 2026. Read on for the details.
placeholder
Gold Price Analysis Today | Forex Gold Analysis | XAU/USD Analysis - November 18, 2026Get the latest gold price analysis, forex gold insights, and XAU/USD analysis for November 18, 2026. Read on for the details.
Author  Mitrade
3 hours ago
Get the latest gold price analysis, forex gold insights, and XAU/USD analysis for November 18, 2026. Read on for the details.
goTop
quote