

Dogecoin Breaking These Levels Could Be The Catalyst For Next Bull Run, Analyst Says

Source Newsbtc

An analyst has pointed out two major Dogecoin resistance levels that could potentially pave the path to the next bull run for the memecoin’s price.

These Dogecoin Levels Stand Out In Terms Of On-Chain Resistance

In a new post on X, analyst Ali Martinez has discussed about the resistance walls present ahead for DOGE based on the UTXO Realized Price Distribution (URPD). The URPD is an on-chain metric created by the analytics firm Glassnode that tells us, in short, about the amount of supply that was bought at various levels that Dogecoin has visited in its history.

Coins are said to be ‘bought’ when they become involved in a transaction on the blockchain. As such, the URPD records the price at the time of any coin’s last transaction as its cost basis.

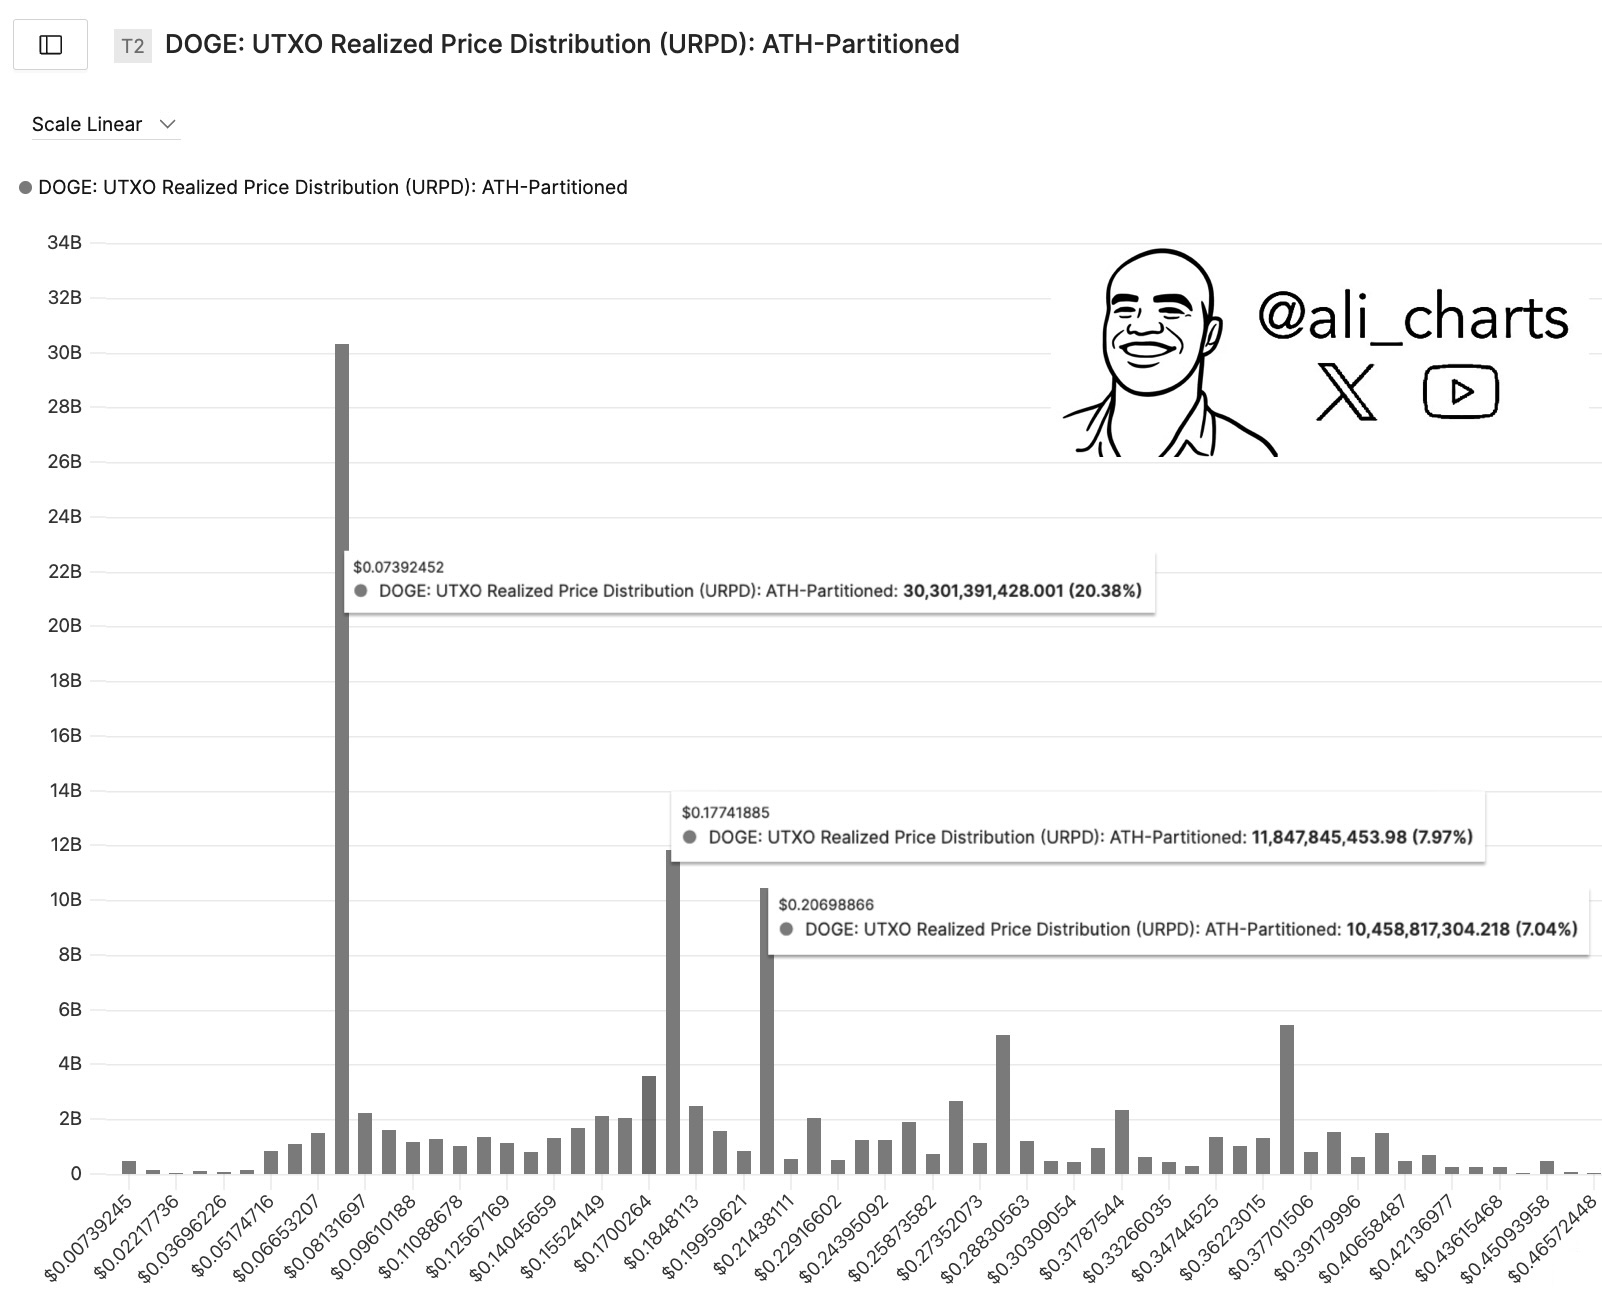
Now, here is the chart shared by the analyst that shows how the Dogecoin URPD is looking right now:
Dogecoin URPD

As is visible in the above graph, the largest supply wall that Dogecoin has is present around the $0.07 level, where over 20% of all coins in circulation were last transacted. Given that the DOGE price is currently trading far above this level, all of this supply would be sitting on a notable profit.

Generally, when the cryptocurrency’s price retests the cost basis of investors who were in profit just before, the holders may react by accumulating more if the mood in the market is bullish. This is because of the fact that they may be inclined to think the same level would end up being profitable again in the future, so the retest would look like a ‘dip‘ opportunity.

Similarly, when the retest occurs from the opposite direction, investors can react by selling instead, as they may fear that the asset would fall back again, so this could be their opportunity to at least exit with their entire investment back.

From the chart, it’s visible that in terms of the loss levels of Dogecoin, two currently stick out for their size: $0.18 and $0.21. The former hosts the acquisition level of around 8% of the supply, while the latter that of 7%.

Considering the significant amount of supply present at them, the levels could act as major resistance barriers due to the selling effect explained earlier. If DOGE can cross these levels, however, there are no other supply walls as large in sight. “Breaking through both could be the catalyst for the next major bull rally,” notes Martinez.

DOGE Price

Dogecoin made an attempt at recovery last week, but the memecoin’s price has since returned to its baseline as it’s now trading around $0.17.

Dogecoin Price Chart
Disclaimer: For information purposes only. Past performance is not indicative of future results.
placeholder
Nvidia slid 7.7% after hours while AMD and Broadcom rose — the AI trade changed hands, it didn't breakNvidia closed Wednesday at 173.73, up 2.87%, then fell as much as 8.1% to 159.44 after reports that its board was preparing for a possible leadership change. The same session, the Philadelphia Semiconductor Index rose 5.7% with all 30 components higher, CoreWeave jumped 24.7% on 168% revenue growth, and Micron added 11.9%. If AI demand were being repriced, AMD and Broadcom would not be bid. This is a governance discount on one name, and 204.54 — the 200-day average — is the level that settles it.
Author  Irene Q.
Nov 12, Thu
Nvidia closed Wednesday at 173.73, up 2.87%, then fell as much as 8.1% to 159.44 after reports that its board was preparing for a possible leadership change. The same session, the Philadelphia Semiconductor Index rose 5.7% with all 30 components higher, CoreWeave jumped 24.7% on 168% revenue growth, and Micron added 11.9%. If AI demand were being repriced, AMD and Broadcom would not be bid. This is a governance discount on one name, and 204.54 — the 200-day average — is the level that settles it.
placeholder
Gold closed below $4,000 again — the ETF crowd and central banks stayed, the momentum money leftSpot gold is trading near $3,999, its third consecutive lower daily low, after a 5.00% 10-year yield and a 102.85 dollar index raised the odds of a December hike to 87%. But the selling is not coming from the strategic holders: managed-money net longs fell to 324 tonnes, a 21-week low, and Goldman Sachs attributes roughly 95% of five weeks of selling to non-reportable positions. ETFs still hold a record 4,256 tonnes and central banks bought 321 tonnes in Q3. The table below sets the triggers, directions and levels.
Author  Irene Q.
Nov 12, Thu
Spot gold is trading near $3,999, its third consecutive lower daily low, after a 5.00% 10-year yield and a 102.85 dollar index raised the odds of a December hike to 87%. But the selling is not coming from the strategic holders: managed-money net longs fell to 324 tonnes, a 21-week low, and Goldman Sachs attributes roughly 95% of five weeks of selling to non-reportable positions. ETFs still hold a record 4,256 tonnes and central banks bought 321 tonnes in Q3. The table below sets the triggers, directions and levels.
placeholder
Gold hit a one-year low while central banks bought 321 tonnes — the sellers were never the ones you thinkSpot gold closed at 3,876 on Thursday, down 2.8% and its lowest close in more than a year, with an intraday low near 3,852. The dollar is at a 19-month high of 103.21 and the 10-year yield is at 5.10%, so the price move is easy to explain. What is harder to explain is who sold: central banks bought 321 tonnes in Q3, the PBoC added for a 24th straight month, ETF holdings are near a record 4,256 tonnes, and roughly 95% of the futures selling came from non-reportable and sovereign-type accounts rather than hedge funds. This piece separates the two books that have to balance.
Author  Irene Q.
Nov 13, Fri
Spot gold closed at 3,876 on Thursday, down 2.8% and its lowest close in more than a year, with an intraday low near 3,852. The dollar is at a 19-month high of 103.21 and the 10-year yield is at 5.10%, so the price move is easy to explain. What is harder to explain is who sold: central banks bought 321 tonnes in Q3, the PBoC added for a 24th straight month, ETF holdings are near a record 4,256 tonnes, and roughly 95% of the futures selling came from non-reportable and sovereign-type accounts rather than hedge funds. This piece separates the two books that have to balance.
placeholder
Brent rose 3.3% and US crude stocks built 4.66 million barrels in the same weekBrent January settled at 95.82, up 3.3%, and WTI at 88.74, up 2.55%, after the US signalled it would not pursue a deal with Iran and attacks on Gulf shipping continued. In the same week, EIA data showed US crude inventories rising 4.657 million barrels against expectations of a 1.1 million draw, with gasoline up another 1.799 million. OPEC output also rebounded 1.96 million barrels a day to 27.16 million in October, led by Saudi Arabia at 10.56 million. This piece separates the geopolitical premium from the physical balance and lays out where each side of the trade is anchored.
Author  Irene Q.
Nov 13, Fri
Brent January settled at 95.82, up 3.3%, and WTI at 88.74, up 2.55%, after the US signalled it would not pursue a deal with Iran and attacks on Gulf shipping continued. In the same week, EIA data showed US crude inventories rising 4.657 million barrels against expectations of a 1.1 million draw, with gasoline up another 1.799 million. OPEC output also rebounded 1.96 million barrels a day to 27.16 million in October, led by Saudi Arabia at 10.56 million. This piece separates the geopolitical premium from the physical balance and lays out where each side of the trade is anchored.
placeholder
Gold Price Analysis Today | Forex Gold Analysis | XAU/USD Analysis - November 16, 2026Get the latest gold price analysis, forex gold insights, and XAU/USD analysis for November 16, 2026. Read on for the details.
Author  Mitrade
1 hour ago
Get the latest gold price analysis, forex gold insights, and XAU/USD analysis for November 16, 2026. Read on for the details.
goTop
quote