

Ethereum charges above Bitcoin in daily performance following prediction of altcoin season repeat
- Ethereum is poised to replicate its performance where its price doubled Bitcoin's within a few months, says Steno Research analyst.
- The report noted that the Fed's rate cut will boost on-chain activity and fuel ETH's rise.
- Ethereum bulls could continue buying pressure to sustain rally if ETH bounces off a key support level.
Ethereum (ETH) is up 3% on Friday following a recent report by Steno Research that the Federal Reserve (Fed) rate cut earlier in the week would spark an ETH rally similar to its performance during the last altcoin season.
Daily digest market movers: Ethereum is ready to shine again
Following the Fed's 50 basis points rate cut, Steno Research predicted that Ethereum will replicate its performance in 2021, where its value increased more than 2x against Bitcoin.
Ethereum has largely underperformed in the current bull cycle, rising only about 8% against Bitcoin's 43% since the beginning of the year. For example, the ETH/BTC pair, which compares Ethereum's price against Bitcoin, reached a low last seen in April 2021 earlier in the week.
However, analyst Mads Eberhardt wrote that Ethereum's fortune is about to change, stating that the Fed's rate cut will cause a rise in on-chain activity, boosting ETH's value in the process.
The report noted how the rapid growth in decentralized finance (DeFi), stablecoin issuance, andt he non-fungible tokens (NFTs) frenzy sparked an altcoin season that saw ETH outperforming Bitcoin during the last bull run. "Much like in 2021, when Ethereum more than doubled in value against Bitcoin in just a few months, it is now poised to shine again," wrote Eberhardt.
While it's early to draw conclusions, ETH's price change against Bitcoin in the past few hours aligns with the prediction. BTC has declined by 0.7% against ETH's more than 3% rise.
However, investors also need to be cautious, as the rising Ethereum exchange reserve indicates potential for selling pressure and may cause a temporary price correction.
-638624623037242345.png)
ETH Exchange Reserve
Meanwhile, Ethereum ETFs posted net inflows of $5.2 million on Thursday. Notably, every other issuer recorded zero flows except BlackRock's ETHA.
Ethereum could bounce off 100-day SMA to continue rally
Ethereum is trading around $2,540 on Friday, up 3.3% on the day. In the past 24 hours, ETH has recorded $25.3 million in liquidations, with long and short liquidated positions accounting for $9.67 million and $15.63 million, respectively.
ETH is attempting a correction on the 4-hour chart after approaching price levels around the $2,595 resistance. On the downside, ETH could bounce around the 100-day Simple Moving Average (SMA) to retest the $2,595 resistance level.
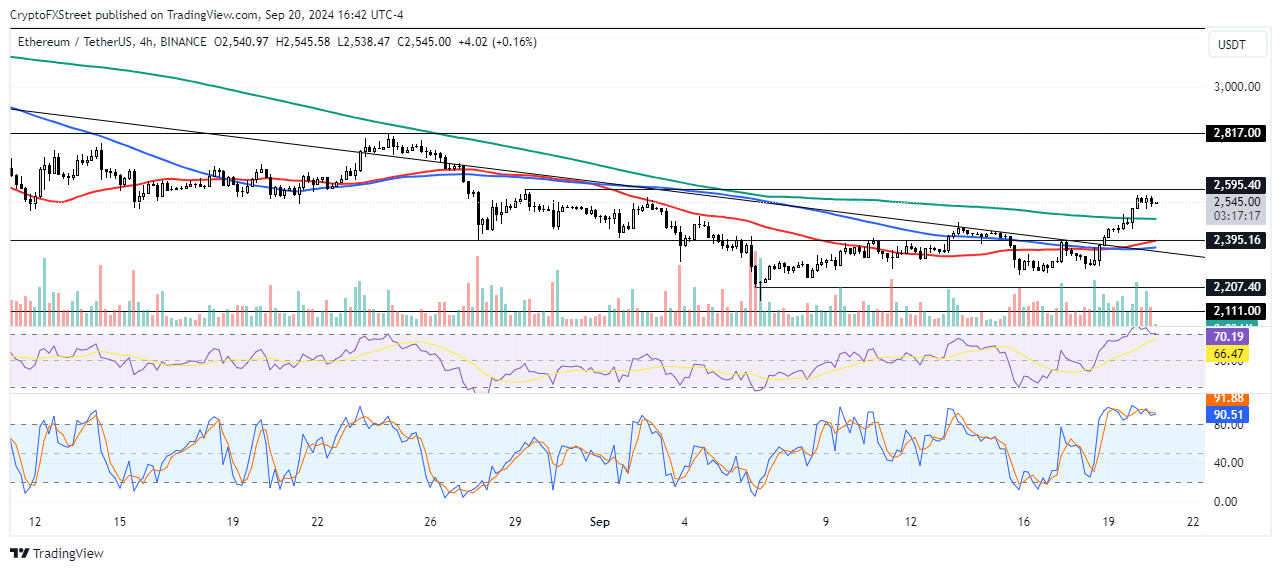
ETH/USDT 4-hour chart
A successful move above this level could see ETH tackling the $2,817 resistance that has held since the market crash on August 5. Notably, the $2,817 price served as a key support level for over four months following ETH's decline from its yearly high in March.
However, if ETH crosses below the 100-day SMA, it could find support around the $2,395 level. If bulls defend this support level, it could signal a rising bullish bias.
The 4-hour Relative Strength Index (RSI) and Stochastic momentum indicators are attempting to descend from their overbought regions at 70 and 80, respectively, at the time of writing.
In the short term, ETH could rise to $2,572 to liquidate positions worth $39.68 million.
A daily candlestick close below $2,395 will invalidate the thesis.
Ethereum FAQs
Ethereum is a decentralized open-source blockchain with smart contracts functionality. Serving as the basal network for the Ether (ETH) cryptocurrency, it is the second largest crypto and largest altcoin by market capitalization. The Ethereum network is tailored for scalability, programmability, security, and decentralization, attributes that make it popular among developers.
Ethereum uses decentralized blockchain technology, where developers can build and deploy applications that are independent of the central authority. To make this easier, the network has a programming language in place, which helps users create self-executing smart contracts. A smart contract is basically a code that can be verified and allows inter-user transactions.
Staking is a process where investors grow their portfolios by locking their assets for a specified duration instead of selling them. It is used by most blockchains, especially the ones that employ Proof-of-Stake (PoS) mechanism, with users earning rewards as an incentive for committing their tokens. For most long-term cryptocurrency holders, staking is a strategy to make passive income from your assets, putting them to work in exchange for reward generation.
Ethereum transitioned from a Proof-of-Work (PoW) to a Proof-of-Stake (PoS) mechanism in an event christened “The Merge.” The transformation came as the network wanted to achieve more security, cut down on energy consumption by 99.95%, and execute new scaling solutions with a possible threshold of 100,000 transactions per second. With PoS, there are less entry barriers for miners considering the reduced energy demands.
Recommended Articles


