

Dogecoin Price Forecast: DOGE slips to a new yearly low

Source Fxstreet
  • Dogecoin trades around $0.068 on Wednesday after correcting to a new yearly low of $0.066 the previous day.
  • Santiment data shows large whales offloading DOGE, fueling the near-term selling pressure.
  • Weakening on-chain metrics and deteriorating technical outlook suggest DOGE could face further downside risks.

Dogecoin (DOGE) recovers mildly, trading around $0.068 on Wednesday after hitting a new yearly low the previous day. Santiment data shows whale wallets offloading DOGE holdings, fueling near-term selling pressure. Meanwhile, weakening on-chain metrics and bearish technical indicators suggest that the meme coin could face further downside risks.

Whales offloading DOGE tokens 

Santiment’s Supply Distribution data shows cooling signs among whales. The metric indicates that whales holding between 100,000 and 1 million (red line), 1 million and 10 million (yellow line), and 10 million and 100 million tokens (blue line) have shed 750 million DOGE tokens since November 3. This continued distribution from whale wallets adds near-term selling pressure to the dog-themed meme coin.
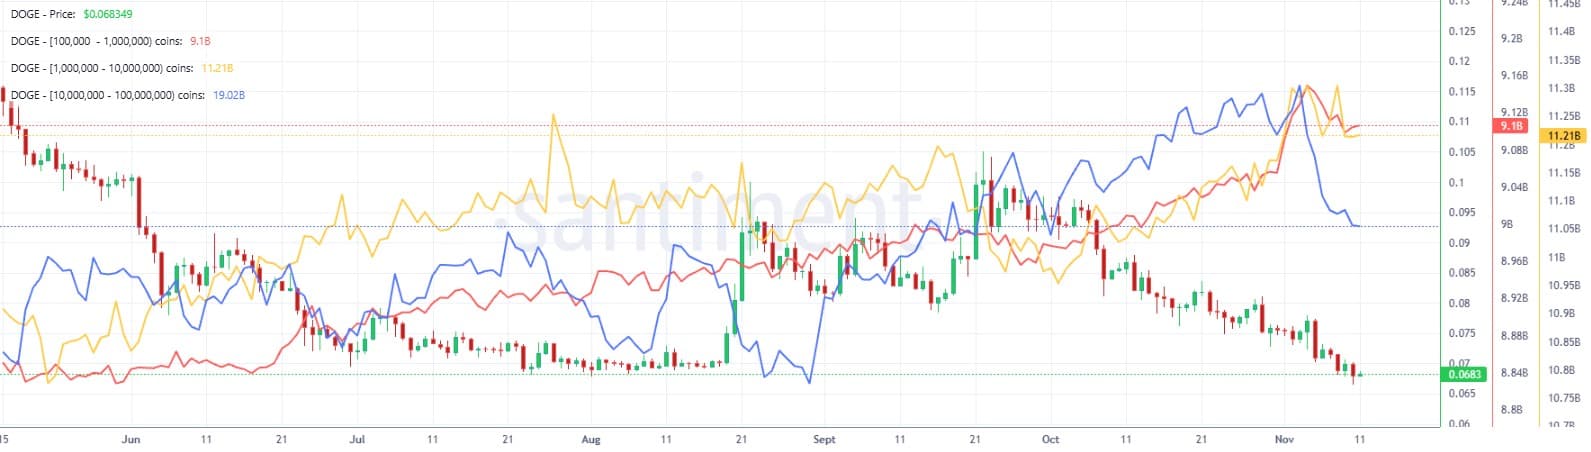
Dogecoin supply distribution chart. Source: Santiment

On-chain data shows bearish bias

CryptoQuant’s summary data shows a cautious outlook for Dogecoin. DOGE’s spot and futures markets show large whale orders alongside heating conditions. Both markets also show sell-side dominance. These highlight a bearish, cautious sentiment bias among DOGE meme coin traders.
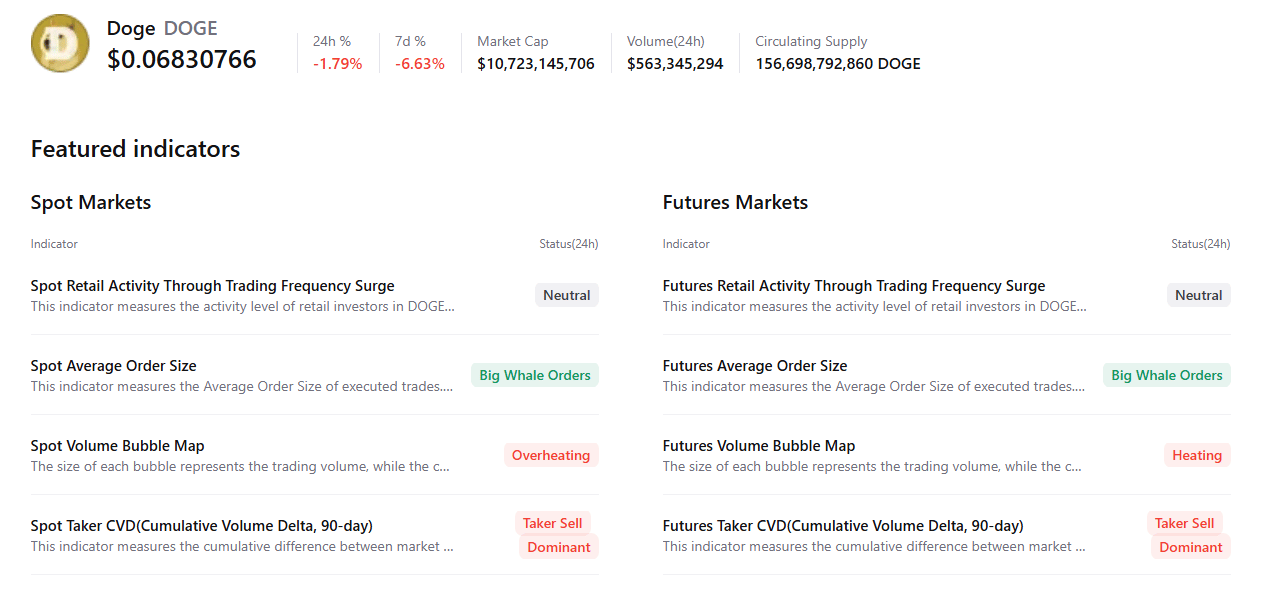
Dogecoin summary chart. Source: CryptoQuant

Dogecoin technical outlook: DOGE sets a new yearly low

Dogecoin price trades at $0.068 on Wednesday after reaching a new yearly low of $0.066 the previous day. DOGE holds a bearish near-term bias as it sits beneath the 50-day, 100-day, and 200-day Exponential Moving Averages (EMAs), clustered between roughly $0.079 to $0.088.

The latest dip has dragged the Relative Strength Index (RSI) down toward the low-30s, hinting at weak but not yet extreme oversold conditions. At the same time, the Moving Average Convergence Divergence (MACD) holds slightly negative below the zero line, reinforcing persistent downside pressure rather than a decisive reversal.

On the topside, immediate resistance is located at $0.068, the first horizontal barrier just above spot, followed by $0.077 and the 50-day EMA at $0.079, with the 100-day EMA at $0.081 adding further supply overhead; above there, the 200-day EMA at $0.088 forms a heavier cap ahead of stronger resistance at $0.102.

On the downside, initial support is at the horizontal level of $0.065, and a clear break below this floor would likely open the door to a continuation of the broader downtrend, despite emerging signs of downside fatigue in momentum gauges.
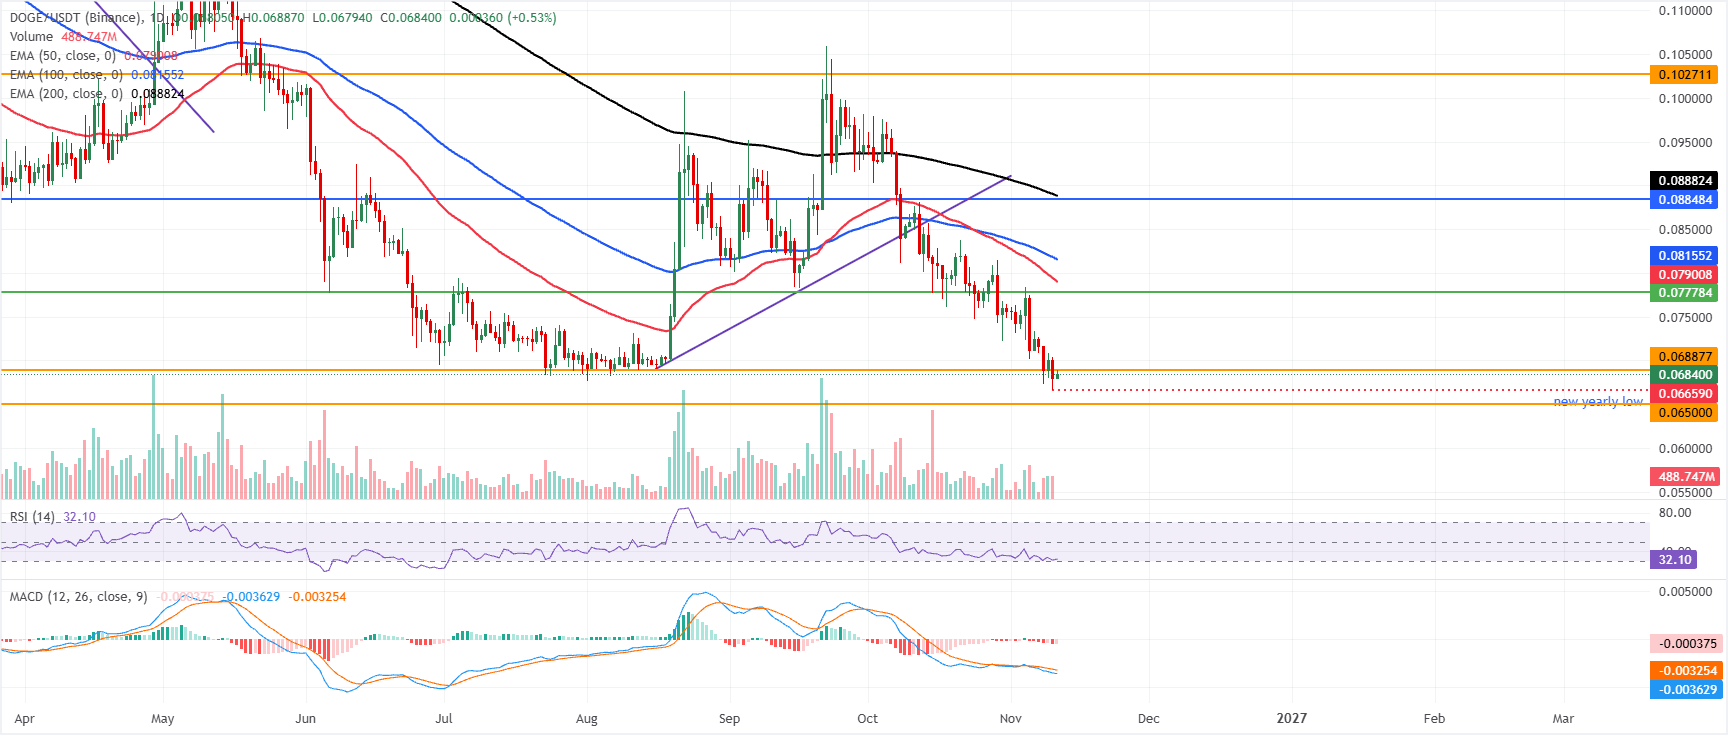
DOGE/USDT daily chart

(The technical analysis of this story was written with the help of an AI tool. Know more.)

Disclaimer: For information purposes only. Past performance is not indicative of future results.
placeholder
Micron's $4.5 billion Taiwan fab won't make a chip until 2028 — the market sold it as a 2026 problemMicron fell 17.46% to $656.39 after Bloomberg reported construction at its $4.5 billion Taoyuan Fab 11E had all but halted over a labor dispute. The plant was not due online until 2028, so no 2026 output is lost. With FY27 EPS consensus near $160 and 2027 HBM sold out, the selloff is a peak-cycle multiple reset, not a demand collapse — and $650 is the line that separates the two.
Author  Irene Q.
Nov 06, Fri
Micron fell 17.46% to $656.39 after Bloomberg reported construction at its $4.5 billion Taoyuan Fab 11E had all but halted over a labor dispute. The plant was not due online until 2028, so no 2026 output is lost. With FY27 EPS consensus near $160 and 2027 HBM sold out, the selloff is a peak-cycle multiple reset, not a demand collapse — and $650 is the line that separates the two.
placeholder
Weekly Report: Gold up 4.5%, Brent down 16.4% — three commodity regimes just resetGold rose 4.51% to $4,074.90 while Brent fell 16.42% to $98.32 in the same five sessions — two inflation hedges, opposite answers. Around them, the gold-silver ratio sits at 78.7 and copper fell 3.72%. Three regime signals, two of them close to flipping, define what commodity traders must re-price before Tuesday's CPI.
Author  Irene Q.
Nov 09, Mon
Gold rose 4.51% to $4,074.90 while Brent fell 16.42% to $98.32 in the same five sessions — two inflation hedges, opposite answers. Around them, the gold-silver ratio sits at 78.7 and copper fell 3.72%. Three regime signals, two of them close to flipping, define what commodity traders must re-price before Tuesday's CPI.
placeholder
The CPI that has no year-over-year number is the one that decides DecemberOctober CPI lands on Nov 10 at 13:30 GMT, and it will be published without a year-over-year figure: BLS never collected October 2025 prices during the federal shutdown. Consensus is +0.3% headline and +0.2% core month-on-month, against +0.6% and +0.3% in September. With December hike odds at 77%, the month-on-month print is now the whole story, and $4,197–4,202 on gold and 4.86% on the 10-year are the levels that price it.
Author  Irene Q.
Nov 09, Mon
October CPI lands on Nov 10 at 13:30 GMT, and it will be published without a year-over-year figure: BLS never collected October 2025 prices during the federal shutdown. Consensus is +0.3% headline and +0.2% core month-on-month, against +0.6% and +0.3% in September. With December hike odds at 77%, the month-on-month print is now the whole story, and $4,197–4,202 on gold and 4.86% on the 10-year are the levels that price it.
placeholder
Gold Price Analysis Today | Forex Gold Analysis | XAU/USD Analysis - November 10, 2026Get the latest gold price analysis, forex gold insights, and XAU/USD analysis for November 10, 2026. Read on for the details.
Author  Mitrade
Yesterday 01: 38
Get the latest gold price analysis, forex gold insights, and XAU/USD analysis for November 10, 2026. Read on for the details.
placeholder
Nvidia fell 4.3% on a day the Nasdaq rose 2.7% — this is a governance discount, not an AI warningNvidia closed at $178.67 on November 9, down 4.27% with an intraday low of $170.24, while the Nasdaq rose 2.74% and the Philadelphia Semiconductor Index jumped 6.85%. Volume was roughly 2.5 times the prior session. The board opened an independent review after CEO Jensen Huang's public statement about his personal life. With Q3 earnings on November 17, the two levels that matter are $170.24 and $200."
Author  Irene Q.
Yesterday 03: 27
Nvidia closed at $178.67 on November 9, down 4.27% with an intraday low of $170.24, while the Nasdaq rose 2.74% and the Philadelphia Semiconductor Index jumped 6.85%. Volume was roughly 2.5 times the prior session. The board opened an independent review after CEO Jensen Huang's public statement about his personal life. With Q3 earnings on November 17, the two levels that matter are $170.24 and $200."
Related Instrument
goTop
quote