

Zcash Price Forecast: ZEC loses steam as ETF selling weighs on recovery

Source Fxstreet
  • Zcash edges higher on Monday, following two previous days of losses and extending a consolidation range.
  • ZEC ETFs recorded $13 million in outflows last week, after a $17 million inflow the prior week, suggesting mixed investor sentiment.
  • The technical outlook for Zcash is mixed as the price remains trapped in a consolidation range between $1,112 and $1,340.

Zcash (ZEC) attracts some buyers on Monday, edging higher after two straight days of losses. The privacy coin saw $13 million in total outflows from institutional investors, while its retail appeal remains mixed. The technical outlook for Zcash suggests it is losing steam as the price continues to consolidate between $1,112 and $1,340.

NU7 release fails to lift ZEC as ETF outflows persist

Zcash’s Network Upgrade 7 (NU7) went live on its mainnet on Friday, reducing block confirmation time from 75 seconds to 25 seconds. However, the upgrade fails to attract buyers, with the price capped below the $1,340 barrier on Friday, leading to two consecutive days of retreat. 

In hindsight, the institutional aversion, with $13 million in outflows last week, weighs on the upgrade. Persistent withdrawals from ZEC-focused Exchange-Traded Funds (ETFs) could deepen downside risk.

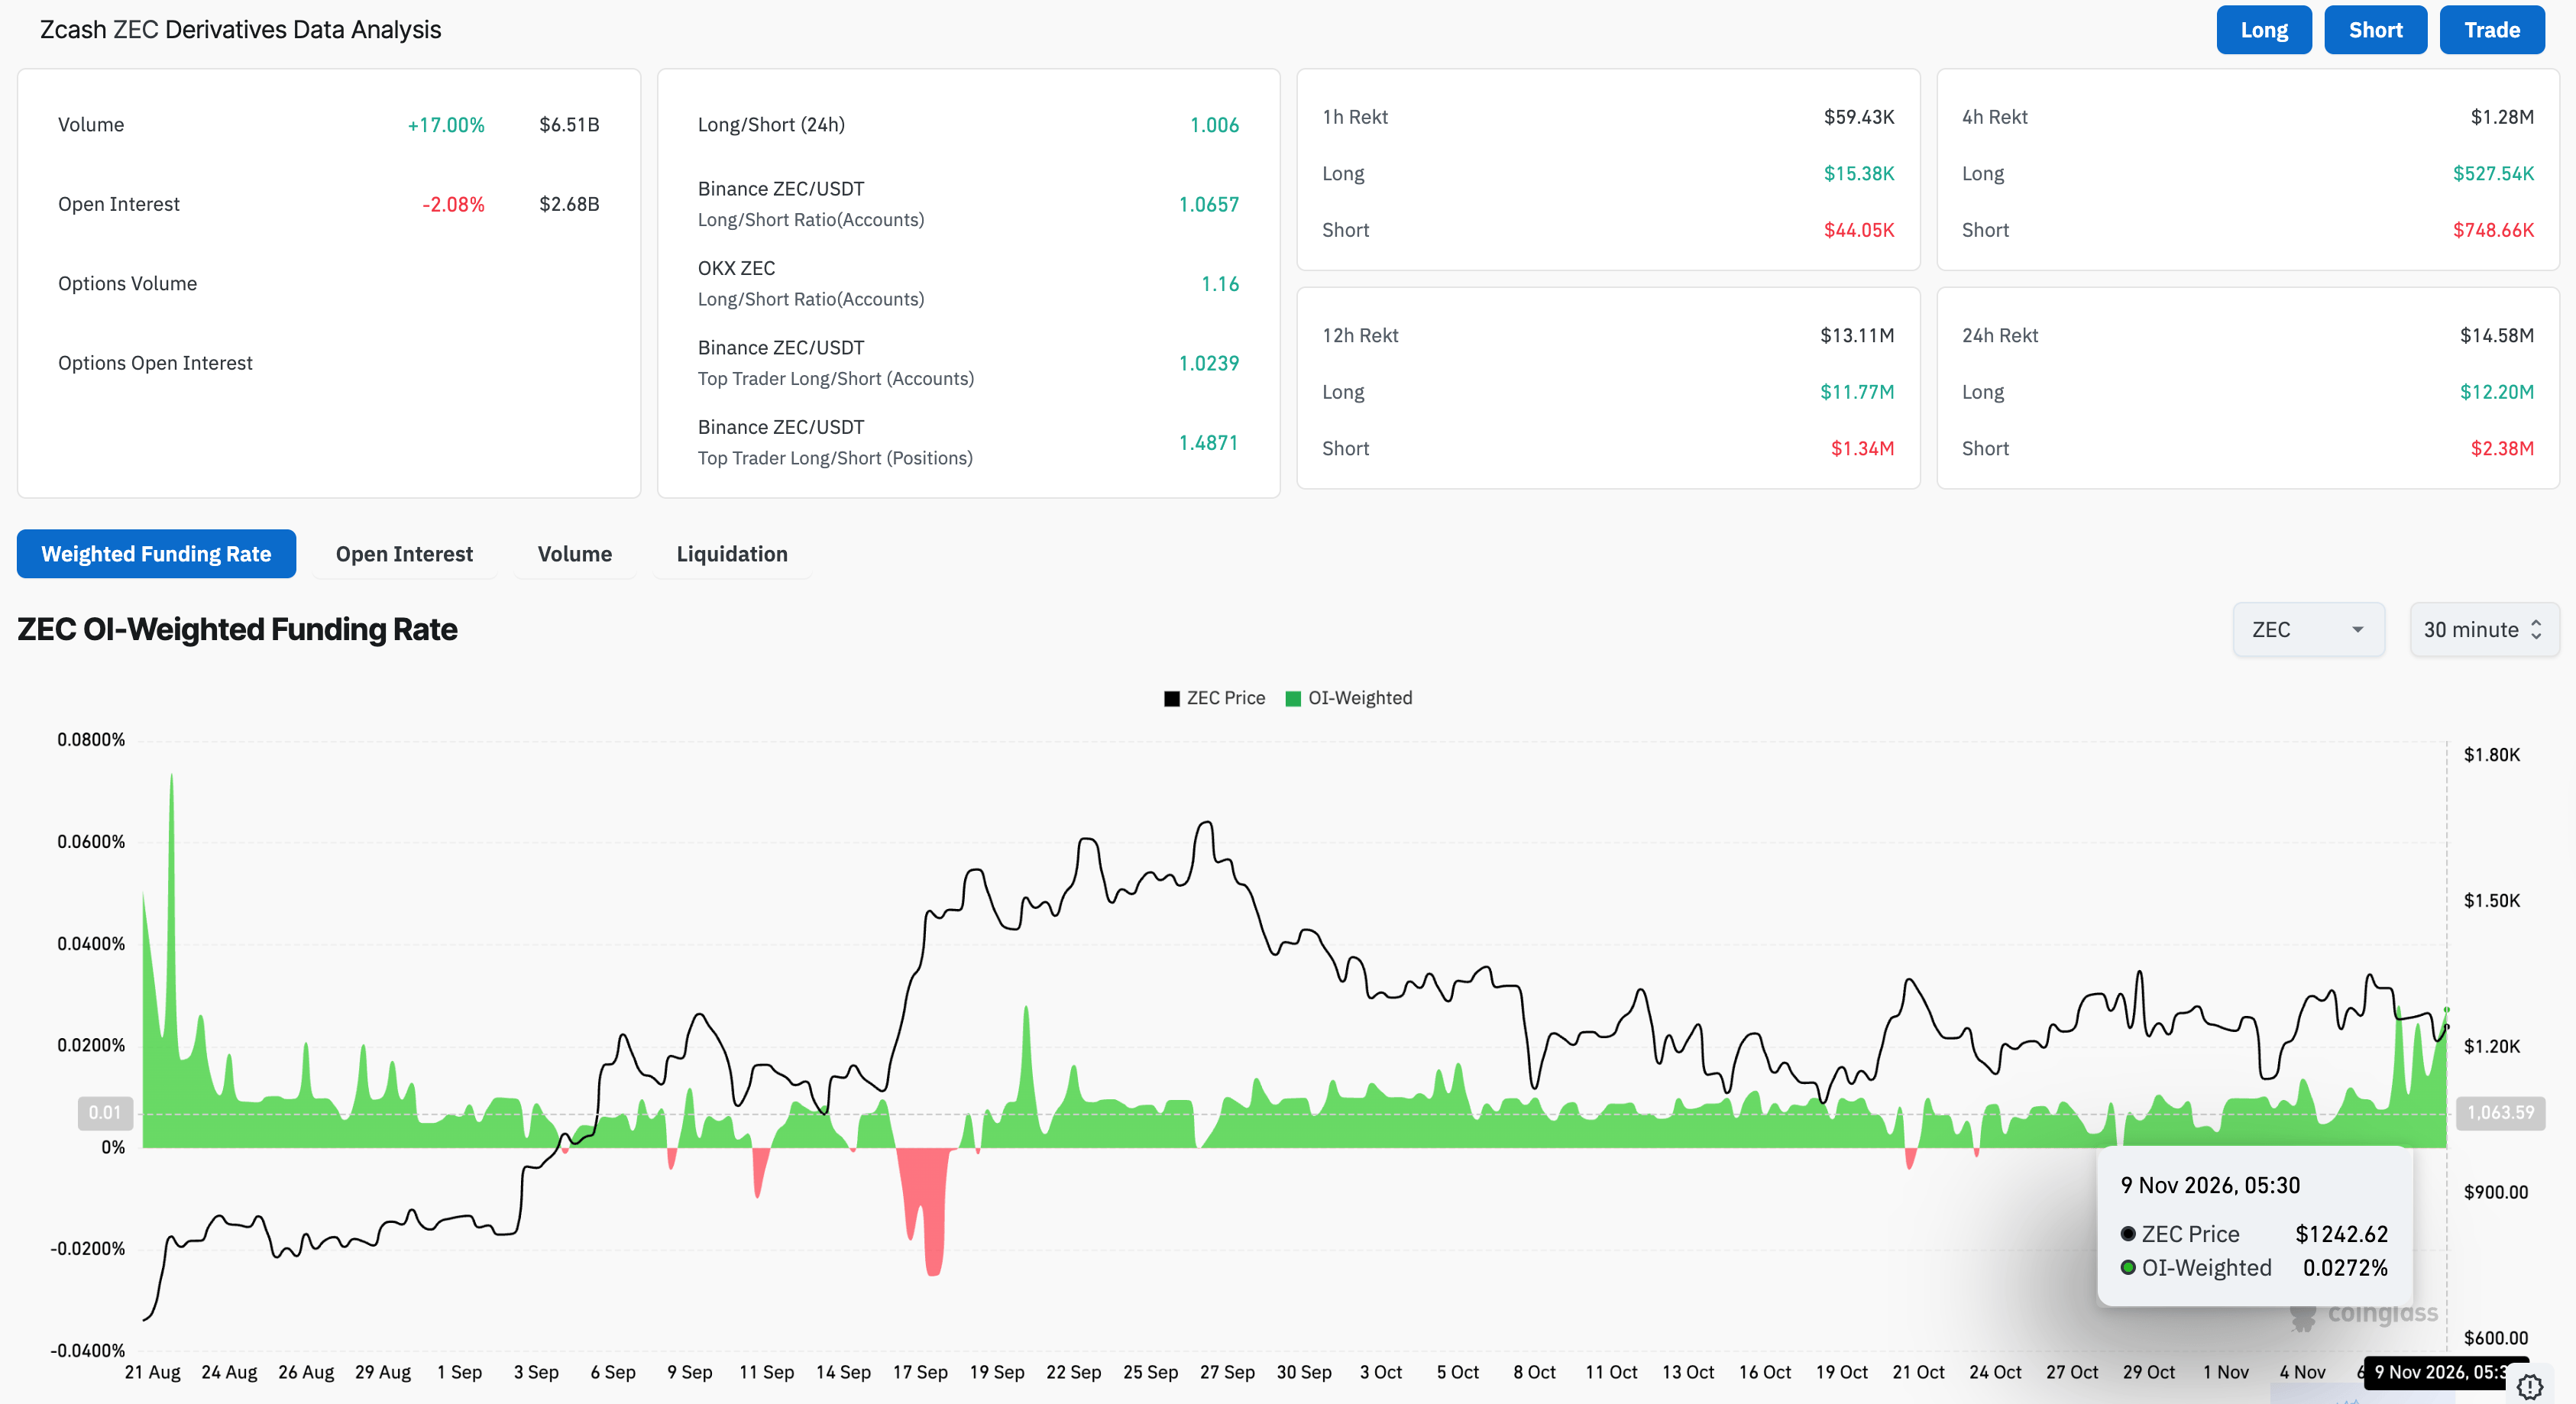
On the retail side, ZEC futures Open Interest (OI) is down 2% over the last 24 hours to $2.68 billion, indicating an unwinding of active contracts while the funding rate rises to 0.0272%, suggesting that traders are rebuilding long-side positions in hopes of a potential rebound.
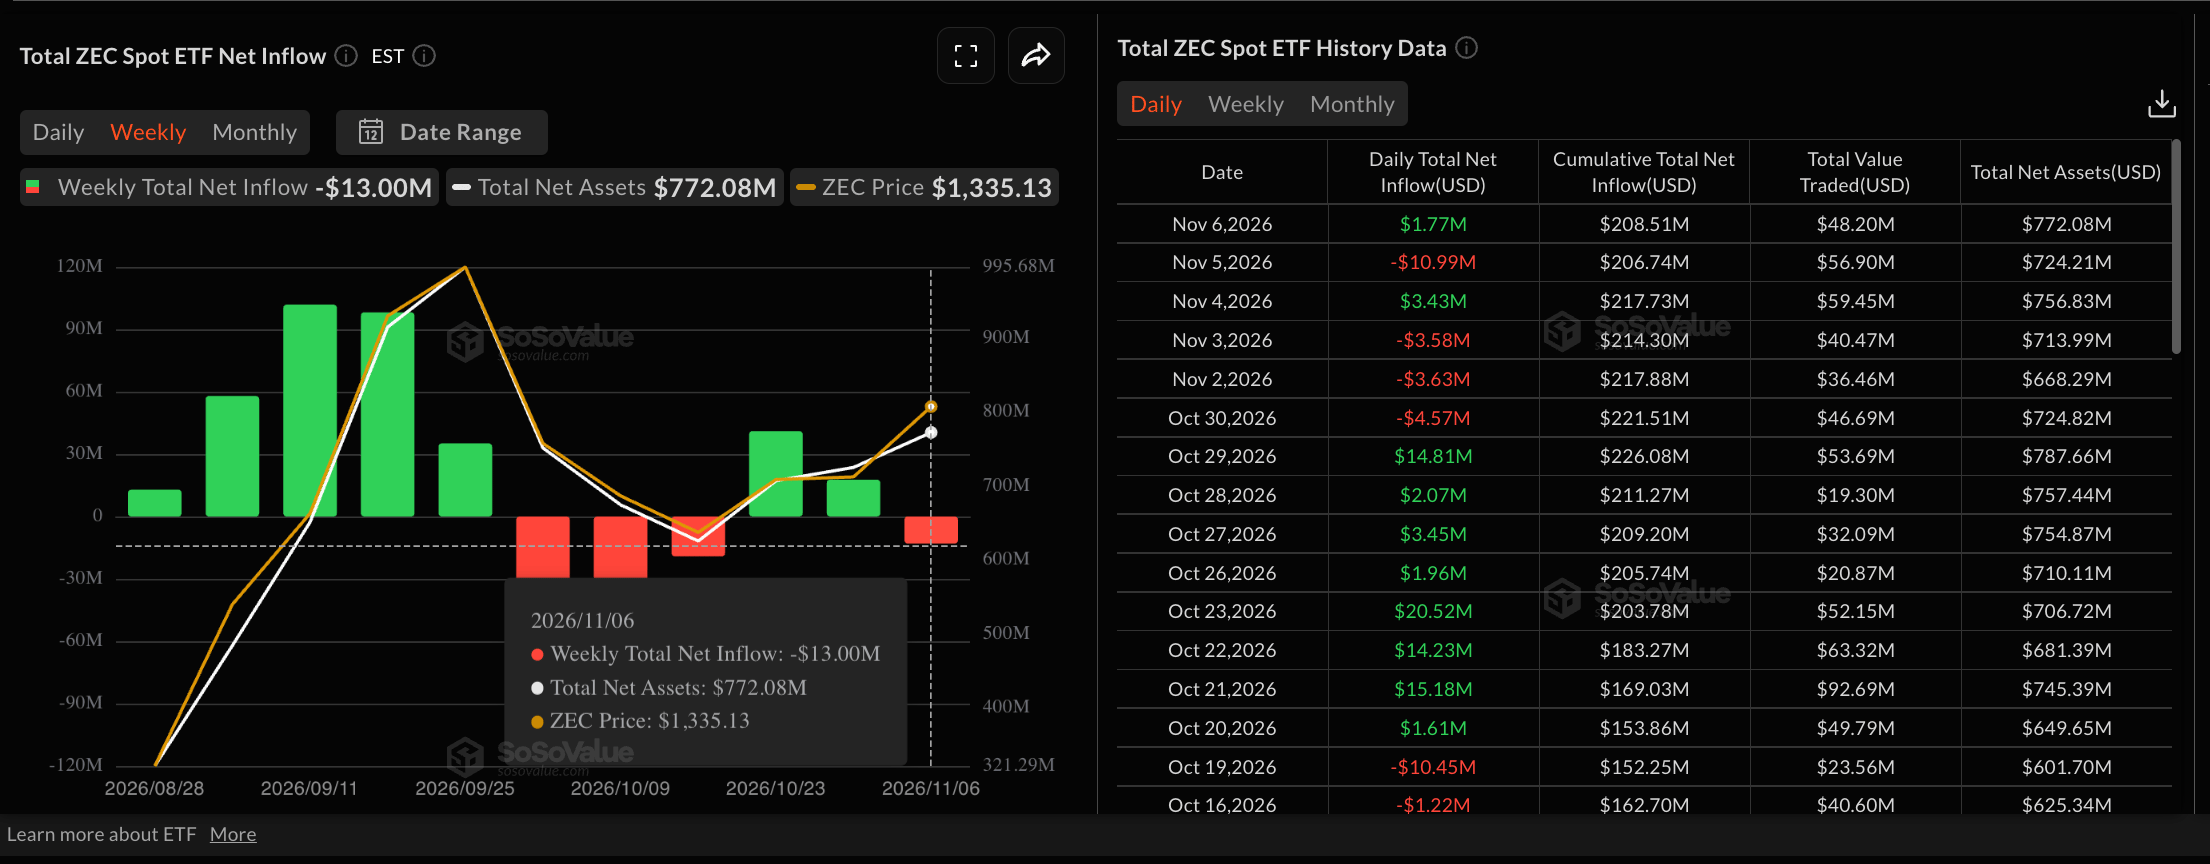
Zcash ETFs data. Source: Sosovalue
Zcash derivatives data. Source: CoinGlass

Technical outlook: Will Zcash regain bullish momentum?

Zcash trades at $1,240 at press time on Monday, testing the 50-day Exponential Moving Average (EMA) at $1,219, which sits well above the longer-term 200-day EMA at $876, which together hint at a supportive near-term structure.

The Moving Average Convergence Divergence (MACD) and signal line converge near the zero line, while the Relative Strength Index (RSI) hovers just below the 50 level, suggesting a steady, neutral momentum.

To reinstate a bullish trend, Zcash must reclaim the $1,340 barrier set by the October high, which could pave the path toward the September 26 high of $1,698.
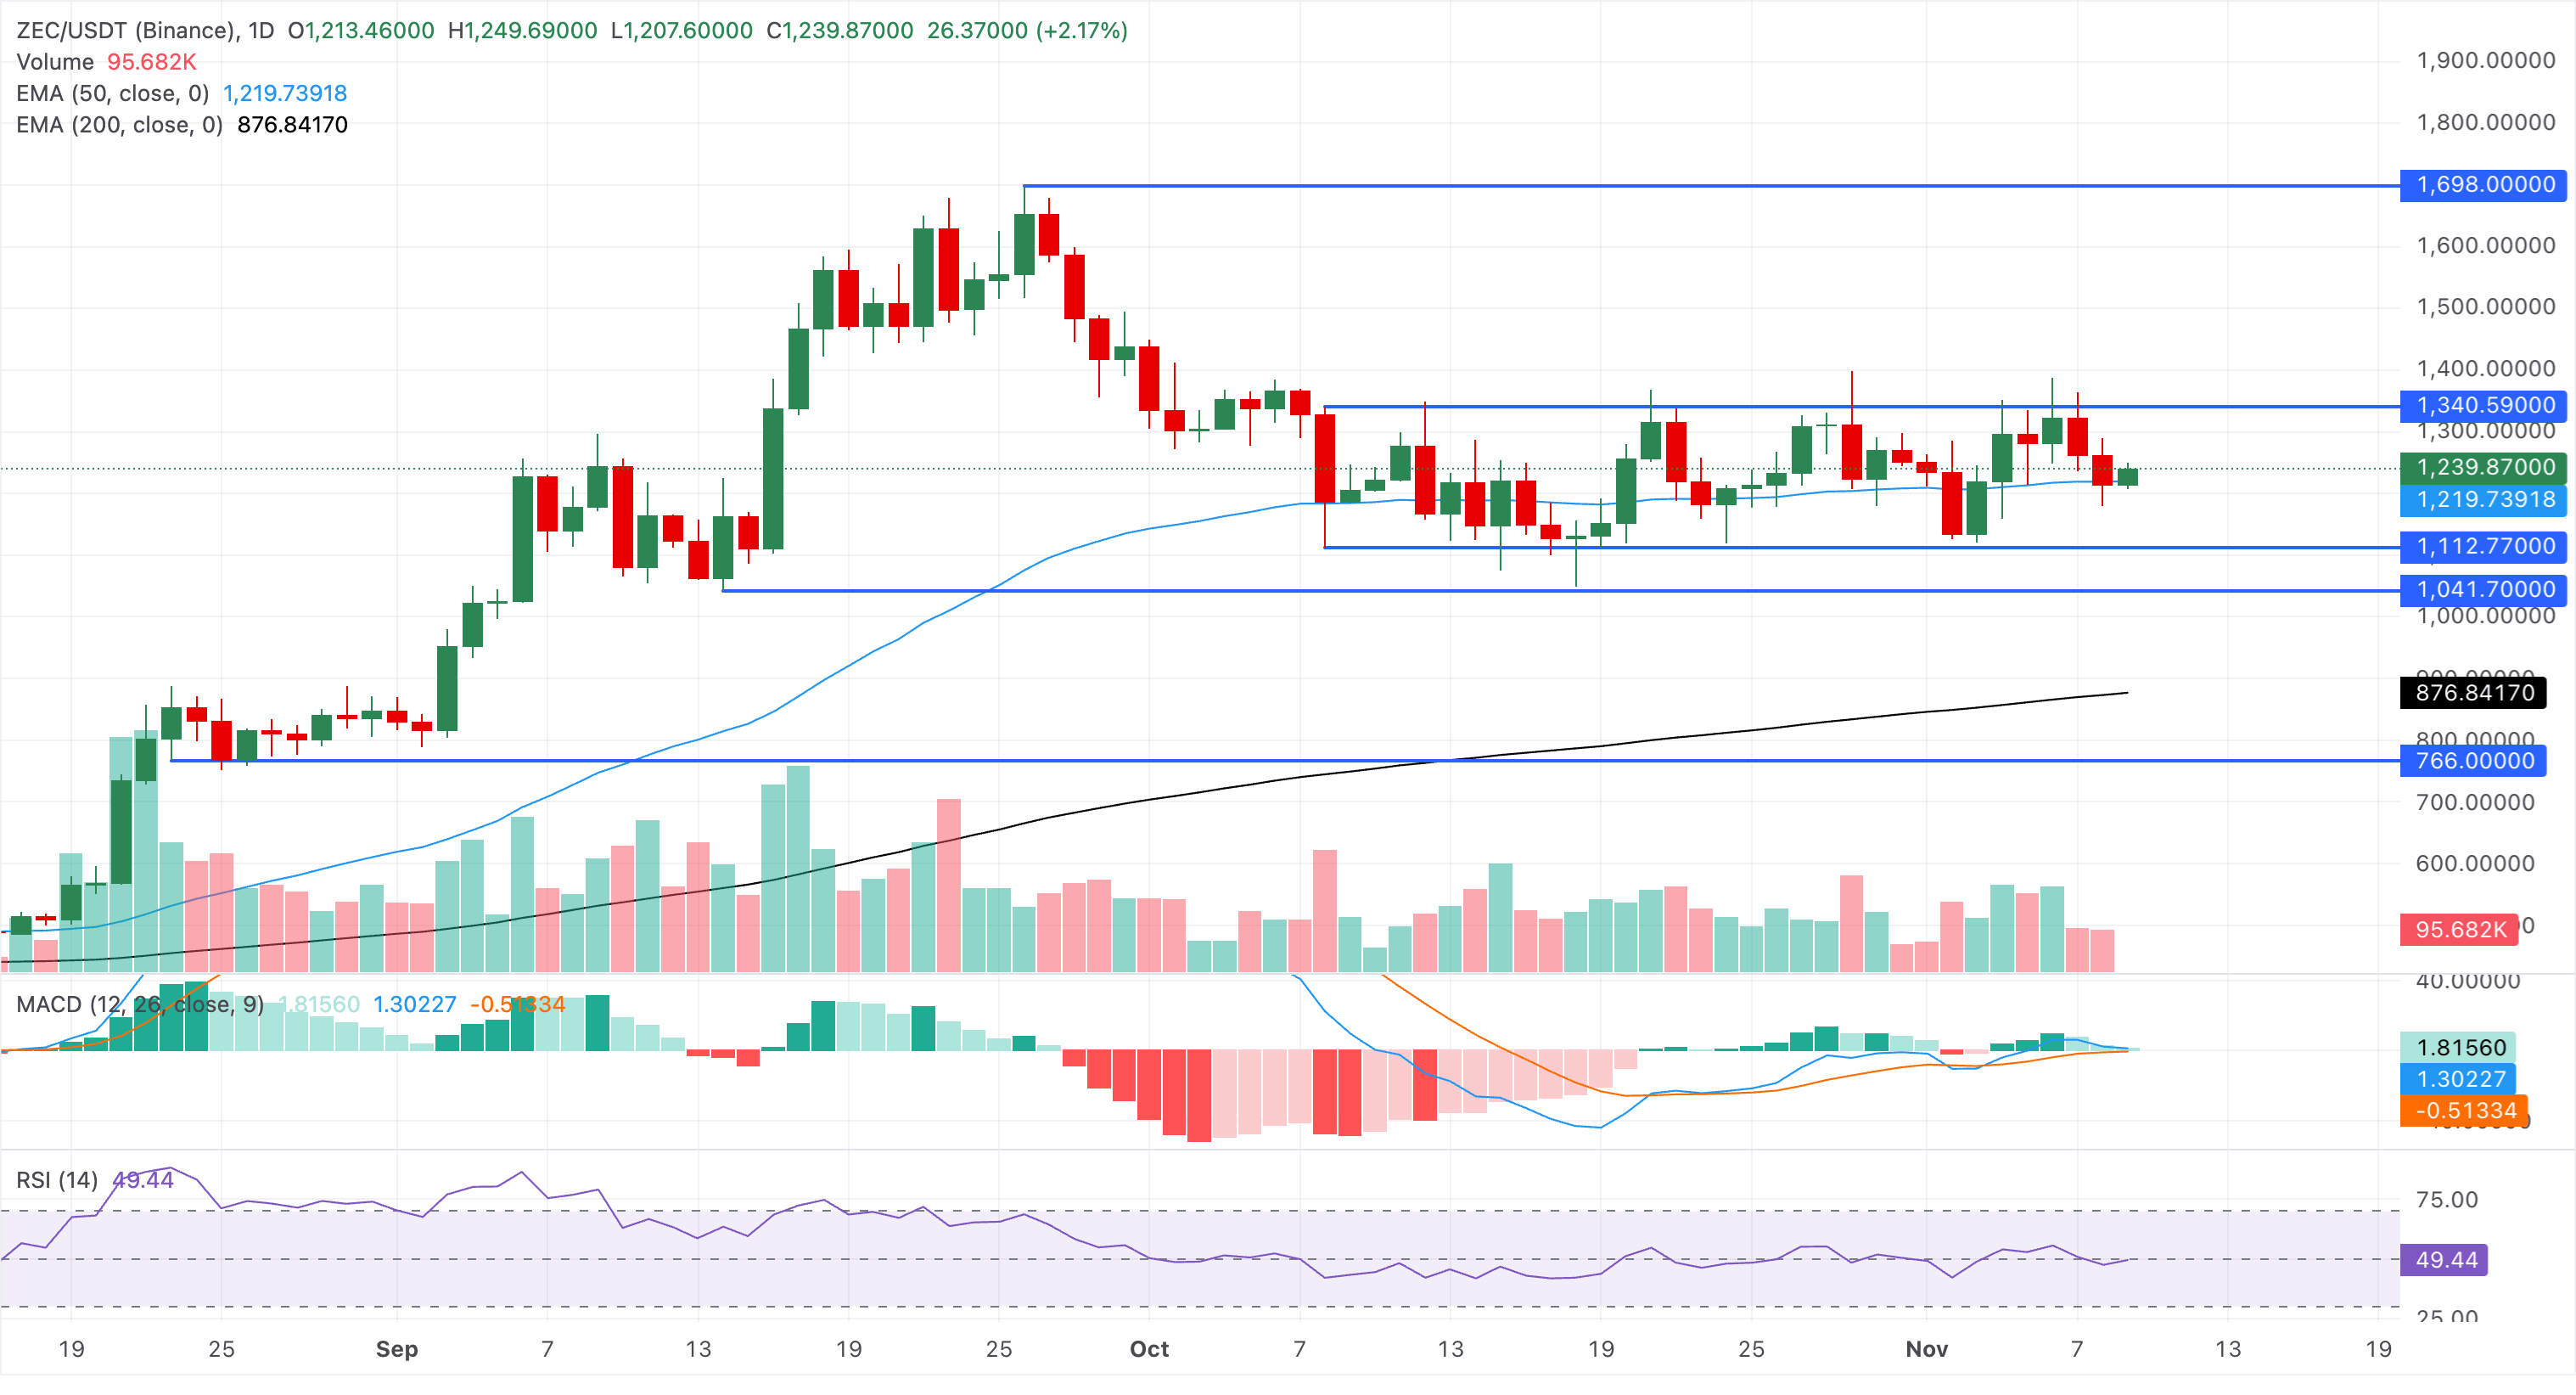
ZEC/USDT daily price chart.

On the downside, immediate support is seen at the 50-day EMA around $1,219, with a deeper structural floor at the October 8 low of $1,112 if selling pressure accelerates.

(The technical analysis of this story was written with the help of an AI tool. Know more.)

Disclaimer: For information purposes only. Past performance is not indicative of future results.
placeholder
Brent slips to $111 as a two-day Hormuz plan lands — the supply-risk premium is the only thing being soldBrent fell 1.95% to $111.20 and WTI to $101.92 after Iran's foreign minister said a Qatar-brokered plan could reopen the Strait of Hormuz in two days. Two tankers were still reported hit by mines. The move is a premium unwind, not a supply change.
Author  Irene Q.
Nov 02, Mon
Brent fell 1.95% to $111.20 and WTI to $101.92 after Iran's foreign minister said a Qatar-brokered plan could reopen the Strait of Hormuz in two days. Two tankers were still reported hit by mines. The move is a premium unwind, not a supply change.
placeholder
TradingKey Daily Market Brief: Nasdaq Falls Over 5%, AI Stocks Plunge as Nvidia Drops Over 9%, Micron Falls Over 17%, SanDisk Drops Over 22% During the Asian trading session on November 6, the three major U.S. stock indices tumbled across the board overnight as the sell-off across the AI data center suppl
Author  TradingKey
Nov 06, Fri
During the Asian trading session on November 6, the three major U.S. stock indices tumbled across the board overnight as the sell-off across the AI data center suppl
placeholder
Gold Price Analysis Today | Forex Gold Analysis | XAU/USD Analysis - November 6, 2026Get the latest gold price analysis, forex gold insights, and XAU/USD analysis for November 6, 2026. Read on for the details.
Author  Mitrade
Nov 06, Fri
Get the latest gold price analysis, forex gold insights, and XAU/USD analysis for November 6, 2026. Read on for the details.
placeholder
Gold's $250 week runs into the last payrolls before DecemberSpot gold traded at $4,080.79 after a roughly 6% weekly rally from the Oct 30 low of $3,869.85, touching $4,146.63 on Nov 5. Three bids are stacked into the move: real-rate relief, record official-sector buying, and a geopolitical premium. Tonight's October payrolls (+65K consensus, 4.2% unemployment) decide which bid survives, with $4,000 and $4,200 as the two lines.
Author  Irene Q.
Nov 06, Fri
Spot gold traded at $4,080.79 after a roughly 6% weekly rally from the Oct 30 low of $3,869.85, touching $4,146.63 on Nov 5. Three bids are stacked into the move: real-rate relief, record official-sector buying, and a geopolitical premium. Tonight's October payrolls (+65K consensus, 4.2% unemployment) decide which bid survives, with $4,000 and $4,200 as the two lines.
placeholder
Micron's $4.5 billion Taiwan fab won't make a chip until 2028 — the market sold it as a 2026 problemMicron fell 17.46% to $656.39 after Bloomberg reported construction at its $4.5 billion Taoyuan Fab 11E had all but halted over a labor dispute. The plant was not due online until 2028, so no 2026 output is lost. With FY27 EPS consensus near $160 and 2027 HBM sold out, the selloff is a peak-cycle multiple reset, not a demand collapse — and $650 is the line that separates the two.
Author  Irene Q.
Nov 06, Fri
Micron fell 17.46% to $656.39 after Bloomberg reported construction at its $4.5 billion Taoyuan Fab 11E had all but halted over a labor dispute. The plant was not due online until 2028, so no 2026 output is lost. With FY27 EPS consensus near $160 and 2027 HBM sold out, the selloff is a peak-cycle multiple reset, not a demand collapse — and $650 is the line that separates the two.
goTop
quote