


Cardano Price Forecast: ADA defends key support level amid mounting bearish pressure
- Cardano hovers below $0.20 on Monday, stabilizing the prevailing downfall as buyers defend the $0.1894 support floor.
- On-chain data shows muted whale activity despite a surge in social dominance, implying a buildup in social chatter.
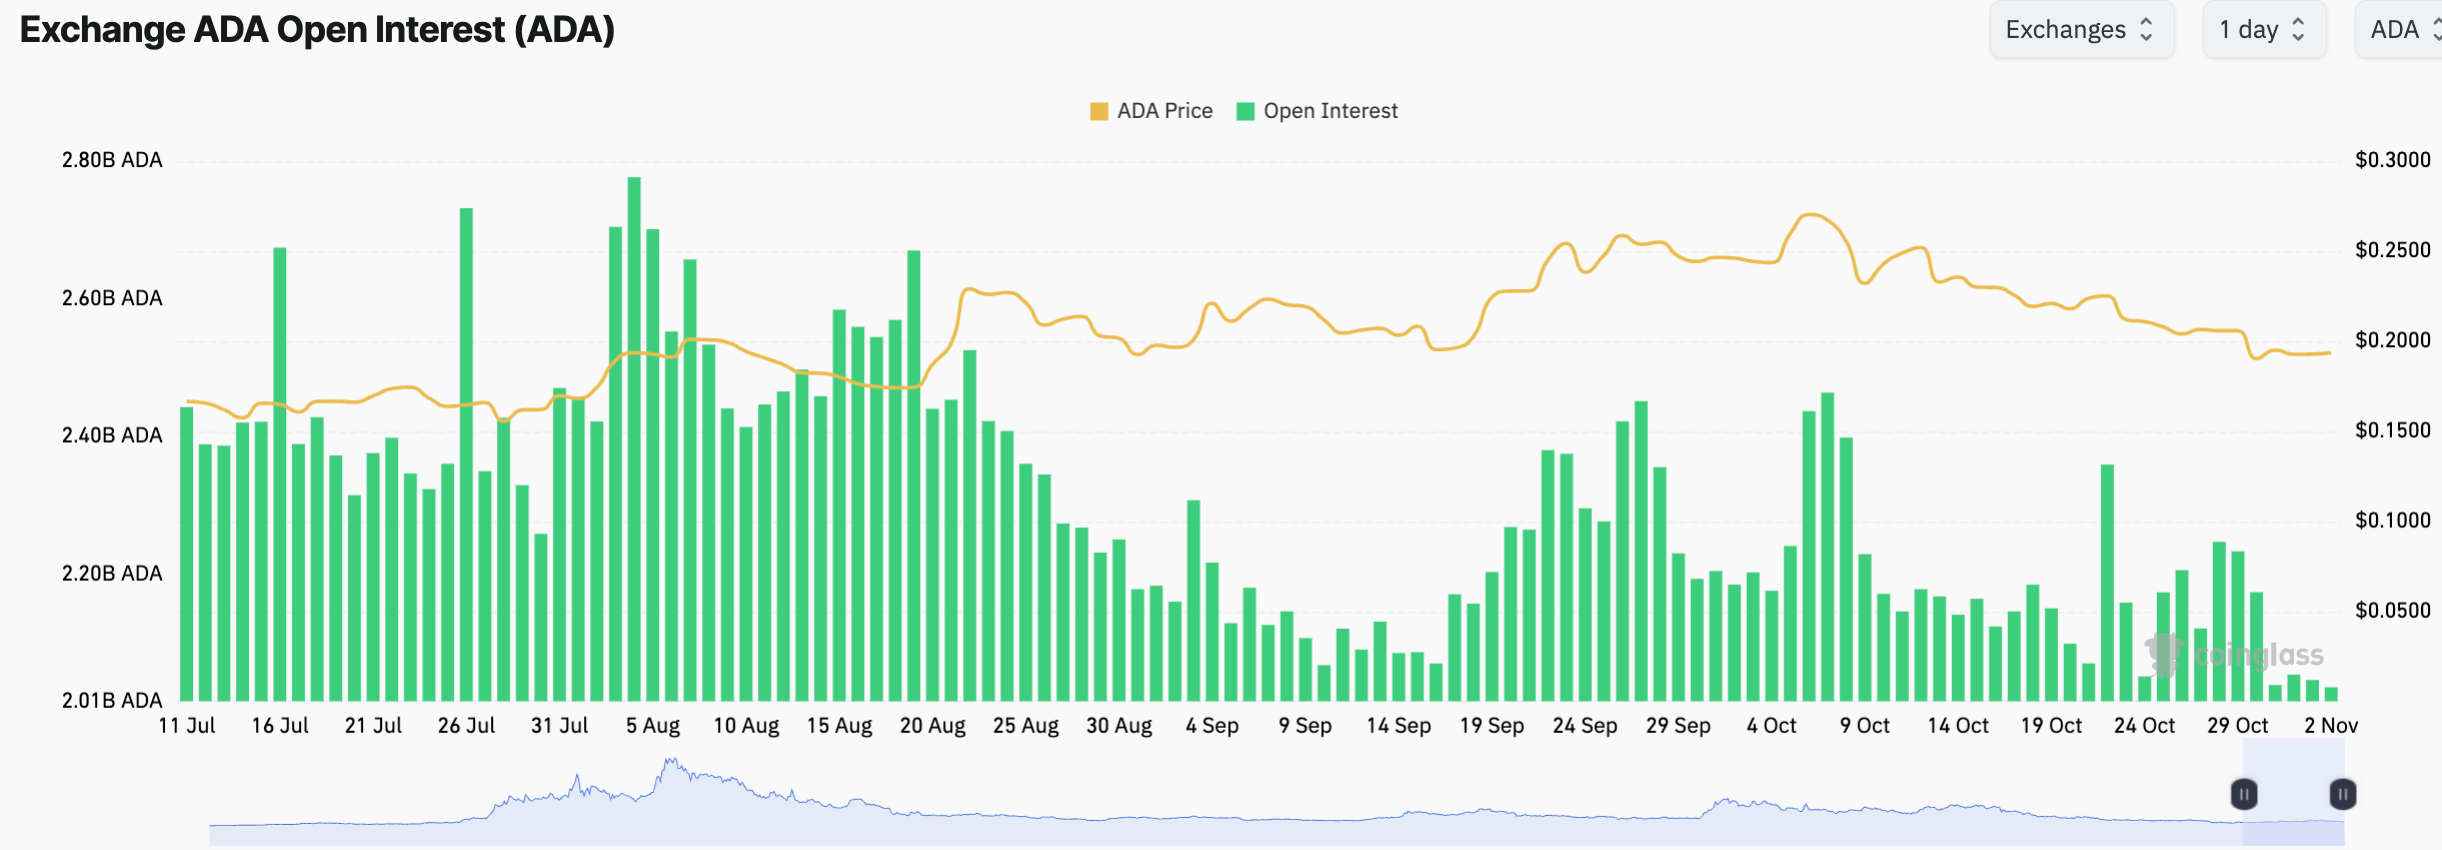
- ADA futures Open Interest is down to almost 2 billion ADA from 2.25 billion ADA last week, suggesting reduced retail demand.
Cardano (ADA) continues to consolidate above its $0.1894 support level on Monday, stabilizing after roughly an 8% loss on last Thursday. On-chain data shows reduced activity among large-wallet investors, commonly referred to as whales, despite a rise in Cardano’s social chatter. Derivatives data show reduced retail activity, with Open Interest down to almost 2 billion ADA from 2.25 billion ADA last week.
The technical outlook for ADA suggests a downside bias as bearish pressure mounts.
Cardano whales rest amid waning retail demand
Cardano’s social dominance score rises to 2.49% on Monday, the highest since late June, linked to no ADA or Midnight (ADA) tokens stolen in the Binance hack.
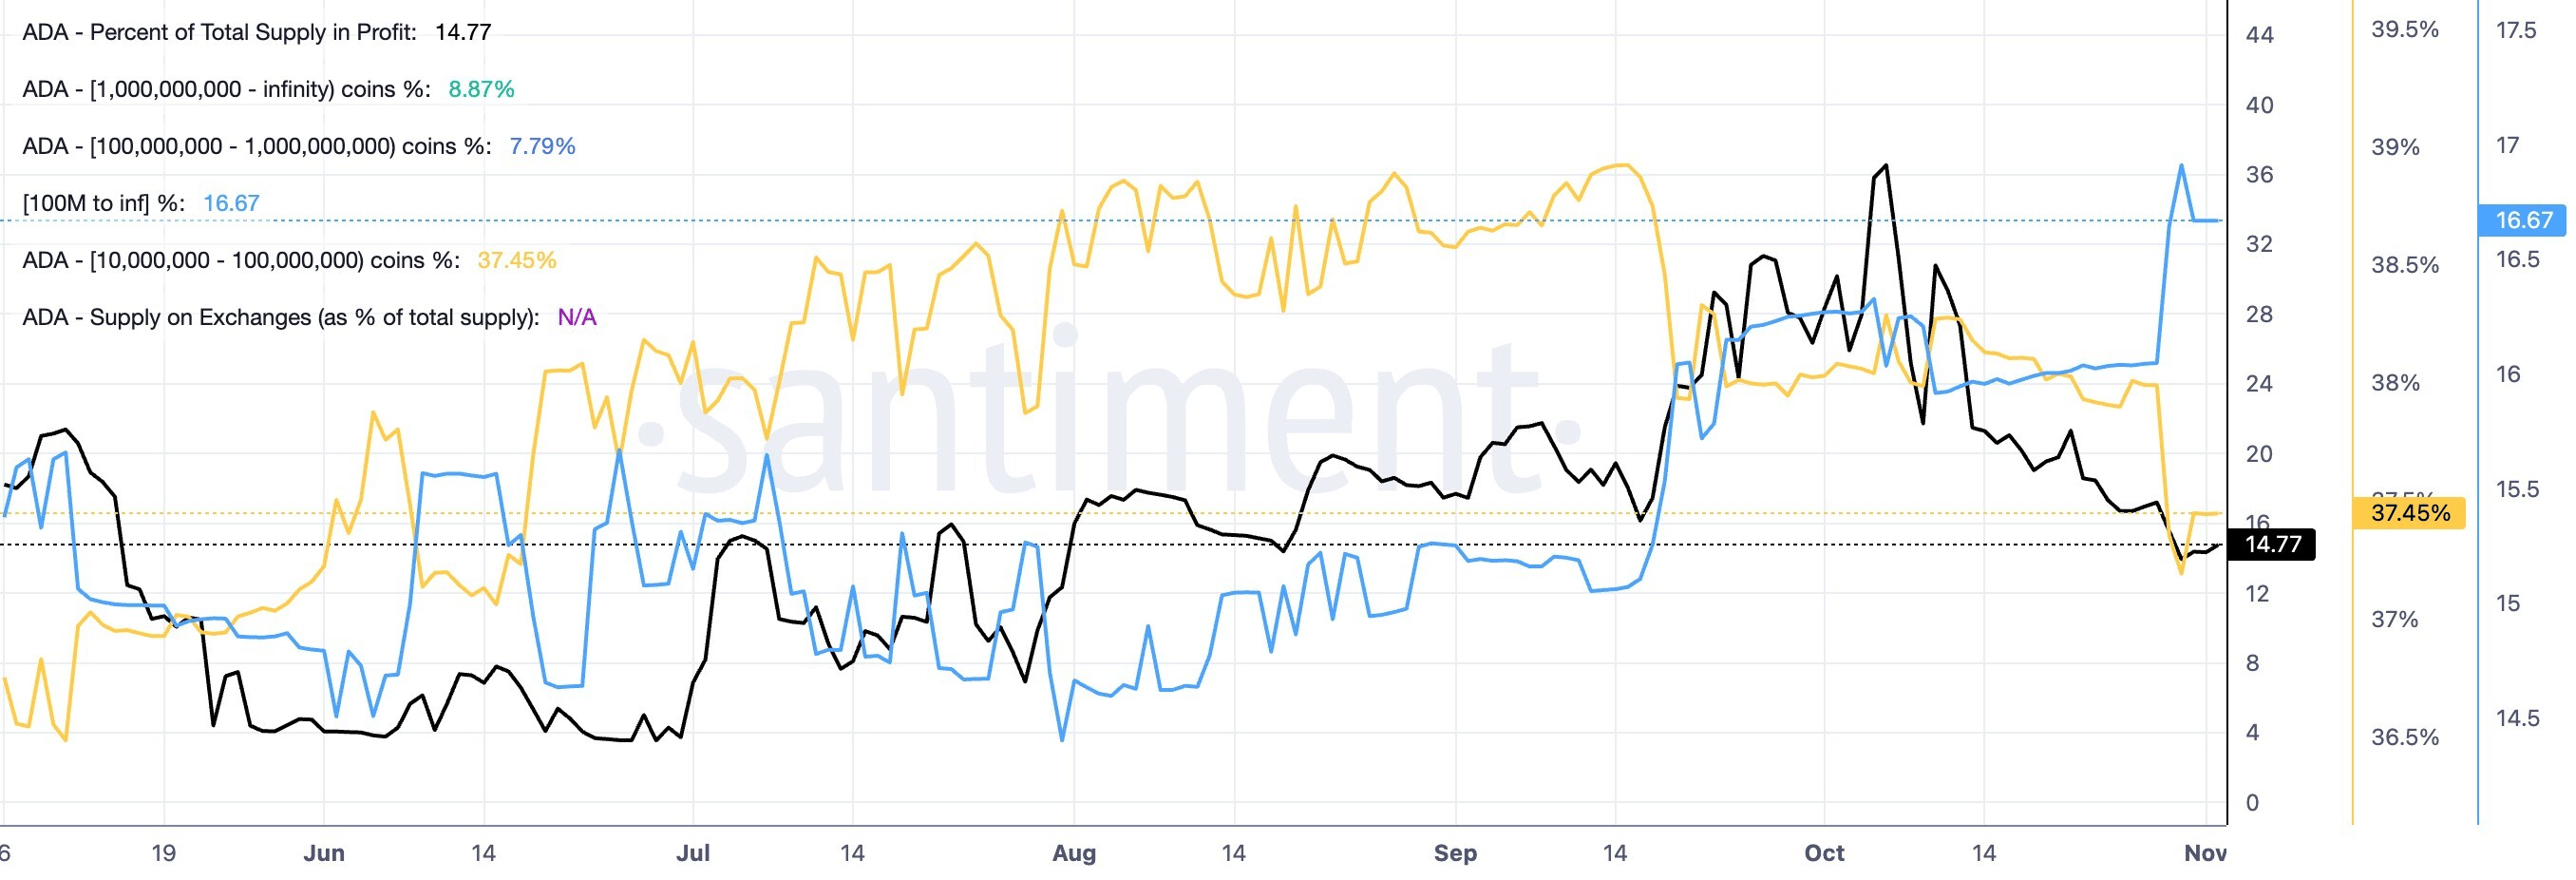
However, Cardano whales take a breather after last month’s sell-off. Santiment data shows holders of 10 million to 100 million now hold 37.45% of the circulating supply, down from 38.03% last month, indicating that cohorts with the largest holdings are losing their risk appetite. Meanwhile, the ADA supply in profit dropped from 28.36% to 14.77%, implying a profit-taking spree. If whales continue to trim their holdings this month, ADA could extend its 21% losses from October.
On the other hand, Cardano is losing retail support. CoinGlass data shows that ADA futures Open Interest has fallen to almost 2 billion ADA from 2.25 billion ADA last week, suggesting that traders are closing positions rather than building fresh exposure.
Technical outlook: Will Cardano extend its decline?
Cardano trades below $0.2000 on Monday, following a 21% decline last month. ADA maintains a bearish near-term tone as it sits below both the 50-day and 200-day Exponential Moving Averages (EMAs) at $0.2179 and $0.2408, respectively.
From a technical perspective, the altcoin has slipped back below the prior rising support line at around $0.2019, indicating a bearish reversal. Still, ADA holds above the $0.1894 support floor set by the August 30 low, opening the path toward the August 18 and July 27 lows at $0.1712 and $0.1537, respectively.
Momentum remains weak, with the Relative Strength Index (RSI) holding near 32 on the daily chart, hinting at persistent downside pressure alongside a negative Moving Average Convergence Divergence (MACD) reading below zero.
On the topside, initial resistance is seen at the former trendline break level near $0.2019, ahead of the 50-day EMA at $0.2179, with the 200-day EMA at $0.2408 reinforcing a broader bearish cap.
(The technical analysis of this story was written with the help of an AI tool. Know more.)
Recommended Articles


