


Bitcoin Price Forecast: BTC retreats as geopolitical uncertainty offsets ETF inflows
- Bitcoin falls over 2% on Thursday, threatening to erase most of its gains from earlier this week.
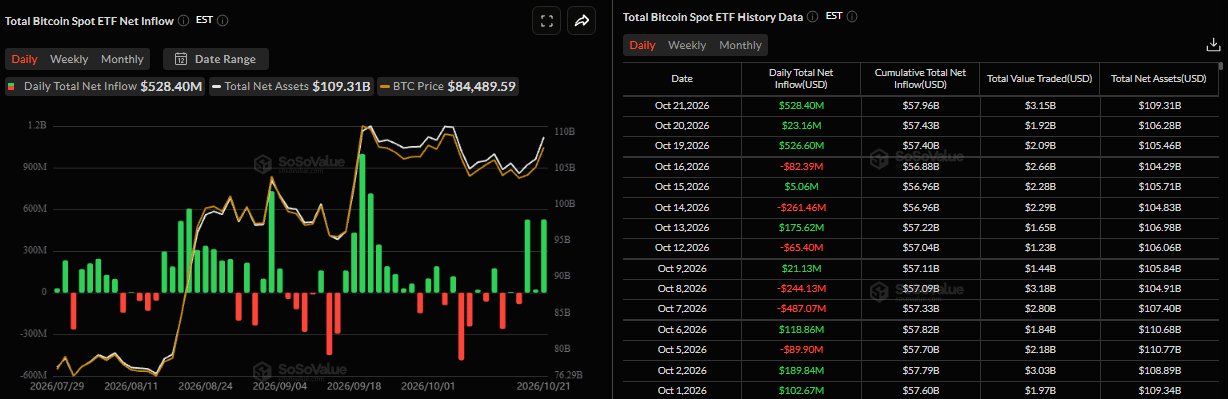
- US-listed Bitcoin recorded an inflow of $528.40 million on Wednesday, marking three consecutive days of positive flows this week.
- Escalating tensions in the Middle East are dampening risk appetite and capping BTC’s recovery.
Bitcoin (BTC) declines more than 2% on Thursday, trading below $83,000 at the time of writing, threatening to erase its gains from earlier this week. Despite the pullback, institutional demand remains supportive, with spot Bitcoin Exchange Traded Funds (ETFs) recording a third consecutive day of inflows so far this week.
Meanwhile, traders should remain cautious as escalating tensions in the Middle East weigh on risk appetite and cap the Crypto King’s recovery.
Institutional demand returns
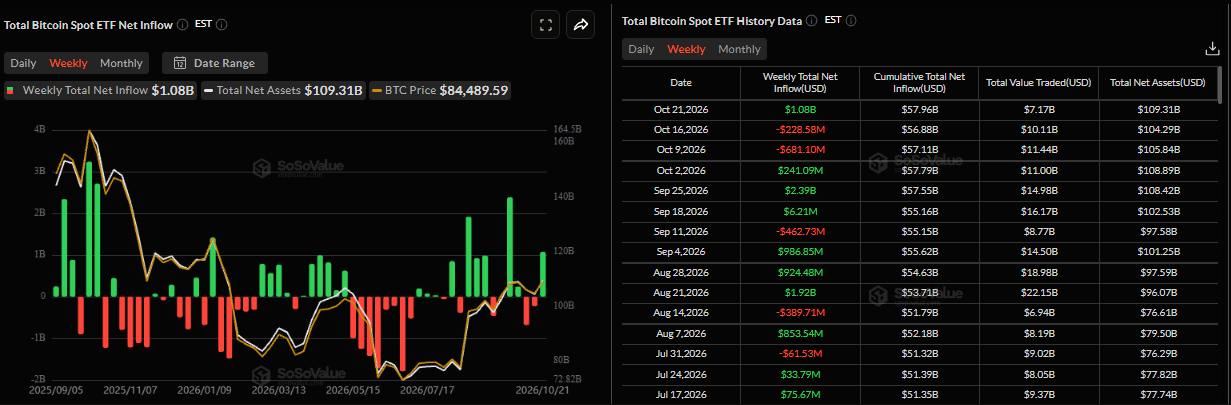
Institutional demand shows signs of a comeback so far this week. SoSoValue data show BTC spot ETFs recorded an inflow of $528.40 million on Wednesday, marking the third consecutive inflow so far this week. Moreover, weekly flows have exceeded $1 billion through Wednesday, breaking two consecutive weeks of outflows. If these inflows continue and intensify through the week, BTC could extend the rebound.
In addition, BIT Asset Management AG, BIT’s wholly owned Swiss asset management subsidiary, announced on Thursday that the Swiss Financial Market Supervisory Authority (FINMA) has approved the Bitcoin Fund ETF (BBIT).
As FINMA confirmed, it is the first exchange-traded fund in Switzerland to invest directly in Bitcoin. It is currently Europe’s only spot Bitcoin ETF. The fund is expected to begin trading on the SIX Swiss Exchange in November.
The launch could broaden institutional access to BTC, encourage wider adoption and strengthen the Crypto King’s long-term outlook.
Middle East tension caps BTC rebound
Iran’s Islamic Revolutionary Guard Corps (IRGC) Navy said on Thursday that four vessels involved in illegal oil transfers in the northern Persian Gulf were simultaneously hit and caught fire after being tracked by its forces on Wednesday, Reuters reported.
The IRGC added that three more vessels collided with mines west of the Strait of Hormuz, and warned the US military that continued provocations could lead to a wider response against its regional bases.
Moreover, Iran’s Foreign Minister, Abbas Araghchi, stated that the country is prepared for diplomacy while also emphasizing its readiness to defend itself.
Araghchi added that there was little reason to expect progress now as the US had shown no willingness to reach an understanding.
Separately, The New York Times reported that the US and Israel have drawn up plans for a short but intense military campaign against Iran after the US midterm elections.
These developments keep the geopolitical risk premium in play, dampening risk appetite and capping BTC’s recovery.
Bitcoin technical outlook: BTC faces rejection from the $85,000 mark
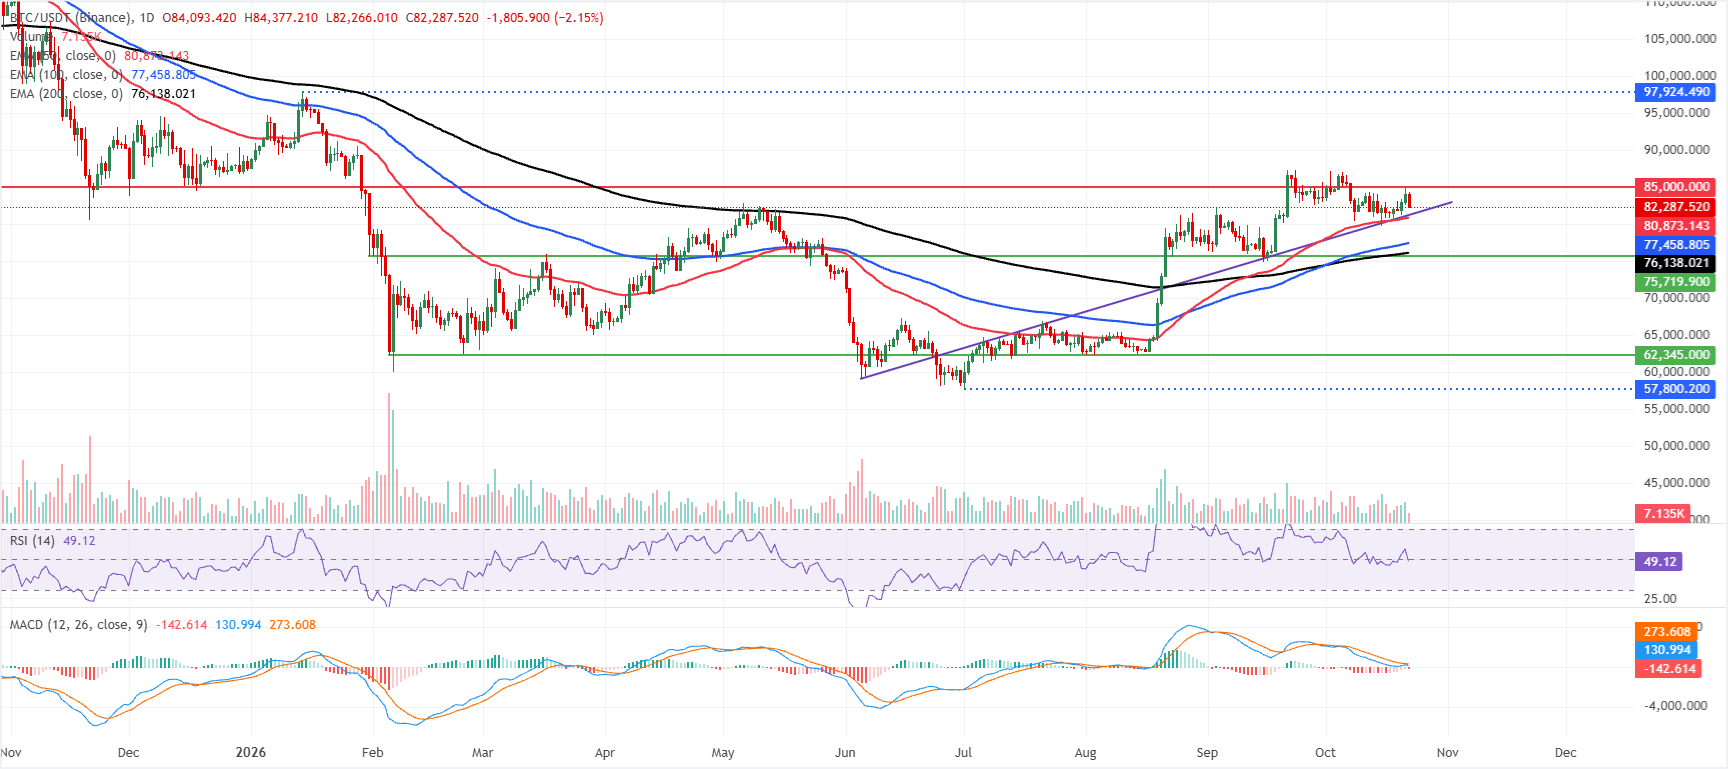
Bitcoin price trades at $82,287 at the time of writing on Thursday, holding a constructive bias as price remains above the 50-day, 100-day and 200-day Exponential Moving Averages (EMAs) clustered between roughly $80,900 and $76,100.
This stacked EMA configuration suggests the broader uptrend remains intact, although the Relative Strength Index (RSI) around 49 and a negative Moving Average Convergence Divergence (MACD) histogram reading hint that upside momentum has cooled and BTC is consolidating rather than trending higher impulsively.
On the topside, immediate resistance is seen at the horizontal barrier near $85,000, where a break higher would expose fresh highs and potentially revive bullish momentum.
On the downside, initial support comes from the 50-day EMA around $80,873, with the 100-day EMA near $77,458 and the 200-day EMA near $76,138 forming a deeper demand zone that would need to fail to undermine the prevailing bullish structure materially.
(The technical analysis of this story was written with the help of an AI tool. Know more.)
Bitcoin, altcoins, stablecoins FAQs
Bitcoin is the largest cryptocurrency by market capitalization, a virtual currency designed to serve as money. This form of payment cannot be controlled by any one person, group, or entity, which eliminates the need for third-party participation during financial transactions.
Altcoins are any cryptocurrency apart from Bitcoin, but some also regard Ethereum as a non-altcoin because it is from these two cryptocurrencies that forking happens. If this is true, then Litecoin is the first altcoin, forked from the Bitcoin protocol and, therefore, an “improved” version of it.
Stablecoins are cryptocurrencies designed to have a stable price, with their value backed by a reserve of the asset it represents. To achieve this, the value of any one stablecoin is pegged to a commodity or financial instrument, such as the US Dollar (USD), with its supply regulated by an algorithm or demand. The main goal of stablecoins is to provide an on/off-ramp for investors willing to trade and invest in cryptocurrencies. Stablecoins also allow investors to store value since cryptocurrencies, in general, are subject to volatility.
Bitcoin dominance is the ratio of Bitcoin's market capitalization to the total market capitalization of all cryptocurrencies combined. It provides a clear picture of Bitcoin’s interest among investors. A high BTC dominance typically happens before and during a bull run, in which investors resort to investing in relatively stable and high market capitalization cryptocurrency like Bitcoin. A drop in BTC dominance usually means that investors are moving their capital and/or profits to altcoins in a quest for higher returns, which usually triggers an explosion of altcoin rallies.
Recommended Articles


