

NEAR Protocol Price Forecast: Mild correction persists despite resilient ETF inflows

Source Fxstreet
  • NEAR edges below $5 on Tuesday, extending its near-term pullback capped by its 50-period EMA at $5.0182.
  • Bitwise’s NEAR-focused ETF recorded over $5 million in inflows on Monday, following last week’s total of more than $11 million.
  • The technical outlook for NEAR suggests a near-term downside bias, with bears eyeing the 200-period EMA at $4.5514.

NEAR Protocol (NEAR) price is down nearly 2% on Tuesday, mirroring its 2% decline from the previous day. Institutional demand remains firm, with Bitwise’s NEAR-focused Exchange Traded Fund (ETF) recording over $5 million in inflows on Monday. The technical outlook for NEAR suggests a mild correction in the broader upward trend, with bears targeting the 200-period Exponential Moving Average (EMA) at $4.5514.

Consistent ETF inflows back NEAR token’s long-term upside

NEAR Protocol retains firm institutional demand. SoSoValue data shows Bitwise’s spot NEAR-focused ETF (NRR) recorded $5.42 million in inflows on Monday, following three consecutive weeks of inflows totaling over $80 million. This reflects consistent buying pressure on the NRR ETF, likely driven by NEAR Protocol’s network growth, expansion into tokenized assets, and privacy features.
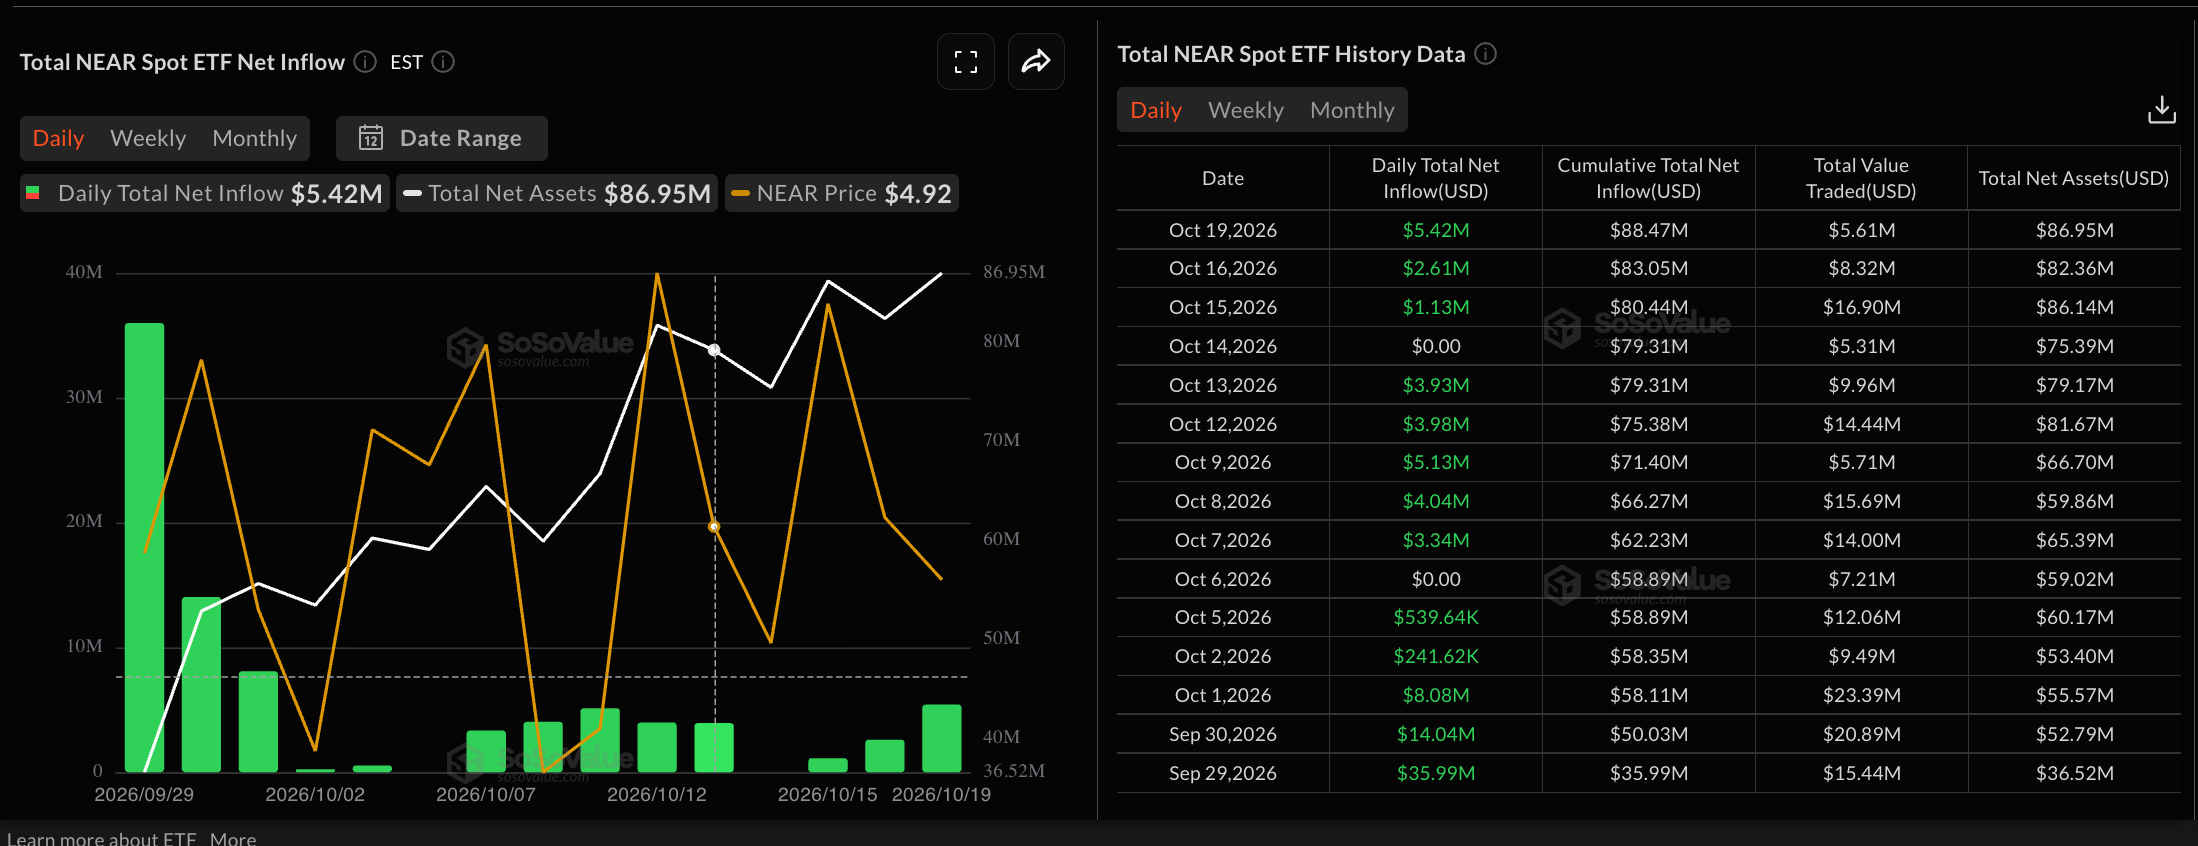
NEAR ETFs data. Source: Sosovalue

According to NEAR Protocol’s Q3 2026 report released on Monday, NEAR Intents, a multichain transaction pool, recorded over $32 billion in cumulative volume, up 45% from the previous quarter, with over $8 million in fees directed toward token buybacks. At the same time, the Total Value Locked (TVL) in NEAR’s privacy-focused Confidential Intents reached approximately $160 million, up roughly 463%.
https://x.com/NEARProtocol/status/2112225472071311506

Technical outlook: Will NEAR price resurface above $5?

NEAR Protocol trades at $4.8160 on Tuesday, maintaining a bearish near-term bias. On the four-hour chart, the NEAR token is capped below the 50-period EMA at $5.0179 and the descending trendline at $5.0261, while remaining above the 200-period EMA at $4.5513. This configuration suggests the token is capped by an overhead compact supply zone that bulls would need to reclaim to shift the short-term tone.

A confirmed breakout above the declining trendline at $5.0261 could reinstate NEAR's constructive tone, opening the path toward the September 28 high at $5.5780, followed by the $6.0000 round figure.

The Relative Strength Index (RSI) is at 43 in the neutral-to-soft territory on the four-hour chart, while the Moving Average Convergence Divergence (MACD) crosses marginally below its signal line, hinting at waning upside pressure.

Looking down, the 200-period EMA at $4.5513 emerges as the immediate support level, reinforced by the $4.4440 horizontal level, which capped losses on October 8. A sustained correction below this zone could indicate a clear bearish trend reversal, potentially targeting the September 19 high at $3.9140.

Chart Analysis NEAR/USDT (Binance)
NEAR/USDT four-hour price chart.

(The technical analysis of this story was written with the help of an AI tool. Know more.)

Disclaimer: For information purposes only. Past performance is not indicative of future results.
placeholder
Gold Price Analysis Today | Forex Gold Analysis | XAU/USD Analysis - October 19, 2026Get the latest gold price analysis, forex gold insights, and XAU/USD analysis for October 19, 2026. Read on for the details.
Author  Mitrade
Yesterday 02: 11
Get the latest gold price analysis, forex gold insights, and XAU/USD analysis for October 19, 2026. Read on for the details.
placeholder
Gold retests $4,200 as dollar and yields retreat — can bullion clear its hardest level?Spot gold traded near $4,175 on Monday (+0.23%), with an intraday high of $4,187.71 after last week's $4,073 ~ $4,217 range; COMEX futures briefly topped $4,200. The dollar slipped to 101.76 and 10-year yields eased from their highs, but October Fed hike odds near 52% and BofA's sub-$4,000 call still cap the upside. Here are the drivers, the levels and what would flip the script.
Author  Irene Q.
Yesterday 06: 25
Spot gold traded near $4,175 on Monday (+0.23%), with an intraday high of $4,187.71 after last week's $4,073 ~ $4,217 range; COMEX futures briefly topped $4,200. The dollar slipped to 101.76 and 10-year yields eased from their highs, but October Fed hike odds near 52% and BofA's sub-$4,000 call still cap the upside. Here are the drivers, the levels and what would flip the script.
placeholder
Brent slips from $110 as Russian supply prospects return — is the five-month rally over?Brent crude traded near $108.06 on Monday (-1.71%), pulling back from last week's $110 high after Washington moved to ease restrictions on Russian oil flows. WTI hovered around $101 before dipping below $99. The retreat is real, but so is the supply-risk premium: Hormuz shipping disruptions, attacks on Saudi energy infrastructure and strikes on Russian refineries remain live. Here are the three numbers, the transmission chain and the levels that matter.
Author  Irene Q.
Yesterday 06: 30
Brent crude traded near $108.06 on Monday (-1.71%), pulling back from last week's $110 high after Washington moved to ease restrictions on Russian oil flows. WTI hovered around $101 before dipping below $99. The retreat is real, but so is the supply-risk premium: Hormuz shipping disruptions, attacks on Saudi energy infrastructure and strikes on Russian refineries remain live. Here are the three numbers, the transmission chain and the levels that matter.
placeholder
Gold Price Analysis Today | Forex Gold Analysis | XAU/USD Analysis - October 20, 2026Get the latest gold price analysis, forex gold insights, and XAU/USD analysis for October 20, 2026. Read on for the details.
Author  Mitrade
5 hours ago
Get the latest gold price analysis, forex gold insights, and XAU/USD analysis for October 20, 2026. Read on for the details.
placeholder
Dollar presses 102 as the 10-year yield sits at 5.14% — and October hike odds are only 17%The dollar index closed at 101.99 (+0.20%) on Monday after briefly topping 102.07, while the 10-year Treasury yield rose to 5.14% and the 2-year hit 4.774% — yet futures price only about a 17% chance of a hike at the October 27-28 FOMC, versus roughly 90% for December. The driver is a global bond selloff, not a Fed repricing: France's 10-year OAT jumped to 4.84% ~ 4.94% and the OAT-Bund spread widened to 140 ~ 146bp. Here are the levels, the cross-asset read-through and what to watch.
Author  Irene Q.
2 hours ago
The dollar index closed at 101.99 (+0.20%) on Monday after briefly topping 102.07, while the 10-year Treasury yield rose to 5.14% and the 2-year hit 4.774% — yet futures price only about a 17% chance of a hike at the October 27-28 FOMC, versus roughly 90% for December. The driver is a global bond selloff, not a Fed repricing: France's 10-year OAT jumped to 4.84% ~ 4.94% and the OAT-Bund spread widened to 140 ~ 146bp. Here are the levels, the cross-asset read-through and what to watch.
goTop
quote