

Quant Price Forecast: QNT price rally hits annual high on securing US tokenized deposit settlements

Source Fxstreet
  • Quant price is up 4% on Friday, trading at YTD highs of around $94 after a 27% rally the previous day.
  • Quant partners with The Clearing House as an interoperability layer to handle tokenized deposits across 25 major US banks.
  • The technical outlook for QNT is bullish, with the price inching closer to the $100 psychological barrier.

Quant (QNT) emerges as the best-performing crypto asset over the last 24 hours, with nearly 30% gains following its partnership to handle tokenized deposits across US financial institutions. The technical outlook for Quant indicates a strong rally likely to reclaim the $100 milestone.

Quant partners with The Clearing House to handle US tokenized deposits

Quant announced a major partnership to serve as an interoperability layer with The Clearing House, the core payments system in the US, which handles over $2 trillion in daily transactions. The announcement positions Quant at the center of the US government’s push for tokenized Real-World Assets (RWA). 

Quant will supply interoperability, orchestration, and a transaction layer for clearing and settling tokenized deposits across 25 major US banks. The network is likely to launch in the first half of 2027 and establish payment networks for tokenized deposits.
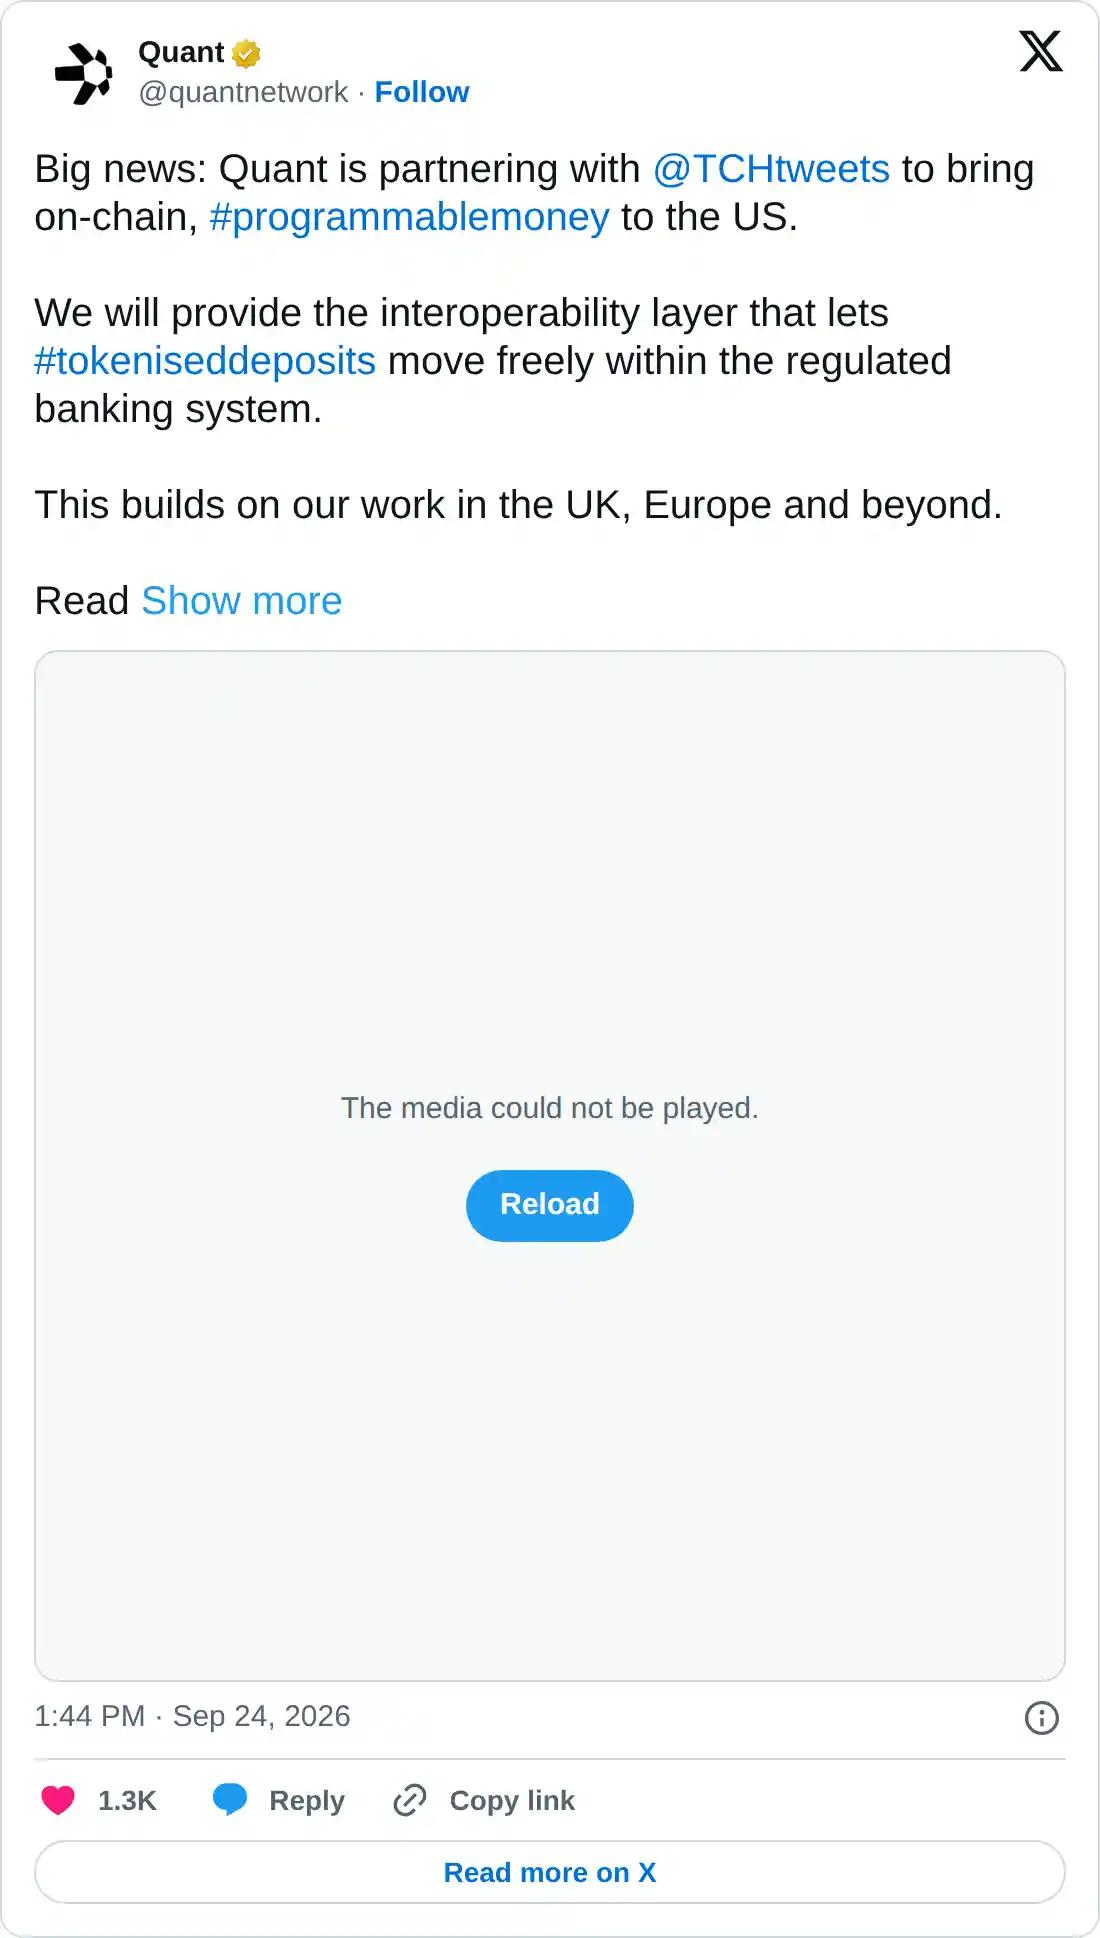
https://x.com/quantnetwork/status/2103118263227912693

Technical outlook: More bullish fuel left in Quant’s tank

Quant trades around $95.56 at press time on Friday, extending its 27% rally from the previous day. QNT price sits well above the 50-, 100-, and 200-day Exponential Moving Averages (EMAs) at $66.29, $65.91, and $68.42, suggesting a firmly supported uptrend

From a technical perspective, QNT extends the bullish breakout rally of a long-term resistance trendline, connecting the July 23, 2025, and May 16 highs, near $70.00. The rally now tests the 127.2% Fibonacci extension level, measured over the previous downswing from $85.00 to $55.28, at $95.55. A confirmed breakout could target the 161.8% extension level at $110.89.

Momentum is stretched on the daily chart, with the Relative Strength Index (RSI) at 81 in overbought territory and the Moving Average Convergence Divergence (MACD) line firmly above its signal line, suggesting buyers are in control.

Chart Analysis QNT/USDT (Binance)
QNT/USDT daily price chart.

On the downside, initial support appears at the 100% retracement at $85.00, before a deeper corrective move could target a dense cluster formed by the 78.60% level at $77.52.

(The technical analysis of this story was written with the help of an AI tool. Know more.)

Disclaimer: For information purposes only. Past performance is not indicative of future results.
placeholder
Dollar holds above 100 near a 3-month high — three Fed speakers and a $69 billion auction land tonightThe dollar index closed at 100.43 on Monday, its highest close since late July, after a weekly gain of about 1% — the best in more than three months — and is holding above the 100.00 handle in Asia. Three Fed officials speak tonight alongside a $69 billion two-year note auction, the first leg of $183 billion of Treasury supply this week.
Author  Suzie
Sep 22, Tue
The dollar index closed at 100.43 on Monday, its highest close since late July, after a weekly gain of about 1% — the best in more than three months — and is holding above the 100.00 handle in Asia. Three Fed officials speak tonight alongside a $69 billion two-year note auction, the first leg of $183 billion of Treasury supply this week.
placeholder
October hike odds climb toward 60% as Goldman and BofA both flip — what Warsh's "dose of accommodation" really changedRate futures now price roughly 55% to 62% for a 25bp hike at the October 27-28 FOMC, up from about 30% before Chair Warsh's post-meeting framing that the Fed is merely "removing some accommodation." Goldman Sachs has added an October hike to its forecast and Bank of America now sees moves in both October and December. Here is the repricing, the language behind it, and the two data points that decide it.
Author  Irene Q.
Sep 23, Wed
Rate futures now price roughly 55% to 62% for a 25bp hike at the October 27-28 FOMC, up from about 30% before Chair Warsh's post-meeting framing that the Fed is merely "removing some accommodation." Goldman Sachs has added an October hike to its forecast and Bank of America now sees moves in both October and December. Here is the repricing, the language behind it, and the two data points that decide it.
placeholder
Memory chips surge, Nasdaq notches a second straight record close — why the Dow fell 185 points anywayMicron gained 5%, SanDisk 6.8%, Seagate 4% and Western Digital 3% as the memory complex led the Nasdaq Composite to a second consecutive record close of 27,244.28. But the Dow fell 185 points as JPMorgan, Wells Fargo and Schwab slid more than 3% each — a split tape that says more about positioning than about the economy.
Author  Irene Q.
Sep 23, Wed
Micron gained 5%, SanDisk 6.8%, Seagate 4% and Western Digital 3% as the memory complex led the Nasdaq Composite to a second consecutive record close of 27,244.28. But the Dow fell 185 points as JPMorgan, Wells Fargo and Schwab slid more than 3% each — a split tape that says more about positioning than about the economy.
placeholder
Gold Price Forecast: XAU/USD drifts toward $4.300 with bears gaining tractionGold (XAU/USD) retraces Tuesday’s gains on Wednesday and drifts lower, approaching the $4,300 area as the US Dollar Index (DXY) rallies further amid high US Treasury yields.
Author  FXStreet
Sep 23, Wed
Gold (XAU/USD) retraces Tuesday’s gains on Wednesday and drifts lower, approaching the $4,300 area as the US Dollar Index (DXY) rallies further amid high US Treasury yields.
placeholder
US input costs rose at the fastest pace in four years — the September flash PMI beat is an inflation story, not a growth storyUS September flash PMIs came in far above expectations, with the composite at 58.4, a five-year high. But the detail that moved markets was input cost inflation at its fastest since October 2022, driven by fuel, transport and supply shortages. Brent is back above $100 and the 10-year Treasury yield has hit its highest since 2007.
Author  Suzie
Yesterday 06: 46
US September flash PMIs came in far above expectations, with the composite at 58.4, a five-year high. But the detail that moved markets was input cost inflation at its fastest since October 2022, driven by fuel, transport and supply shortages. Brent is back above $100 and the 10-year Treasury yield has hit its highest since 2007.
goTop
quote