


Top Altcoins Price Forecast: Ripple, Cardano, Solana – ETF inflows, whale demand signal further rally
- Ripple ticks higher above $1.54 on Friday following a 2% rebound the previous day.
- Cardano holds steady around $0.2500, testing the bullish breakout of a rising channel pattern and a key retracement level.
- Solana hovers around $118, sustaining the bullish flag breakout rally from last week.
Ripple (XRP), Cardano (ADA), and Solana (SOL) continue to experience a steady recovery with double-digit gains so far this month. Ripple and Solana experience firm institutional demand, while the percentage of ADA supply in profit rises, underpinned by interest from large-wallet investors, commonly referred to as whales. The technical outlook for XRP, ADA, and SOL indicates an upside bias as momentum holds firm.
ETF inflows and whale demand fuel altcoins' rally
Ripple- and Solana-focused exchange-traded funds (ETFs) recorded $14.89 million and $32.81 million in inflows on Thursday. This marks the third consecutive day of inflows into XRP ETFs and the fifth consecutive day of inflows into SOL ETFs. The positive institutional inflows suggest strong demand for altcoins, indicating firm long-term potential.
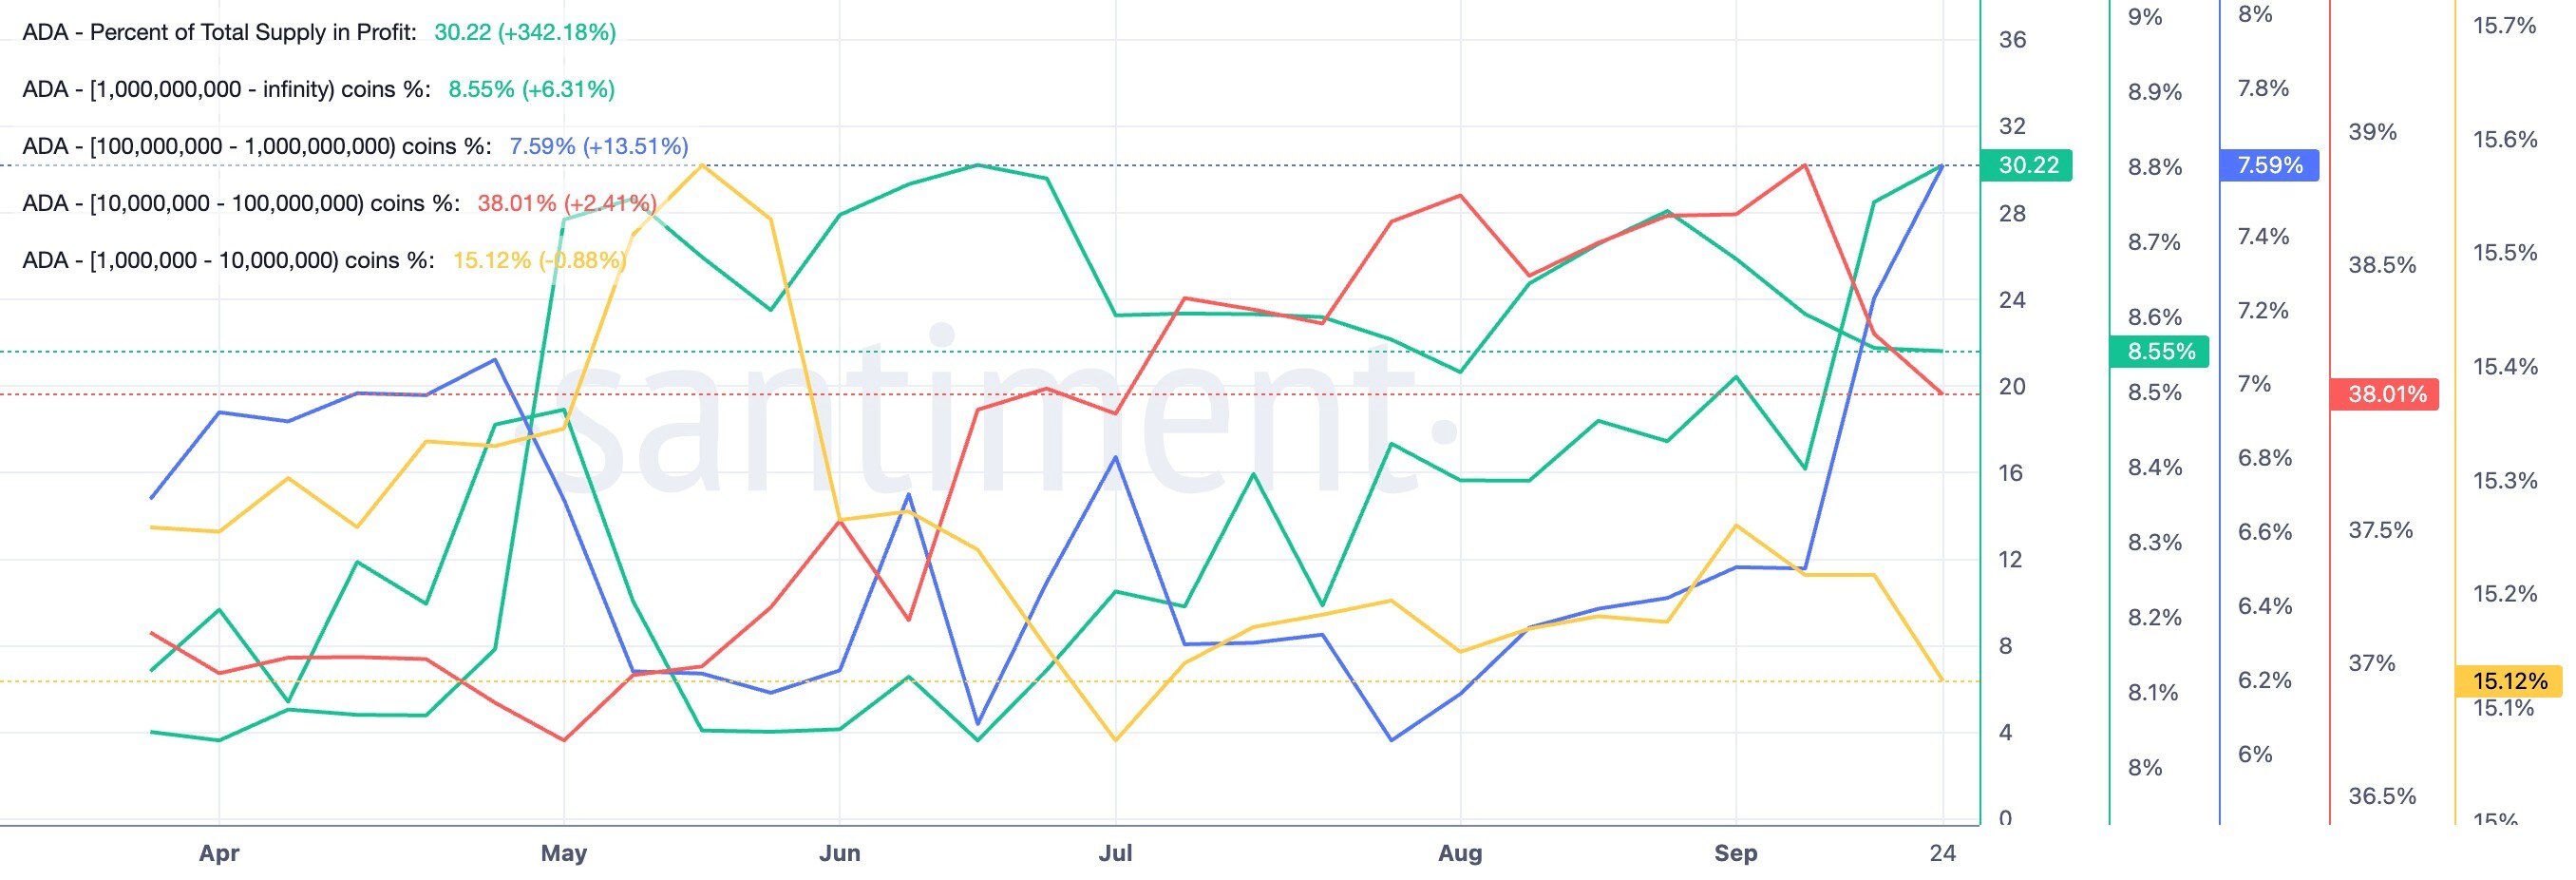
On the other hand, Cardano is gaining whale demand. Santiment data shows a steady rise in the percentage of ADA supply in profit to 30.22%, up from 16.88% over the last two weeks. Meanwhile, holders with 100 million to 1 billion ADA tokens now account for 7.59% of the total supply, up from 6.5% over the same period.

Ripple takes a rebound above $1.50
Ripple trades above $1.55 at press time on Friday, maintaining a constructive near-term bias. The cross-border remittance token stays clearly above the 50-, 100- and 200-period Exponential Moving Averages (EMAs) on the four-hour chart, which fan out positively, hinting at an intact uptrend structure.
Momentum is moderately supportive on the same chart, with the Relative Strength Index (RSI) hovering just under 60, while the Moving Average Convergence Divergence (MACD) remains marginally below zero, suggesting the latest advance is slowing but not yet reversing.
The price holds steady above the 78.6% Fibonacci retracement, measured from $0.9888 to $1.6999, at $1.5137, opening the path toward the $.16999 swing high.
On the downside, the first sign of weakness would be a slip back toward the 78.6% Fibonacci retracement at $1.5137, with the 50-period EMA at $1.4695 reinforcing deeper support if sellers gain traction.
Solana poised for further rally
Solana trades around $118 on Friday, following a roughly 2% rebound the previous day. The altcoin holds significantly above the 50-, 100-, and 200-day EMAs at $99.27, $92.22, and $93.93, respectively, underpinning a constructive bullish bias.
From a technical perspective, the price is extending a breakout rally from a bullish flag pattern, marked by the 10% rally on September 18. To further extend the rally, Solana must confirm a bullish breakout of the December 18 low at $116.88, which could open the path toward the January 6 high at $148.74.
Momentum aligns with this stance, as the MACD remains above its signal line in positive territory, with a mildly positive histogram, while the RSI at 66 suggests firm bullish momentum without yet signaling extreme overbought conditions.
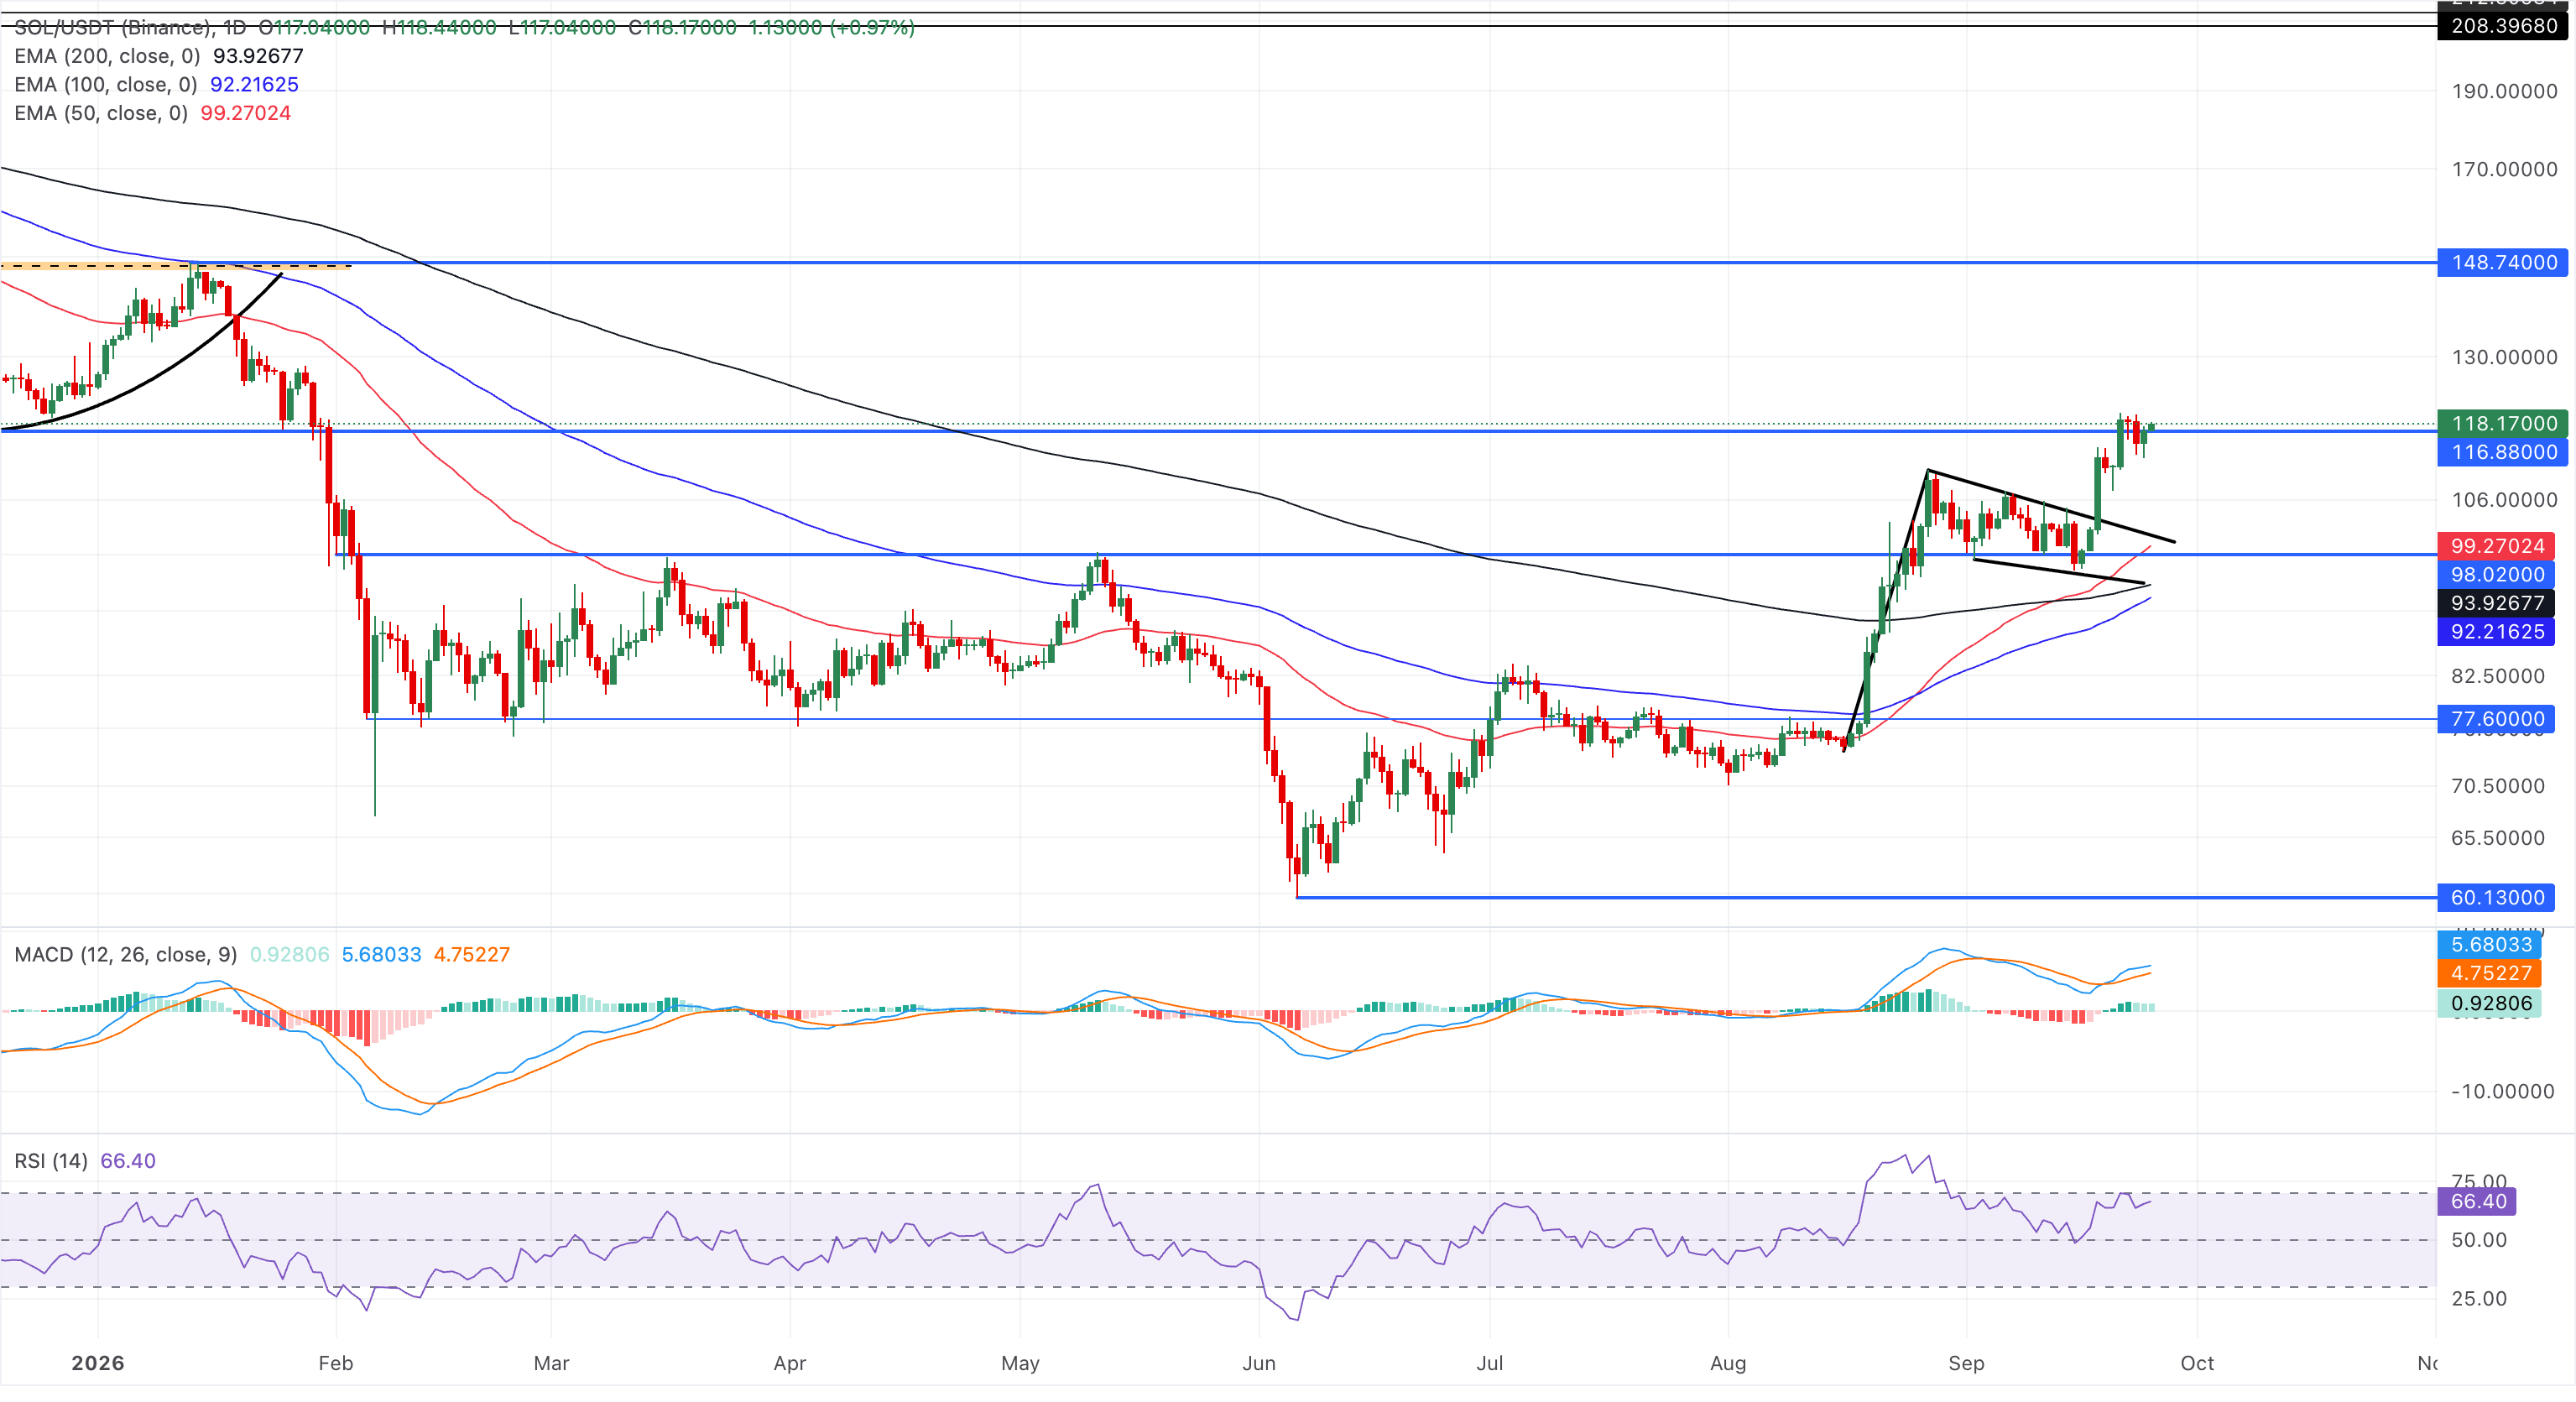
On the flip side, crucial support for Solana emerges at the broken trendline near the $100 psychological level, with the 50-day EMA at $99.21 reinforcing it.
Cardano eyes rising channel breakout rally
Cardano hovers around $0.2500 at press time on Friday, following a 4% rebound the previous day. The ADA token tests an overhead resistance trendline of the rising channel pattern, reinforced by the 78.6% Fibonacci retracement level at $0.2632, measured from $0.3136 to $0.1385.
A confirmed breakout above this resistance cluster could target the $0.3136 swing high, with upside toward the 1.272 Fibonacci extension level at $0.3916.
Momentum gauges back the constructive tone, with the RSI near 65 and the MACD in positive territory with a positive histogram, suggesting buyers retain control, albeit with conditions edging towards overbought.
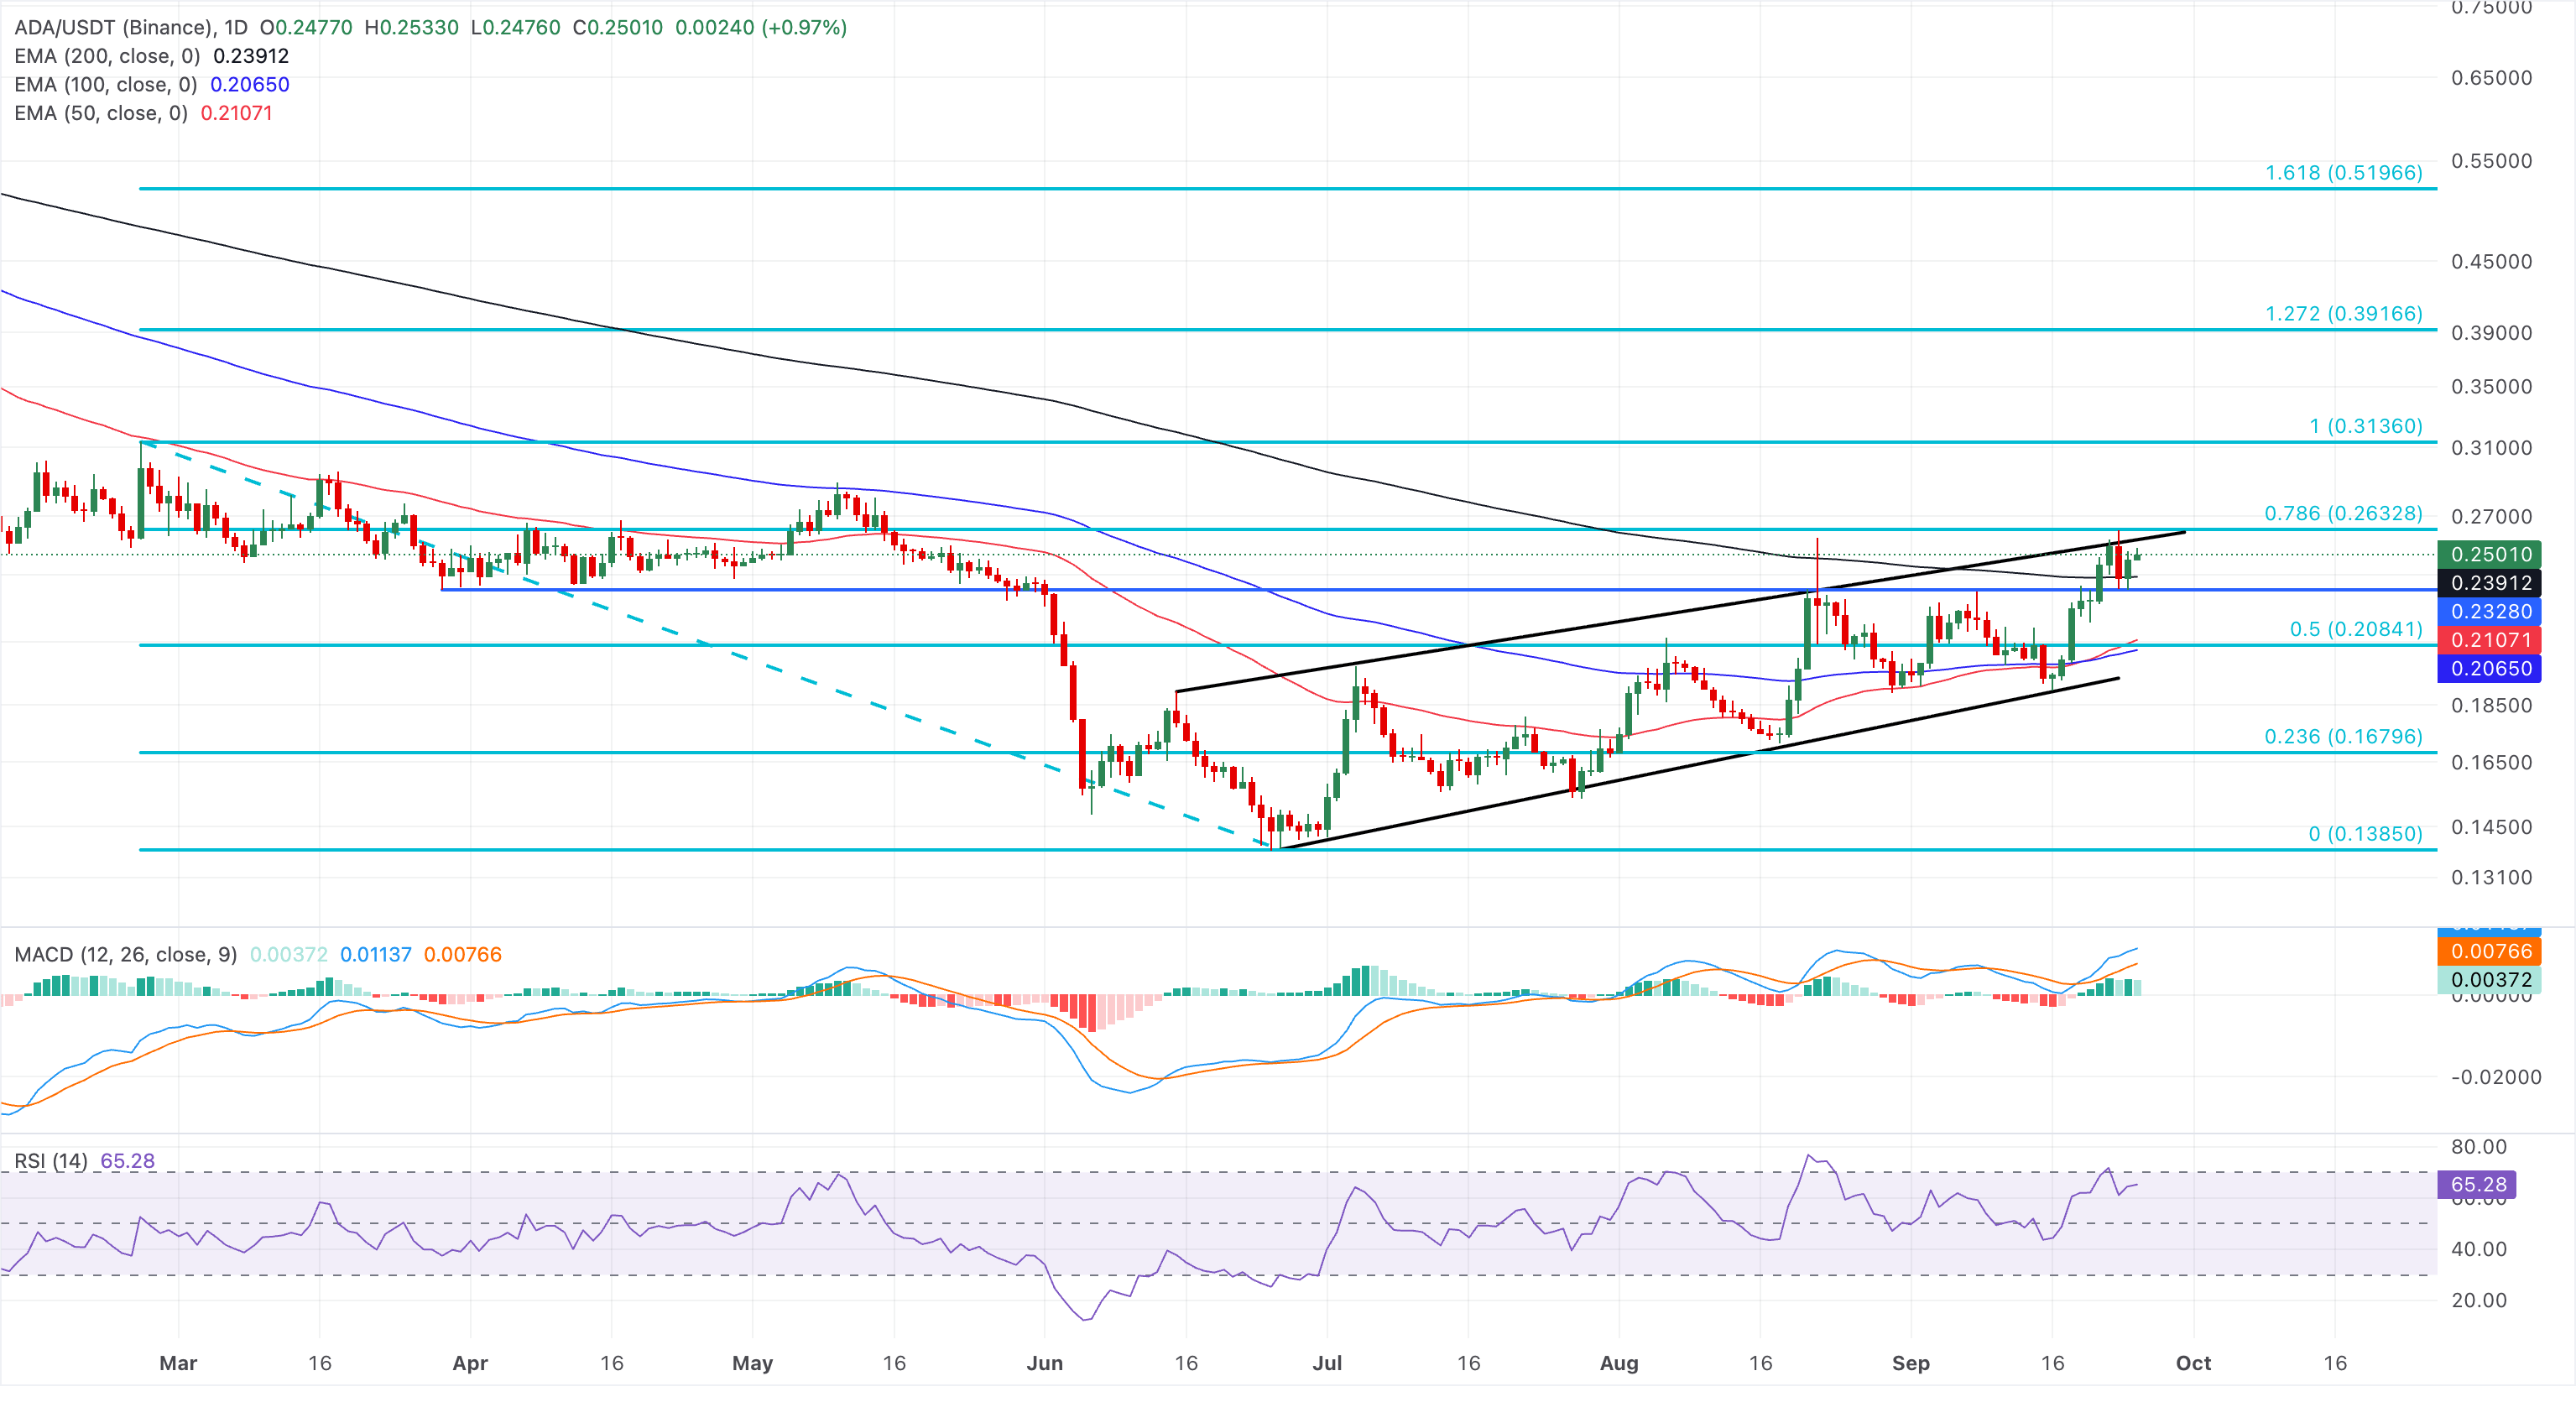
On the flip side, the 200-day EMA at $0.2420 and the March 29 low at $0.2328 serve as the immediate support level, guarding the downside to the 50% retracement level at $0.2841, reinforced by the 50- and 100-day EMAs at $0.2106 and $0.2066, respectively.
(The technical analysis of this story was written with the help of an AI tool. Know more.)
Recommended Articles


