


Bitcoin Price Forecast: BTC range trade hints at looming volatility burst, analysts say
- Bitcoin trades slightly higher at $63,500 on Monday following a 3.08% drop last week.
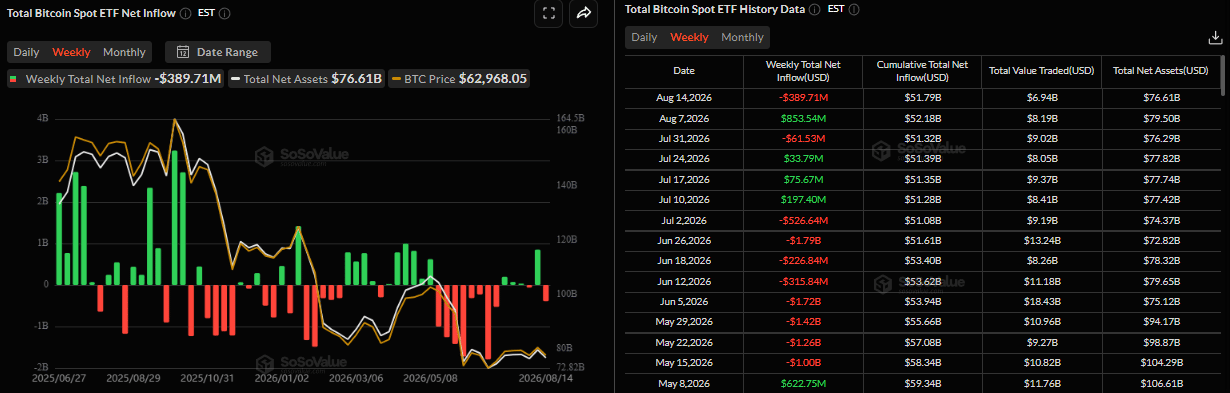
- US-listed spot BTC ETF recorded an outflow of $390 million last week, signaling cautious institutional sentiment.
- BTC’s tight trading range and subdued volatility suggest a potential volatility expansion ahead, analysts say.
Bitcoin (BTC) trades slightly higher around $63,500 on Monday, following a slight correction the previous week, supported by improving risk sentiment and despite mild outflows from institutional demand. The largest cryptocurrency by market capitalization has traded broadly sideways since mid-July, with a tight range and subdued volatility that, according to analysts, could end soon.
Institutional demand shows cautious signs
Institutional demand showed cautiousness last week. SoSoValue data shows that spot BTC ETFs recorded an outflow of $389.71 million last week. If this trend continues and intensifies this week, BTC could see further correction.
BTC risks a volatility surge as trading range tightens
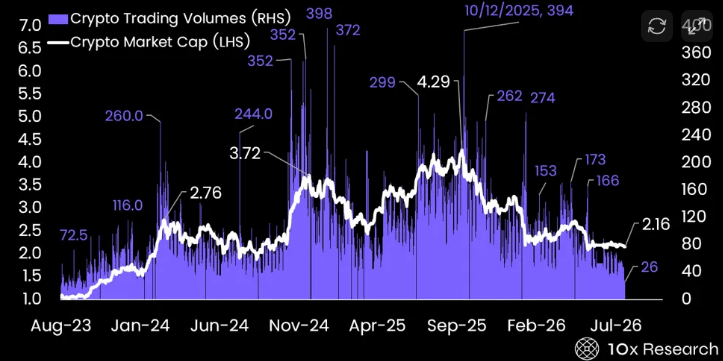
The 10x Research report on Monday highlights that trading volumes have fallen sharply from their post-inauguration and October flash-crash peaks. Meanwhile, Bitcoin is now coiled in its tightest range in months, “a setup that historically doesn’t last long,” says the analyst.
The analyst further explains that options flows point to shifting market conviction, with implied volatility falling to historically subdued levels despite tepid spot ETF inflows, continued stablecoin outflows, and MicroStrategy turning into a net seller for four consecutive weeks.
These factors broadly suggest that the Crypto King could be approaching a volatility expansion, with a sustained move in either direction likely to determine the next short-term trend, the report noted.
Bitcoin technical outlook: Sideways trading between $62,300 and $66,500
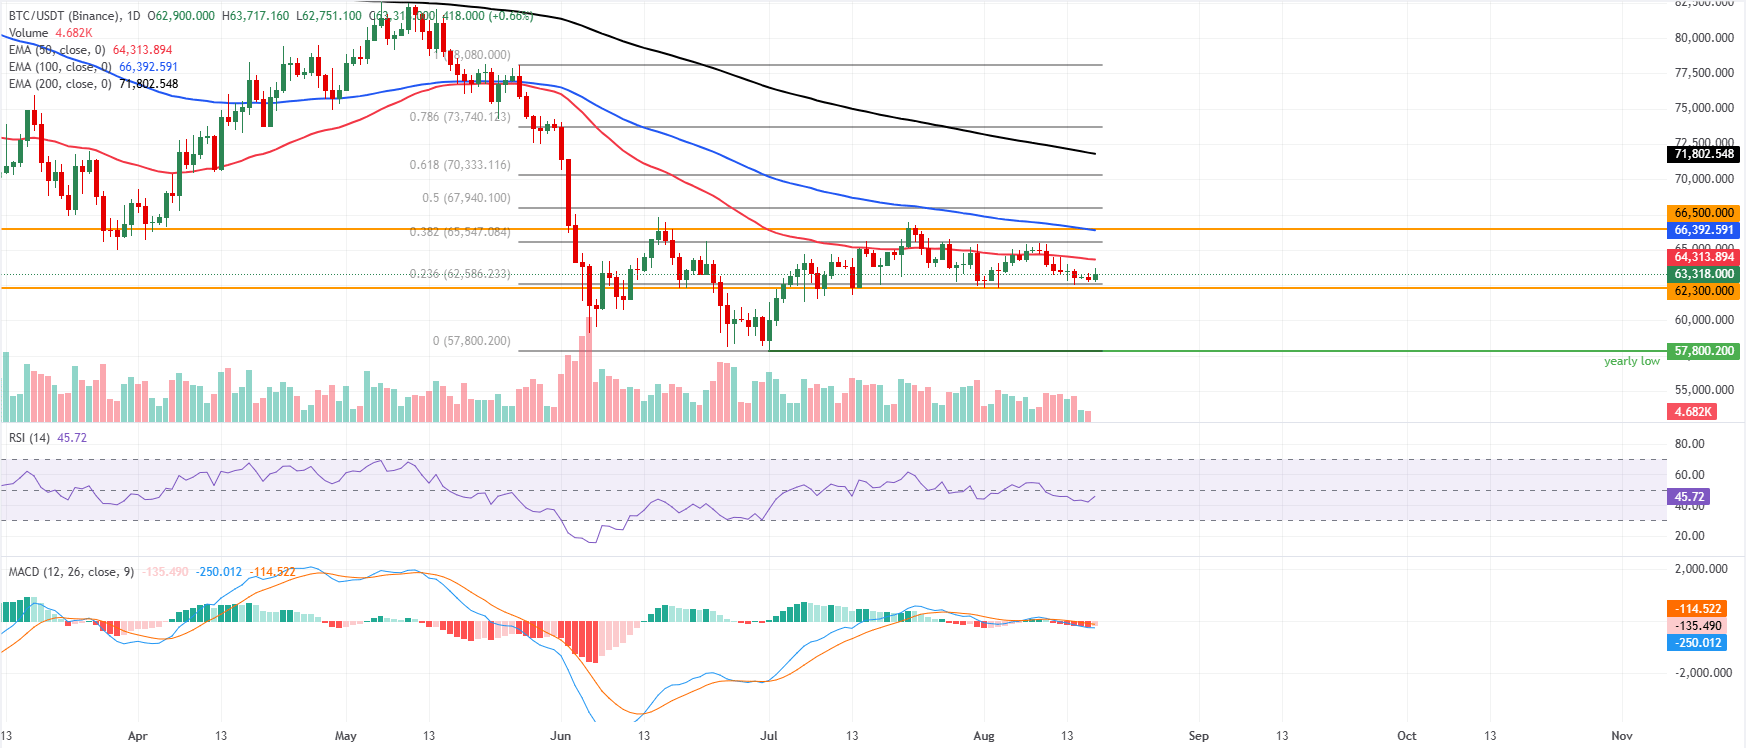
Bitcoin price shows a mild bearish bias as it remains below key Exponential Moving Averages (EMAs). The Crypto King has been in consolidation since mid-July, ranging between $62,300 and $66,500. As of Monday, BTC is trading at $63,300 after holding above the lower consolidation level of $62,300 the previous week.
Momentum remains slightly weak on the daily chart, with the Moving Average Convergence Divergence (MACD) histogram slightly negative and the Relative Strength Index (RSI) around 45. Both momentum indicators suggest sellers still control the near-term swings despite some stabilization around current levels.
On the downside, initial support is seen at the horizontal floor at $62,300, a break of which would extend losses toward the yearly low at $57,800 set on July 1.
On the topside, immediate resistance is seen at the 50-day EMA at $64,313, followed by the 100-day EMA at $66,392, which roughly coincides with the horizontal resistance at $66,500. As long as BTC trades below the 50-day EMA and the $66,392–$66,500 zone, rallies are likely to be sold, with bears retaining control unless daily closes reclaim the 50-day EMA and then the 100-day EMA, easing the current pressure.
(The technical analysis of this story was written with the help of an AI tool. Know more.)
Bitcoin, altcoins, stablecoins FAQs
Bitcoin is the largest cryptocurrency by market capitalization, a virtual currency designed to serve as money. This form of payment cannot be controlled by any one person, group, or entity, which eliminates the need for third-party participation during financial transactions.
Altcoins are any cryptocurrency apart from Bitcoin, but some also regard Ethereum as a non-altcoin because it is from these two cryptocurrencies that forking happens. If this is true, then Litecoin is the first altcoin, forked from the Bitcoin protocol and, therefore, an “improved” version of it.
Stablecoins are cryptocurrencies designed to have a stable price, with their value backed by a reserve of the asset it represents. To achieve this, the value of any one stablecoin is pegged to a commodity or financial instrument, such as the US Dollar (USD), with its supply regulated by an algorithm or demand. The main goal of stablecoins is to provide an on/off-ramp for investors willing to trade and invest in cryptocurrencies. Stablecoins also allow investors to store value since cryptocurrencies, in general, are subject to volatility.
Bitcoin dominance is the ratio of Bitcoin's market capitalization to the total market capitalization of all cryptocurrencies combined. It provides a clear picture of Bitcoin’s interest among investors. A high BTC dominance typically happens before and during a bull run, in which investors resort to investing in relatively stable and high market capitalization cryptocurrency like Bitcoin. A drop in BTC dominance usually means that investors are moving their capital and/or profits to altcoins in a quest for higher returns, which usually triggers an explosion of altcoin rallies.
Recommended Articles


