

Uniswap Price Forecast: UNI risks steeper decline as bearish signals pile up

Source Fxstreet
  • Uniswap is down nearly 6% on Wednesday, extending a 5% loss from the previous day.
  • Uniswap rolls out Continuous Clearing Auctions on Avalanche, enabling teams to run on-chain token auctions and bootstrap liquidity.
  • Data shows declining retail demand and social interest in Uniswap, pointing to risk-off sentiment among traders.

Uniswap (UNI) faces intense selling pressure, down nearly 6% on Wednesday after a 5% drop the previous day. The launch of Continuous Clearing Auctions on Avalanche enables teams to run on-chain token auctions and bootstrap liquidity, reducing friction in interoperability. Still, retail support is on a downhill with declining Open Interest and Social Dominance, implying risk-off sentiment among traders.

Uniswap retail interest flips bearish

Uniswap continues to roll out new features with Continuous Clearing Auctions on Avalanche, following the recent launch of the TradePools launchpad on Robinhood, and offering yield on USDC, USDT, or ETH deposits. The auctions will allow Avalanche developers to deploy fully on-chain token auctions and tap bootstrap liquidity on Uniswap v4. 

Despite new features, Uniswap is losing retail strength, likely linked to the risk-averse sentiment in the crypto market ahead of the US Consumer Price Index (CPI) for July, scheduled for Wednesday around 12:30 GMT. Santiment data shows Social dominance and volume dropped to 0.08% and 40 on Tuesday, from 0.19% and 152, indicating a sharp decline in retail buzz.
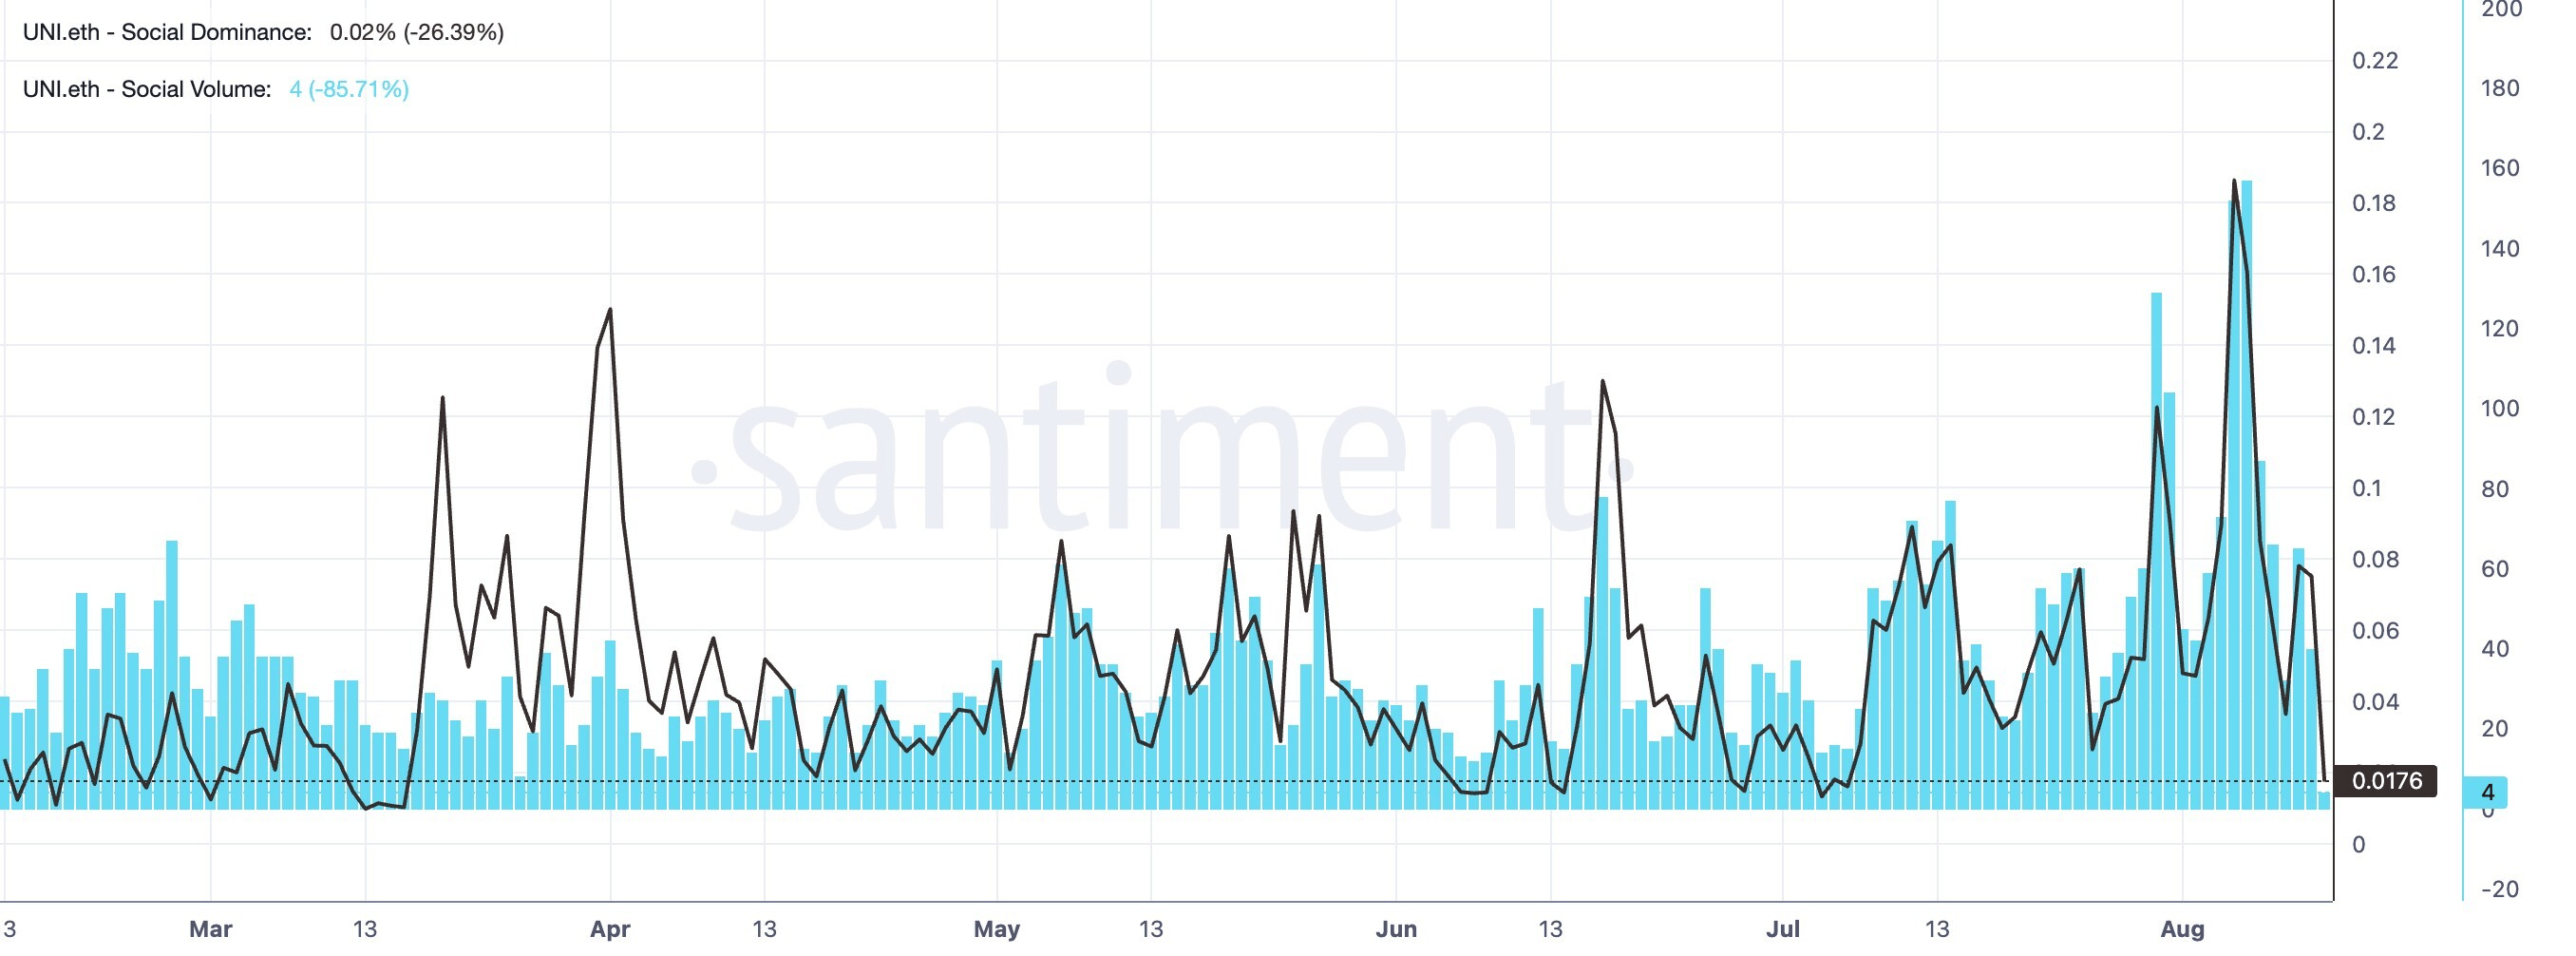
UNI social dominance chart. Source: Santiment

Corroborating with the declining retail strength, CoinGlass data shows the UNI futures Open Interest is down over 5% in the last 24 hours to $261.60 million, implying a contraction in the notional value of active contracts. Long liquidation of $2.88 million outpaced short liquidation of $1,950 in the same time period, pointing to a biased wipeout of bullish positions. Still, the OI-weighted funding rate of 0.0016%, up from -0.0054% the previous day, reflects mixed sentiment among traders.
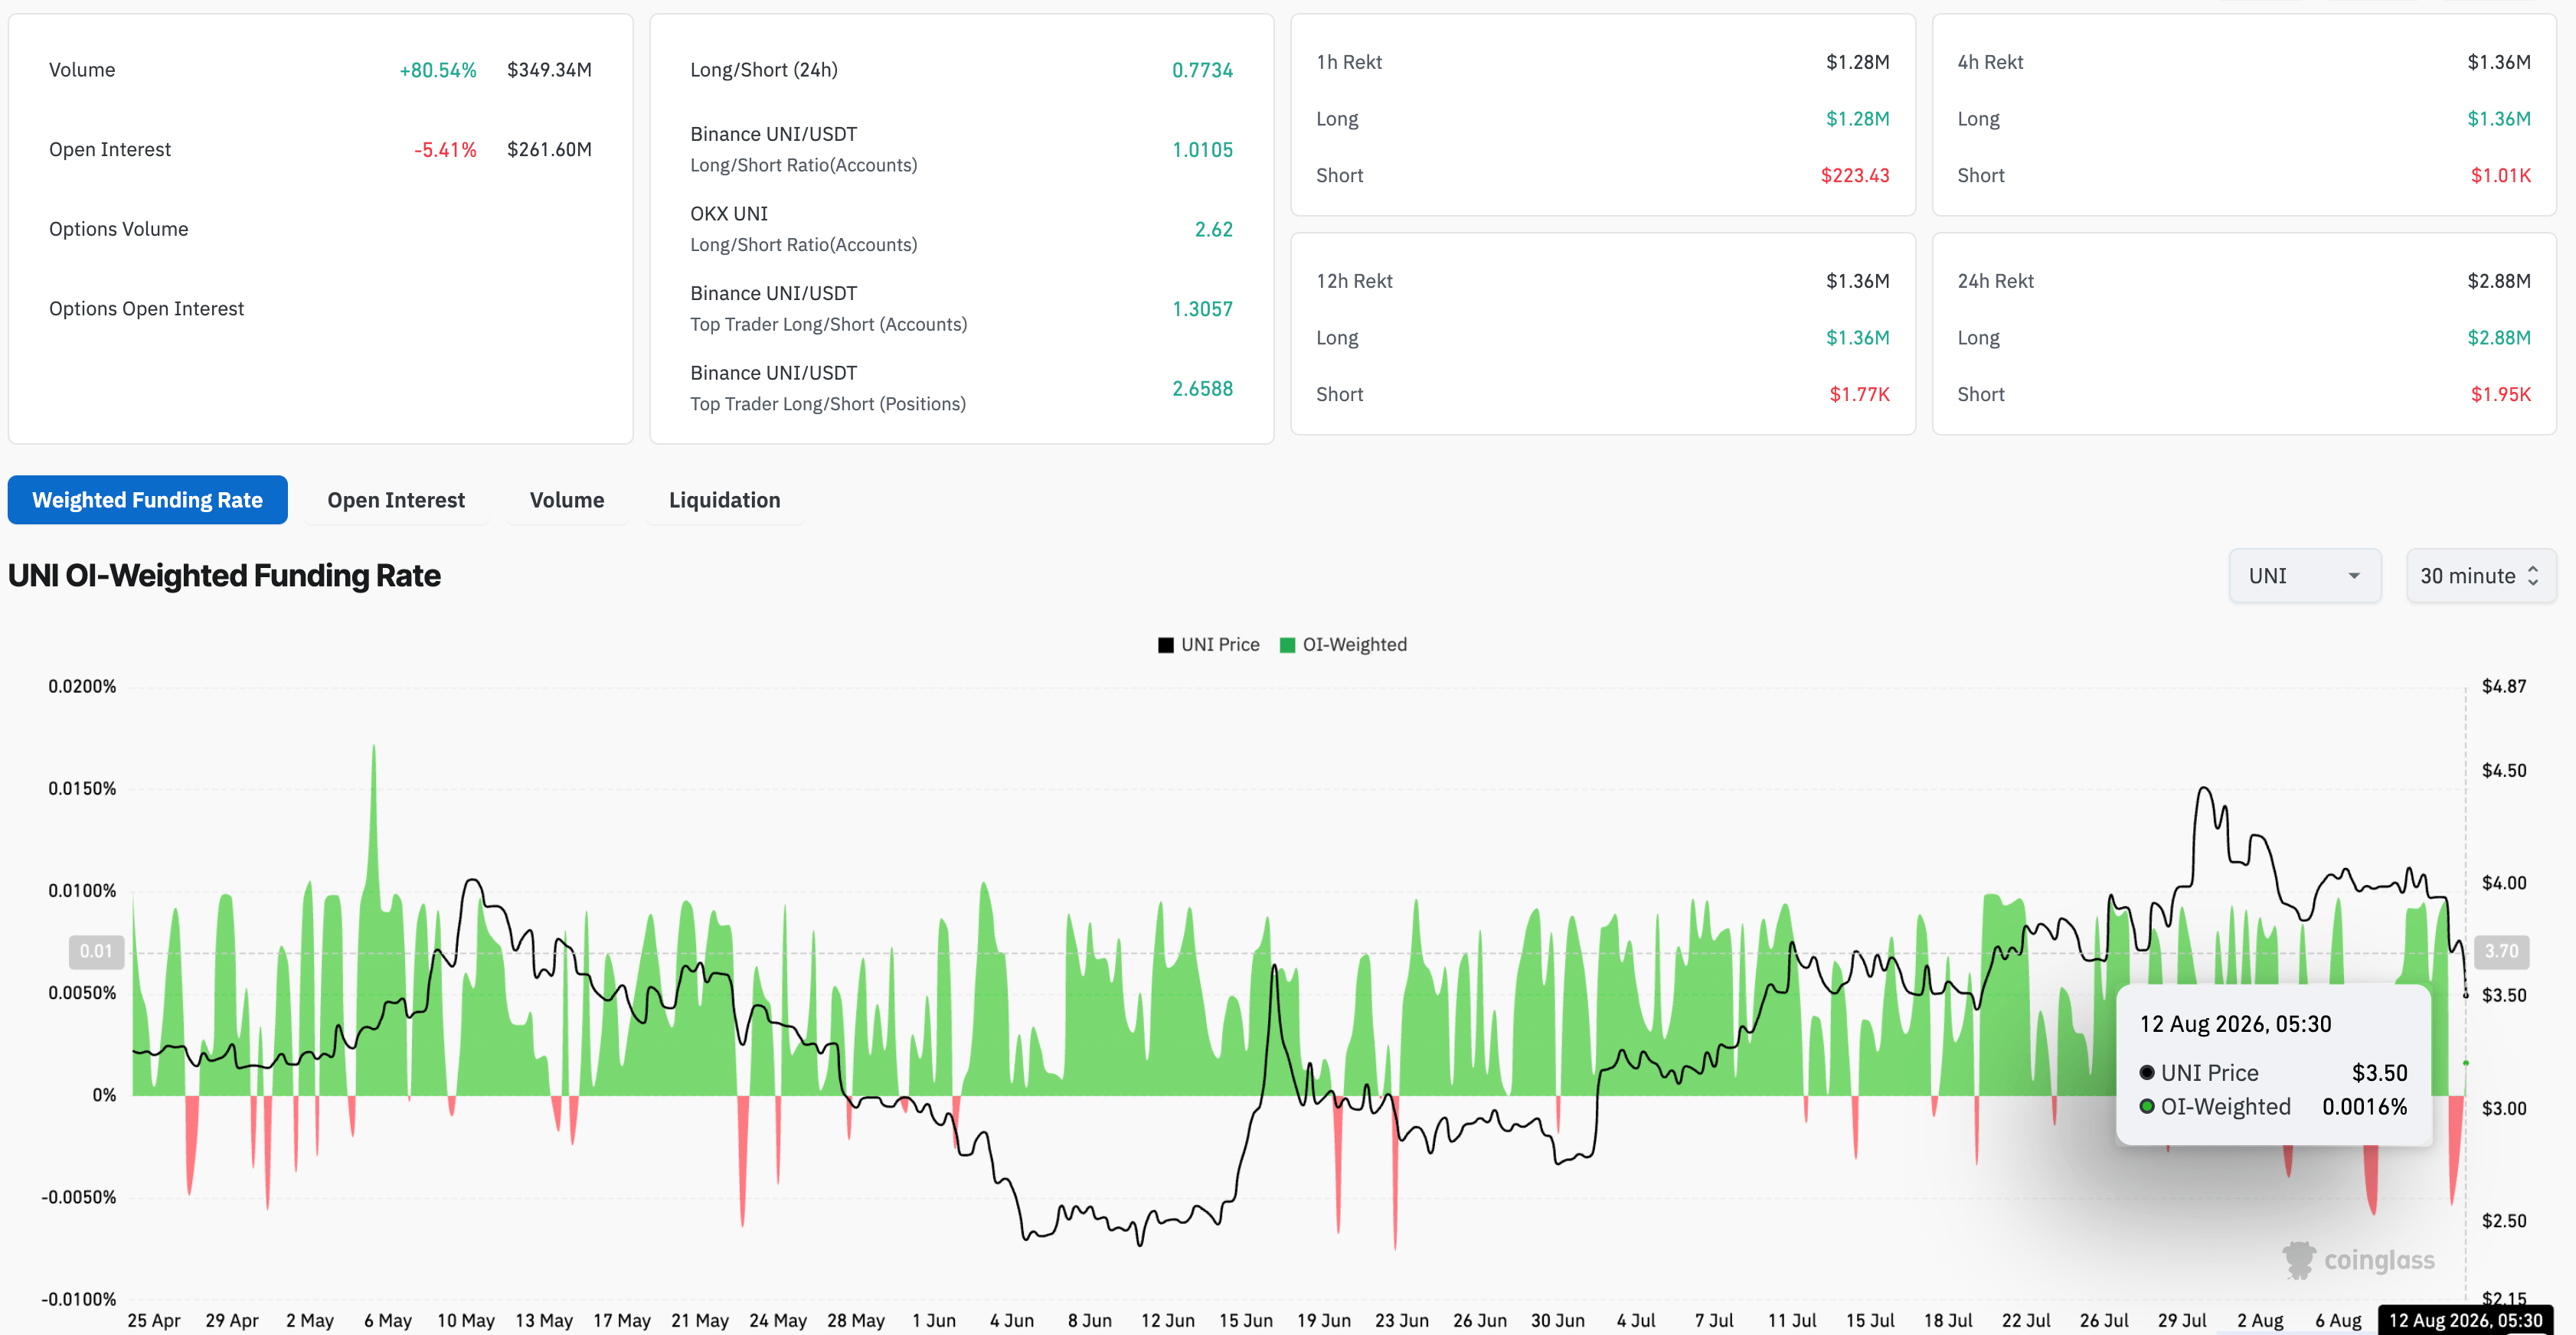
Uniswap derivatives data. Source: CoinGlass

Technical outlook: Will Uniswap lose its 100-day EMA at $3.55?

Uniswap extends losses on Wednesday, testing its 100-day Exponential Moving Average (EMA) at $3.55. UNI trades below the 50-day and 200-day EMAs at $3.65 and $3.93, respectively, which reinforces overhead supply.

Momentum aligns with this defensive tone, with the Relative Strength Index (RSI) at 40 edging toward bearish territory and the Moving Average Convergence Divergence (MACD) falling below its signal line with an expanding bearish profile, hinting at persistent downside pressure.

A decisive close below the 100-day EMA at $3.55 could target the 50% retracement, measured from $2.31 to $4.57, at $3.25.

Chart Analysis UNI/USDT (Binance)
UNI/USDT daily price chart.

On the topside, immediate resistance is defined by the 50-day EMA at $3.65, followed by the cluster of 23.6% Fibonacci retracement at $3.89 and the 200-day EMA at $3.93.

(The technical analysis of this story was written with the help of an AI tool. Know more.)

Disclaimer: For information purposes only. Past performance is not indicative of future results.
placeholder
Fed hike odds near 90% into Wednesday's decision — how to trade the dollar, gold and the S&P 500A 0.3% monthly core CPI print has lifted the market-implied probability of a 25bp Fed hike on 16 September to roughly 86.5% ~ 90%, which would be the first increase since July 2023. Here is the decision timeline, the pricing versus the forecasts, both scenarios, and the key levels for the dollar, gold and the S&P 500.
Author  Suzie
Sep 14, Mon
A 0.3% monthly core CPI print has lifted the market-implied probability of a 25bp Fed hike on 16 September to roughly 86.5% ~ 90%, which would be the first increase since July 2023. Here is the decision timeline, the pricing versus the forecasts, both scenarios, and the key levels for the dollar, gold and the S&P 500.
placeholder
Silver breaks $64 as precious metals rebound — can gold hold the $4,280 line into the Fed decision?Silver has climbed back above $64 an ounce for the first time this week, leading a broad rebound across precious metals hours before the Federal Reserve delivers what is expected to be its first rate hike since 2023. Spot silver was last at $64.64, up 1.49% on the day, while gold reclaimed $4,300 and platinum and palladium both advanced. The question now is whether the bounce is a genuine turn — or a pause before the Fed's dot plot decides the next move.
Author  Suzie
Sep 16, Wed
Silver has climbed back above $64 an ounce for the first time this week, leading a broad rebound across precious metals hours before the Federal Reserve delivers what is expected to be its first rate hike since 2023. Spot silver was last at $64.64, up 1.49% on the day, while gold reclaimed $4,300 and platinum and palladium both advanced. The question now is whether the bounce is a genuine turn — or a pause before the Fed's dot plot decides the next move.
placeholder
Bitcoin falls below $75,000 as the CLARITY Act fails in the Senate — what the vote means for cryptoThe US Senate blocked the Digital Asset Market CLARITY Act in a 49-50 procedural vote, sending Bitcoin briefly below $75,000 — its biggest one-day drop since June. Ethereum fell more than 8%, Coinbase slid 10% and $75 billion of crypto market value evaporated. Here is what the vote was, why it failed, and the levels that matter now.
Author  Suzie
Sep 16, Wed
The US Senate blocked the Digital Asset Market CLARITY Act in a 49-50 procedural vote, sending Bitcoin briefly below $75,000 — its biggest one-day drop since June. Ethereum fell more than 8%, Coinbase slid 10% and $75 billion of crypto market value evaporated. Here is what the vote was, why it failed, and the levels that matter now.
placeholder
Dow drops 631 points as the Fed hikes — but futures are rebounding: what's next for US stocks?The Dow fell 631 points and the S&P 500 closed below 7,600 after the Fed hiked rates for the first time since 2023, with the dot plot showing 16 of 18 officials expect more tightening. Asia-session futures are already recovering — here are the levels and analyst views that decide whether 7,500 holds.
Author  Irene Q.
Yesterday 02: 54
The Dow fell 631 points and the S&P 500 closed below 7,600 after the Fed hiked rates for the first time since 2023, with the dot plot showing 16 of 18 officials expect more tightening. Asia-session futures are already recovering — here are the levels and analyst views that decide whether 7,500 holds.
placeholder
Dollar index tops 100 for the first time since July as the Fed's hawkish dot plot sinks inThe U.S. dollar index broke back above 100 for the first time since 31 July after the Fed delivered its first rate hike since 2023, with the dot plot showing 16 of 18 officials expect at least one more increase this year. Here are the levels that matter for DXY, the currencies feeling it most, and what to watch next.
Author  Irene Q.
Yesterday 02: 45
The U.S. dollar index broke back above 100 for the first time since 31 July after the Fed delivered its first rate hike since 2023, with the dot plot showing 16 of 18 officials expect at least one more increase this year. Here are the levels that matter for DXY, the currencies feeling it most, and what to watch next.
Related Instrument
goTop
quote