


Ripple and Stellar outlook: XRP and XLM tumble as technical outlook deteriorates
- XRP extends its losses, trading below $1.06 on Thursday, as selling pressure intensifies.
- XLM extends its correction, posting four consecutive days of losses and falling nearly 7% so far this week.
- Bearish derivatives metrics and weakening technical structures risk deeper corrections for both altcoins.
Ripple (XRP) and Stellar (XLM) extend their declines, trading below $1.06 and $0.165, respectively, at the time of writing on Thursday as selling pressure intensifies. In addition, weakening technical structures and bearish derivatives metrics suggest the correction for both altcoins could deepen if key support levels fail to hold.
Derivatives metrics show bearish bias
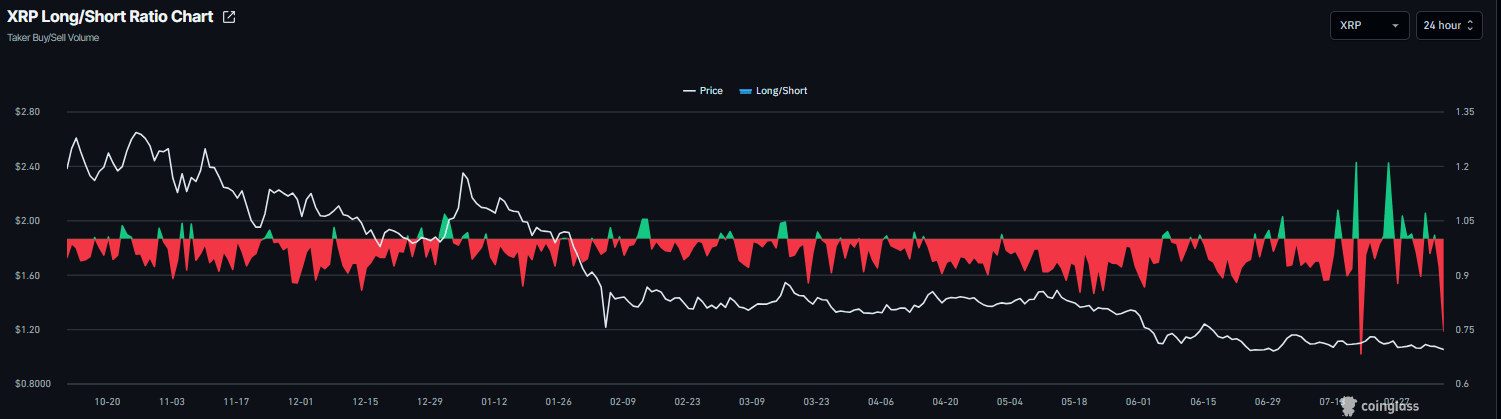
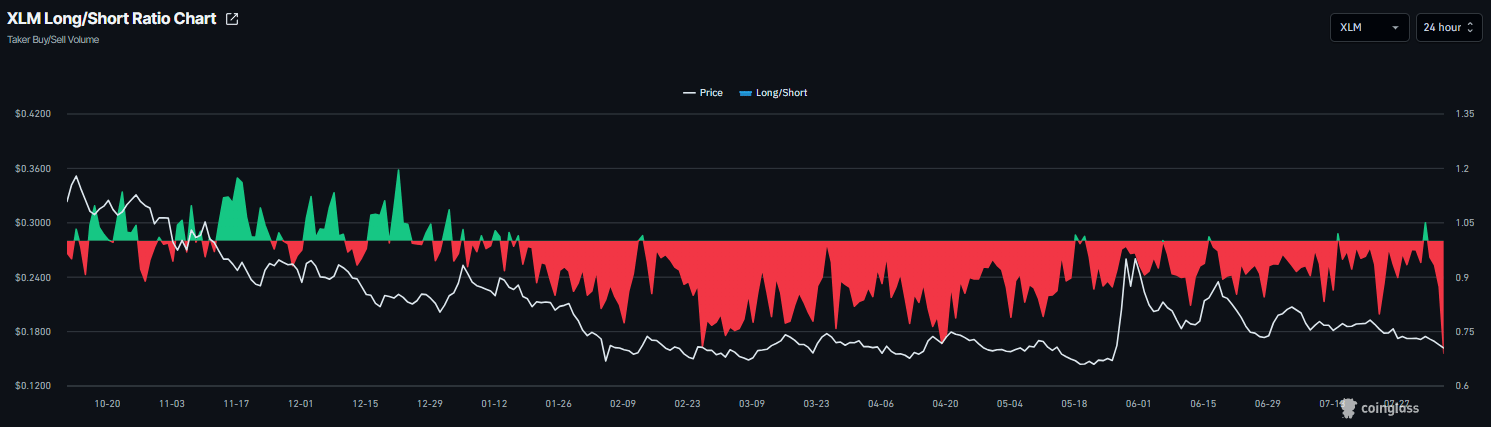
Derivatives data shows bearish bias among traders. CoinGlass’ long-to-short ratio for XRP and XLM reads 0.75 and 0.68, respectively, on Thursday, nearing the lowest level over a month. A ratio below one indicates bearish sentiment, as traders are betting the asset prices will fall.
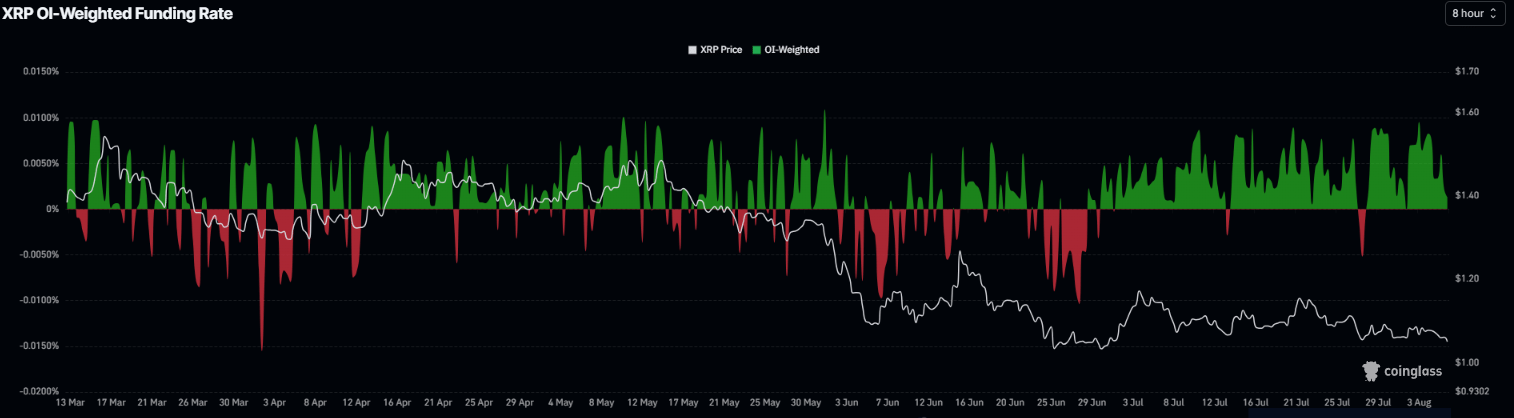
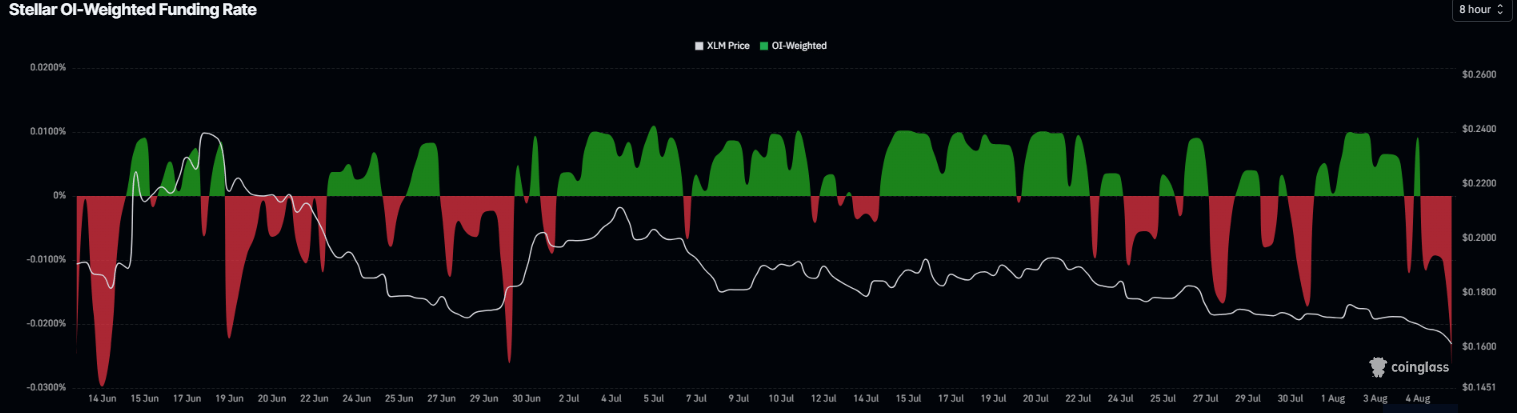
In addition, XRP funding rates dropped to 0.0013% on Thursday, nearing the negative territory. Meanwhile, XLM’s funding rates flipped negative on Wednesday, reading -0.026% on Thursday. These negative rates indicate that short traders are paying longs and reflect a bearish bias.
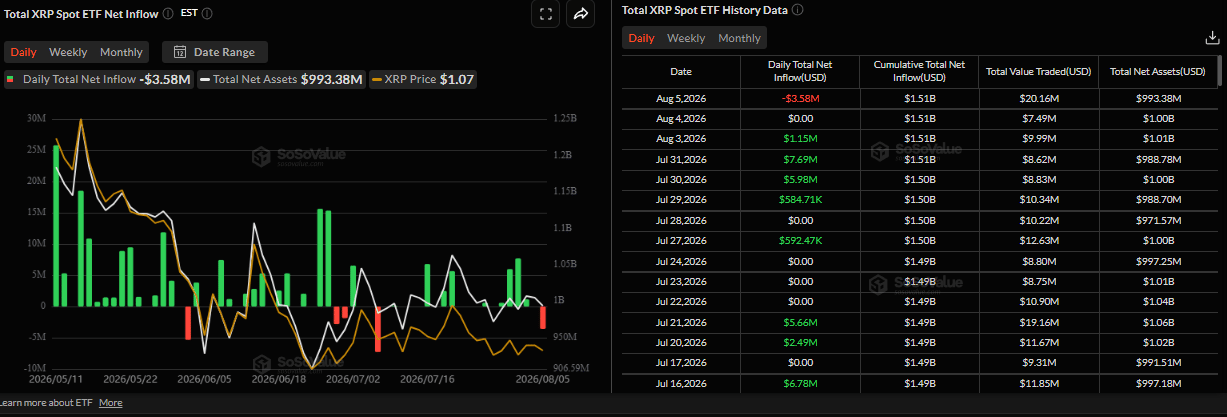
SoSoValue data also supports a bearish bias for XRP. The chart below shows that the spot Exchange Traded Funds (ETFs) recorded an outflow of $3.58 million on Wednesday. If these outflows continue and intensify throughout the week, XRP could extend its losses.
XRP technical outlook: Bears in control of the momentum
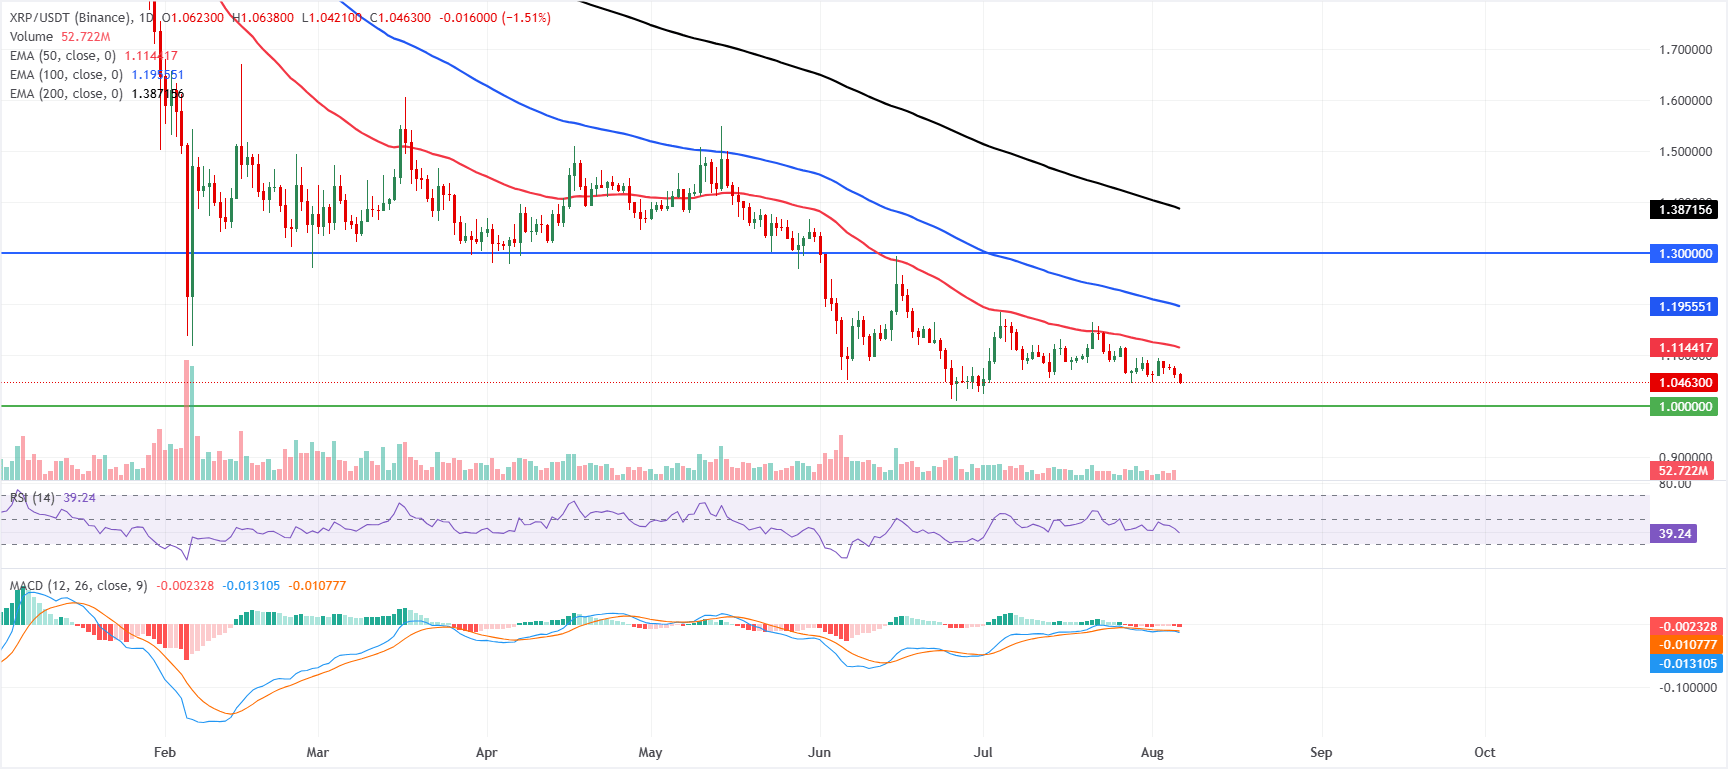
XRP price trades at $1.04 on Thursday, holding in a bearish near-term structure with price lodged below the 50-day, 100-day and 200-day Exponential Moving Averages (EMAs) at $1.11, $1.19 and $1.38 respectively.
The Relative Strength Index (RSI) hovers around 39, pointing to lingering downside pressure. At the same time, the Moving Average Convergence Divergence (MACD) remains marginally negative, hinting that rallies are likely to be sold while these overhead EMAs continue to cap the pair.
On the topside, initial resistance emerges at the 50-day EMA around $1.11, followed by the 100-day EMA near $1.19 and the $1.30 horizontal barrier, with the 200-day EMA at about $1.38.
On the downside, immediate support is seen at the $1.00 horizontal level, where a break would expose fresh lows and deepen the current corrective phase.
XLM technical outlook: Faces rejection from key resistance
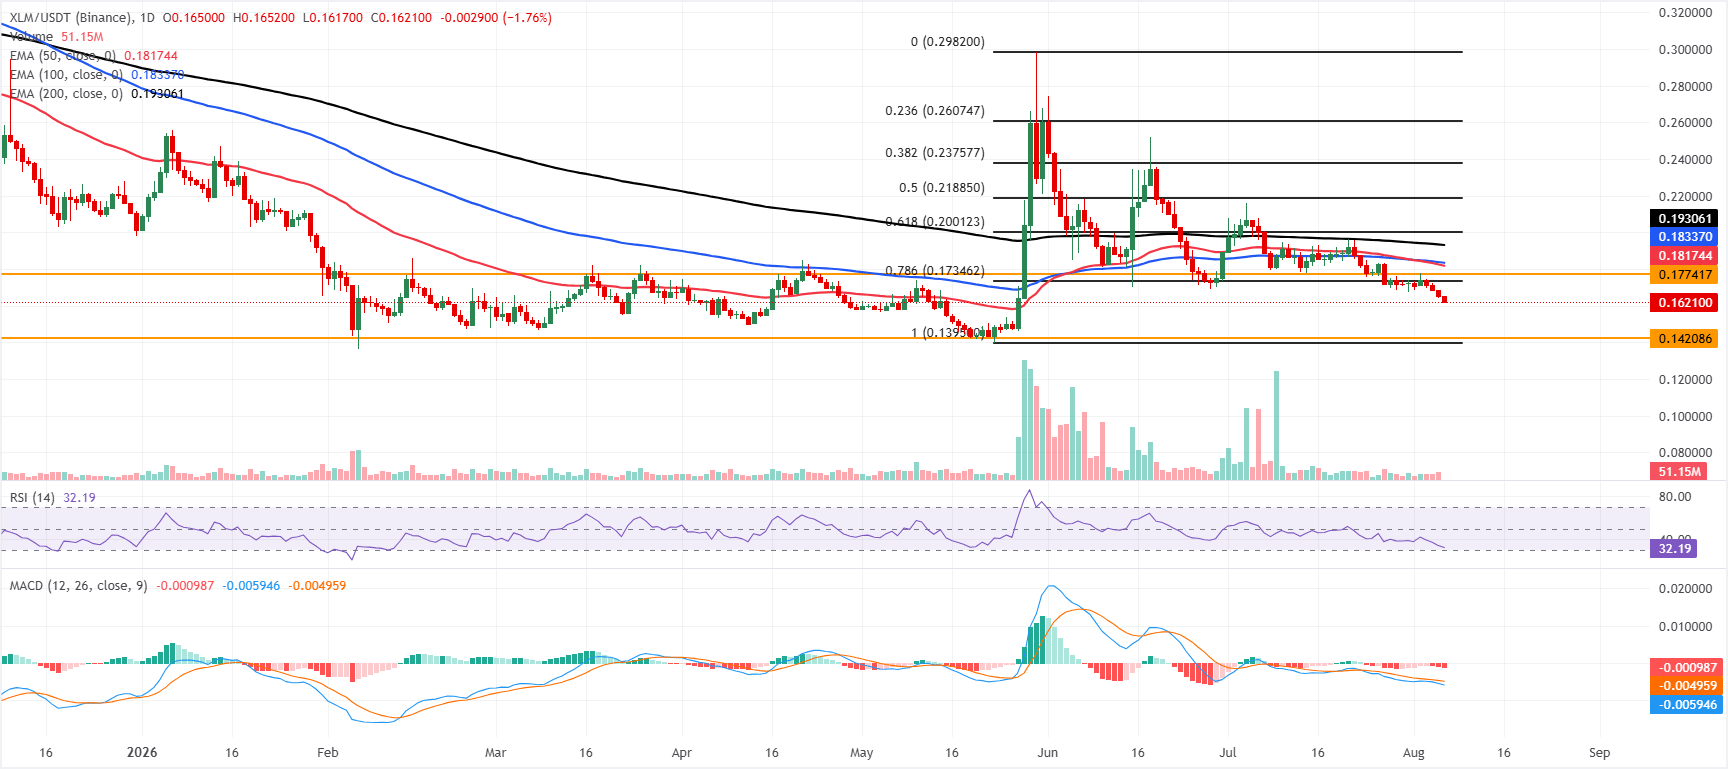
XLM trades at $0.162 on Thursday, extending a bearish bias as price remains lodged below the 50-day, 100-day and 200-day EMAs cluster between roughly $0.181 and $0.193. XLM has retreated from prior highs and is now trading beneath the 78.6% Fibonacci retracement at $0.173 and the nearby horizontal cap at $0.177. At the same time, momentum indicators reinforce the downside tone, with the RSI slipping toward the oversold band at 32 and the MACD line staying below zero with a negative reading and subdued histogram.
On the topside, initial resistance emerges at the 78.6% Fibonacci retracement at $0.173, followed by the horizontal barrier at $0.177, with stronger supply likely around the 50-day EMA at $0.181 and the 100-day EMA at $0.183; a sustained recovery above the 200-day EMA at $0.193 and the 61.8% Fibonacci retracement at $0.200 would be needed to ease the prevailing bearish structure.
On the downside, support rests at the horizontal floor near $0.142, ahead of the cycle low anchor around $0.139, where sellers could begin to lose traction if daily momentum becomes fully oversold.
(The technical analysis of this story was written with the help of an AI tool. Know more.)
Recommended Articles


