

Pepe Price Forecast: Bearish metrics warn of a steeper decline in PEPE

Source Fxstreet
  • Pepe holds steady below the 50-day EMA at $0.00000285, following a 5% loss the previous day.
  • Speculative retail demand in PEPE futures eases as the funding rate flips negative amid declining Open Interest.
  • On-chain data points to near-term weakness among top holders amid increasing PEPE supply on crypto exchanges.

Pepe (PEPE) price is holding steady on Tuesday, following a 5% drop the previous day. The meme coin is losing its retail strength, with a negative funding rate and declining Open Interest, while on-chain data shows top holders reducing exposure, increasing available supply on crypto exchanges. 

Technically, PEPE is on the verge of breaking below a key support level, which could result in roughly 20% downside.

Speculations wane in Pepe

Pepe is losing its mild recovery in retail demand seen over the last three weeks. CoinGlass data show that the 5% drop on Monday coincided with a nearly 15% decline in PEPE futures Open Interest (OI), indicating a reduced notional value of active perpetual contracts. At the same time, the funding rate has dropped to -0.0081%, reaffirming a bearish sentiment among traders. 
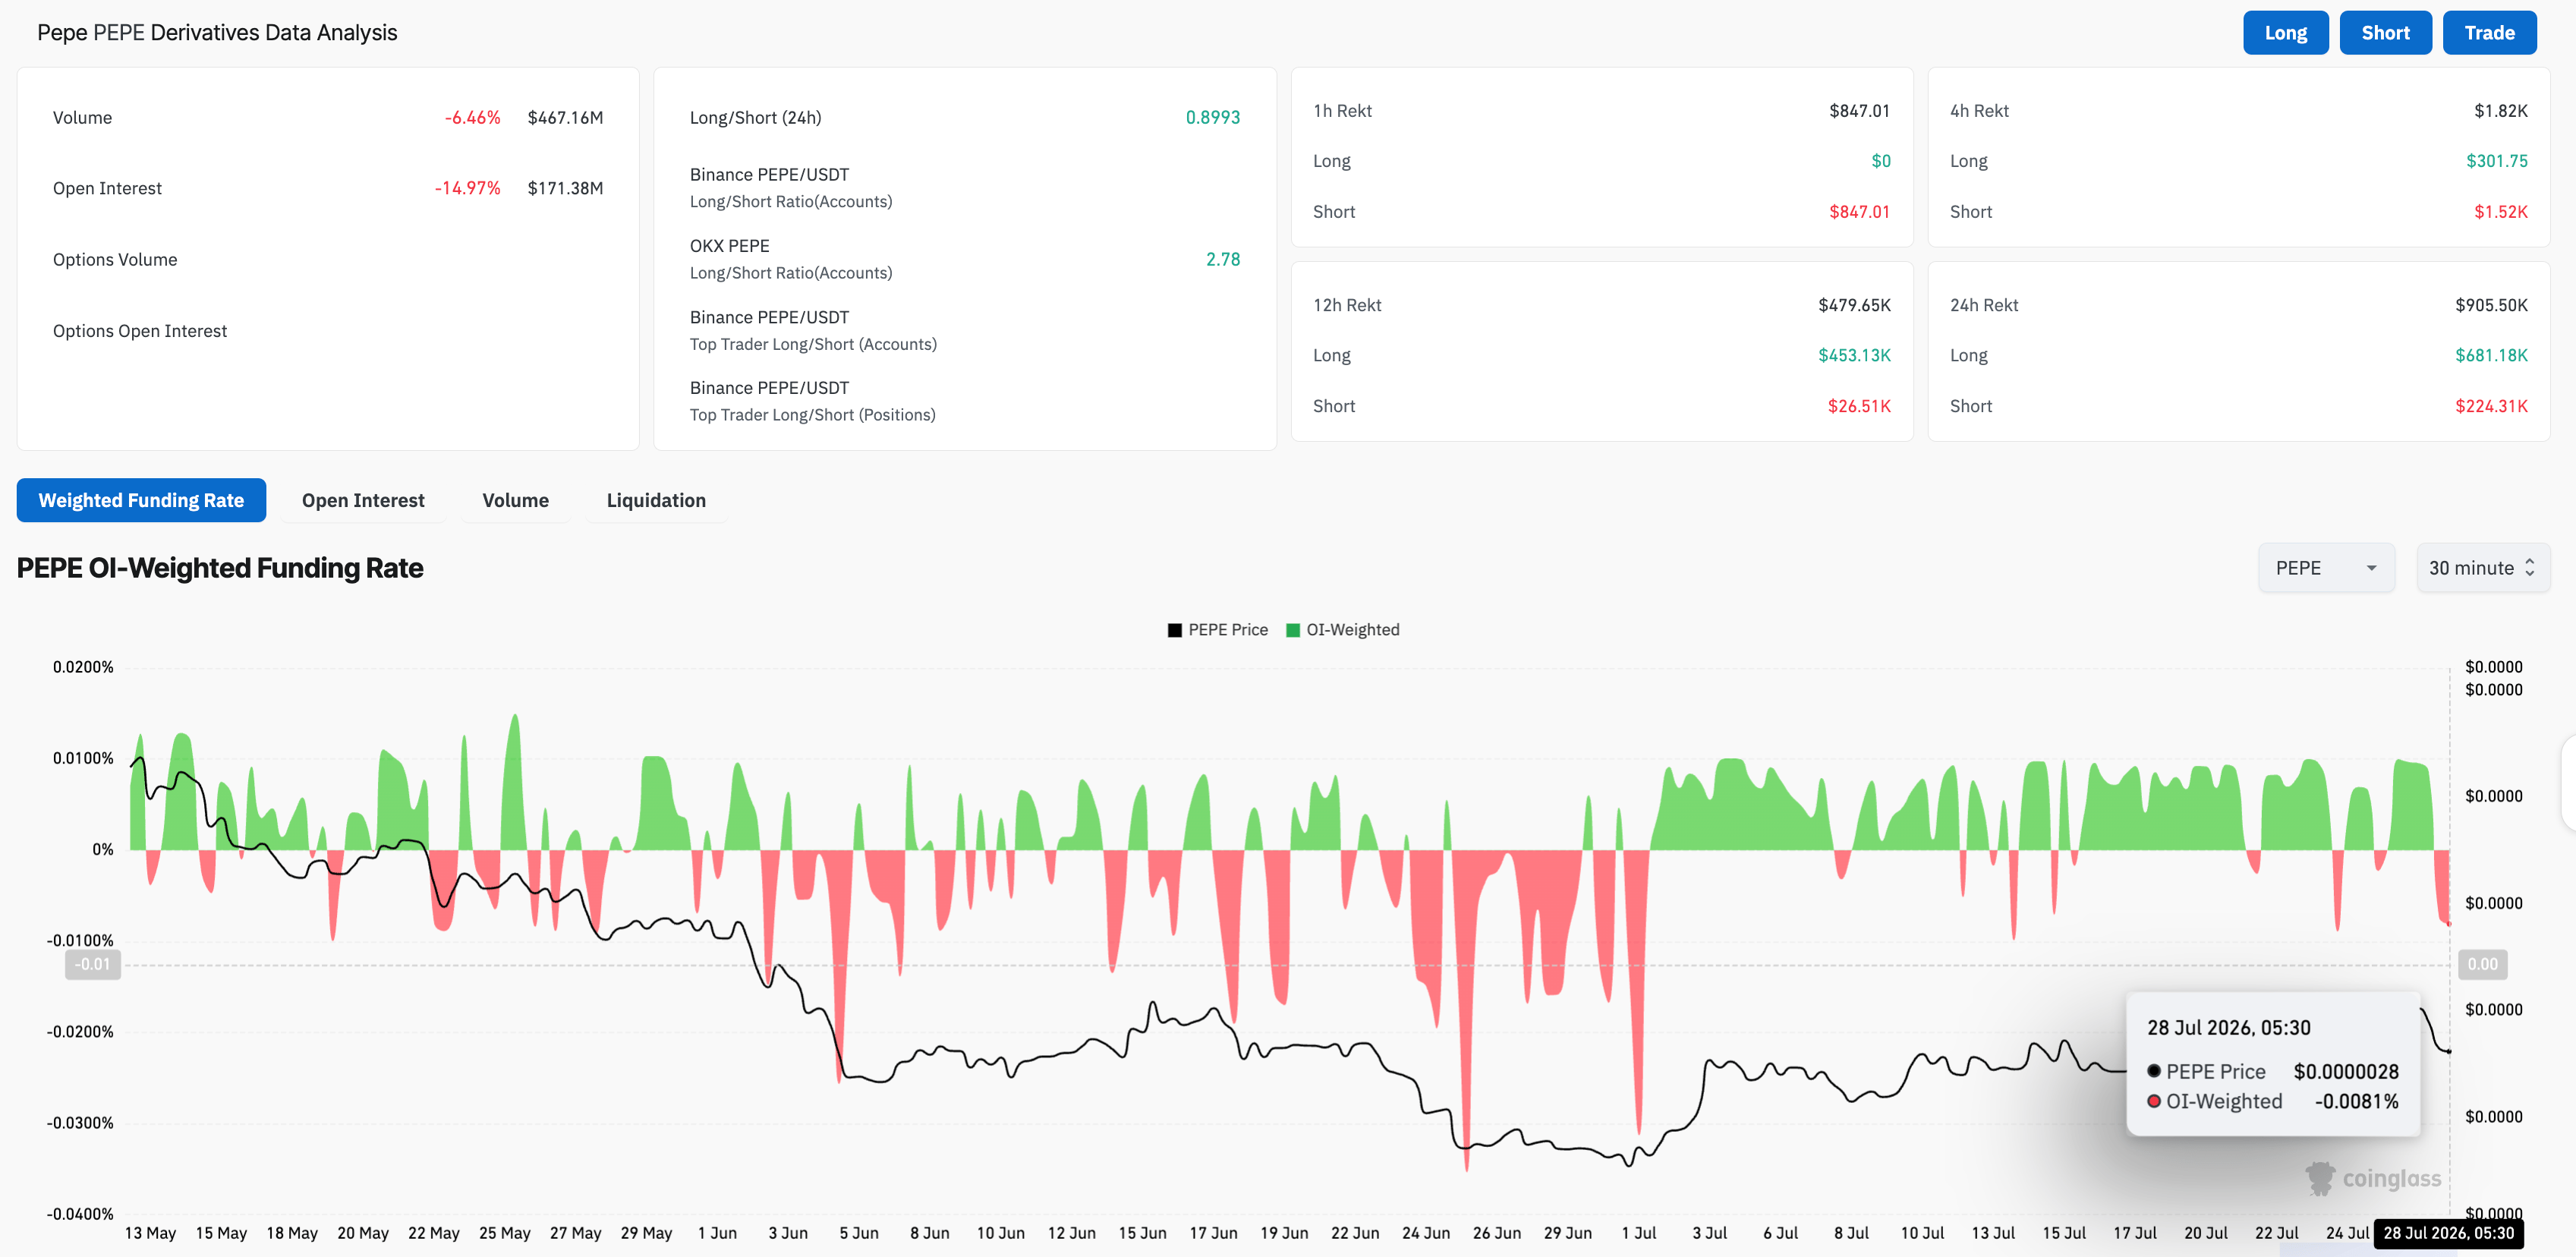
PEPE derivatives data. Source: CoinGlass

On the on-chain side, the meme coin is losing confidence of its top holders. Santiment data shows the supply held by top addresses was down to 164.65 trillion PEPE on Monday, from 171.12 trillion PEPE on June 30. Meanwhile, the top non-exchange addresses now hold 85.19 trillion, down from 86.38 trillion on July 1.

In addition, the supply on exchanges has increased to 18.94 trillion PEPE, from 18.62 trillion PEPE last week. Together, the on-chain data shows that top holders are reducing their PEPE balance, resulting in increased deposits on exchanges as potential supply pressure.
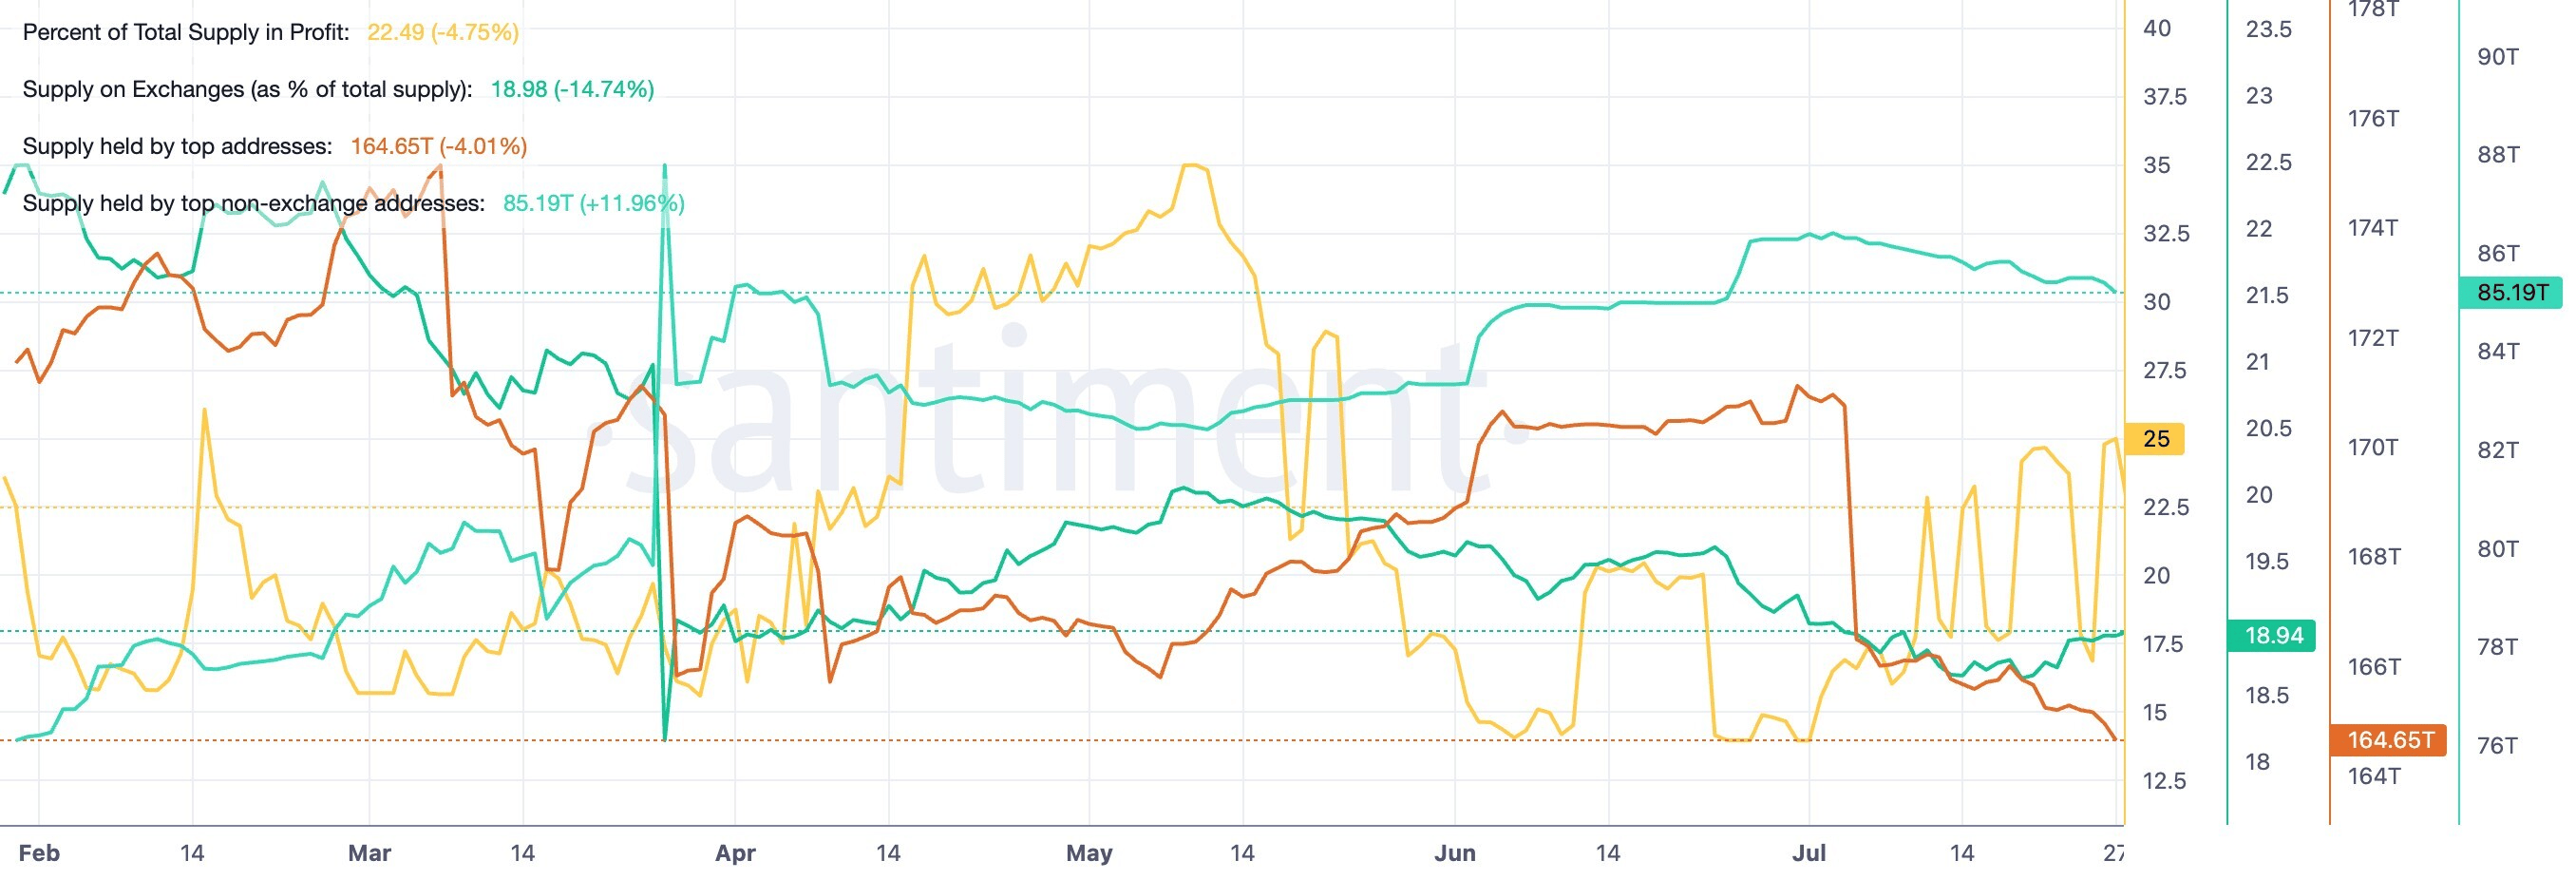
PEPE on-chain data. Source: Santiment

Technical outlook: Will PEPE take the bearish fall?

Pepe maintains a bearish near-term bias as price remains well below both the 50-day and 100-day Exponential Moving Averages (EMAs) at $0.00000285 and $0.00000311, respectively.

The meme coin tests the 23.6% Fibonacci retracement, measured from $0.00000459 to $0.00000223, at $0.00000279, acting as the last line of defense. A decisive close below this level could test the Fibonacci anchor at $0.00000233.

Momentum indicators back this weak tone, with the Directional Moving Index (DMI) showing the positive DI line holding above the negative DI line while the ADX line descends to 18. Taken together, the indicator reflects that bullish momentum is losing strength.
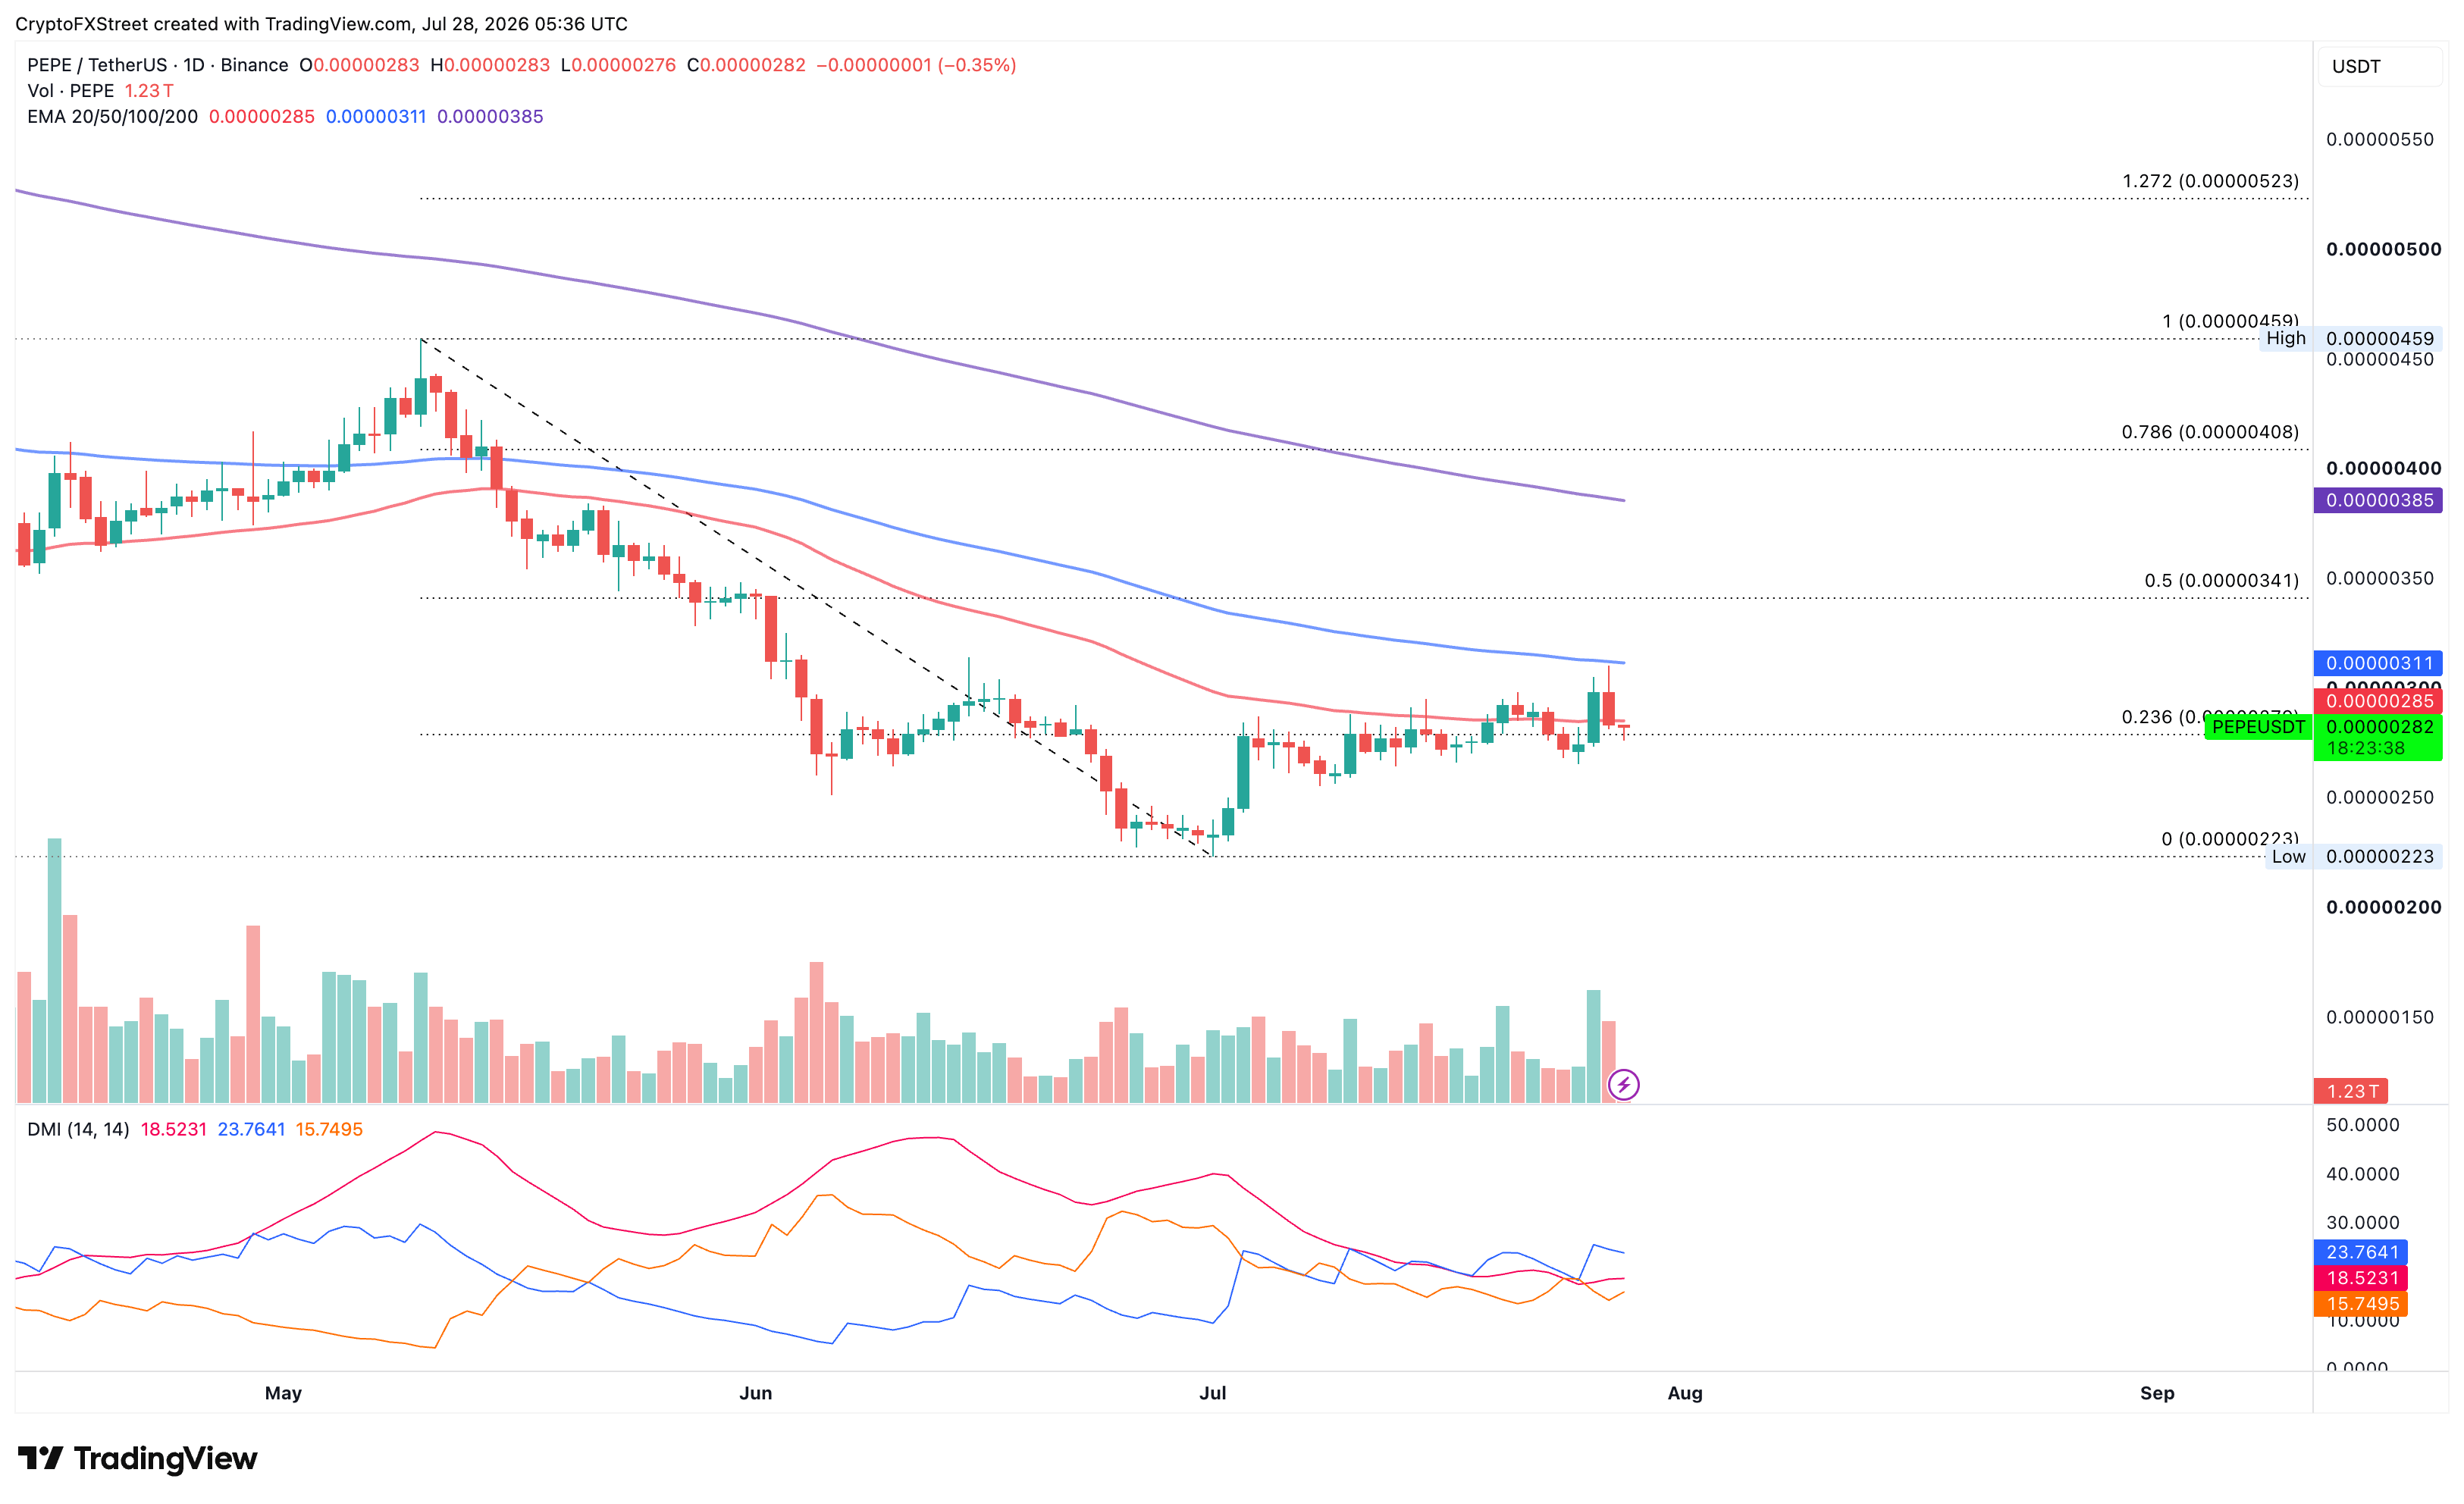
PEPE/USD daily price chart.

Looking up, the 50-day and 100-day EMAs at $0.00000285 and $0.00000311, respectively, act as immediate resistance levels, followed by the 50% retracement level at $0.00000341.

(The technical analysis of this story was written with the help of an AI tool. Know more.)

Disclaimer: For information purposes only. Past performance is not indicative of future results.
placeholder
Natural Gas sinks to pivotal level as China’s demand slumpsNatural Gas price (XNG/USD) edges lower and sinks to $2.56 on Monday, extending its losing streak for the fifth day in a row. The move comes on the back of China cutting its Liquified Natural Gas (LNG) imports after prices rose above $3.0 in June. It
Author  FXStreet
Jul 01, 2024
Natural Gas price (XNG/USD) edges lower and sinks to $2.56 on Monday, extending its losing streak for the fifth day in a row. The move comes on the back of China cutting its Liquified Natural Gas (LNG) imports after prices rose above $3.0 in June. It
placeholder
ECB Policy Outlook for 2026: What It Could Mean for the Euro’s Next MoveWith the ECB likely holding rates steady at 2.15% and the Fed potentially extending cuts into 2026, EUR/USD may test 1.20 if Eurozone growth proves resilient, but weaker growth and an ECB pivot could pull the pair back toward 1.13 and potentially 1.10.
Author  Mitrade
Dec 26, 2025
With the ECB likely holding rates steady at 2.15% and the Fed potentially extending cuts into 2026, EUR/USD may test 1.20 if Eurozone growth proves resilient, but weaker growth and an ECB pivot could pull the pair back toward 1.13 and potentially 1.10.
placeholder
Finding The Best Japan Stocks to Buy? These are Top Japanese Companies to Watch Discover the best Japanese stocks to buy, including AI semiconductor leaders, Buffett-backed trading houses, and undervalued Japan stocks benefiting from corporate reforms and yen trends.
Author  Mitrade
May 29, Fri
Discover the best Japanese stocks to buy, including AI semiconductor leaders, Buffett-backed trading houses, and undervalued Japan stocks benefiting from corporate reforms and yen trends.
placeholder
Gold Price Forecast: Oil Price Breaking $100 Fuels Inflation Concerns, Will Gold Prices Fall Further?As of the Asian session on July 24, gold prices ( XAUUSD) fell continuously during intraday trading, briefly approaching the $4,000 mark. Looking at the chart, gold prices rebounded this
Author  TradingKey
Jul 24, Fri
As of the Asian session on July 24, gold prices ( XAUUSD) fell continuously during intraday trading, briefly approaching the $4,000 mark. Looking at the chart, gold prices rebounded this
placeholder
Gold declines despite easing concerns over inflation, interest rate hikesGold price (XAU/USD) loses ground after registering gains in the previous day, trading around $4,050 per troy ounce during the Asian hours on Tuesday.
Author  FXStreet
7 hours ago
Gold price (XAU/USD) loses ground after registering gains in the previous day, trading around $4,050 per troy ounce during the Asian hours on Tuesday.
goTop
quote