


Crypto Market Overview: Bitcoin risks losing $63,000 – FET, SHIB lead losses
- Bitcoin extends losses on Tuesday, after a 2% decline the previous day.
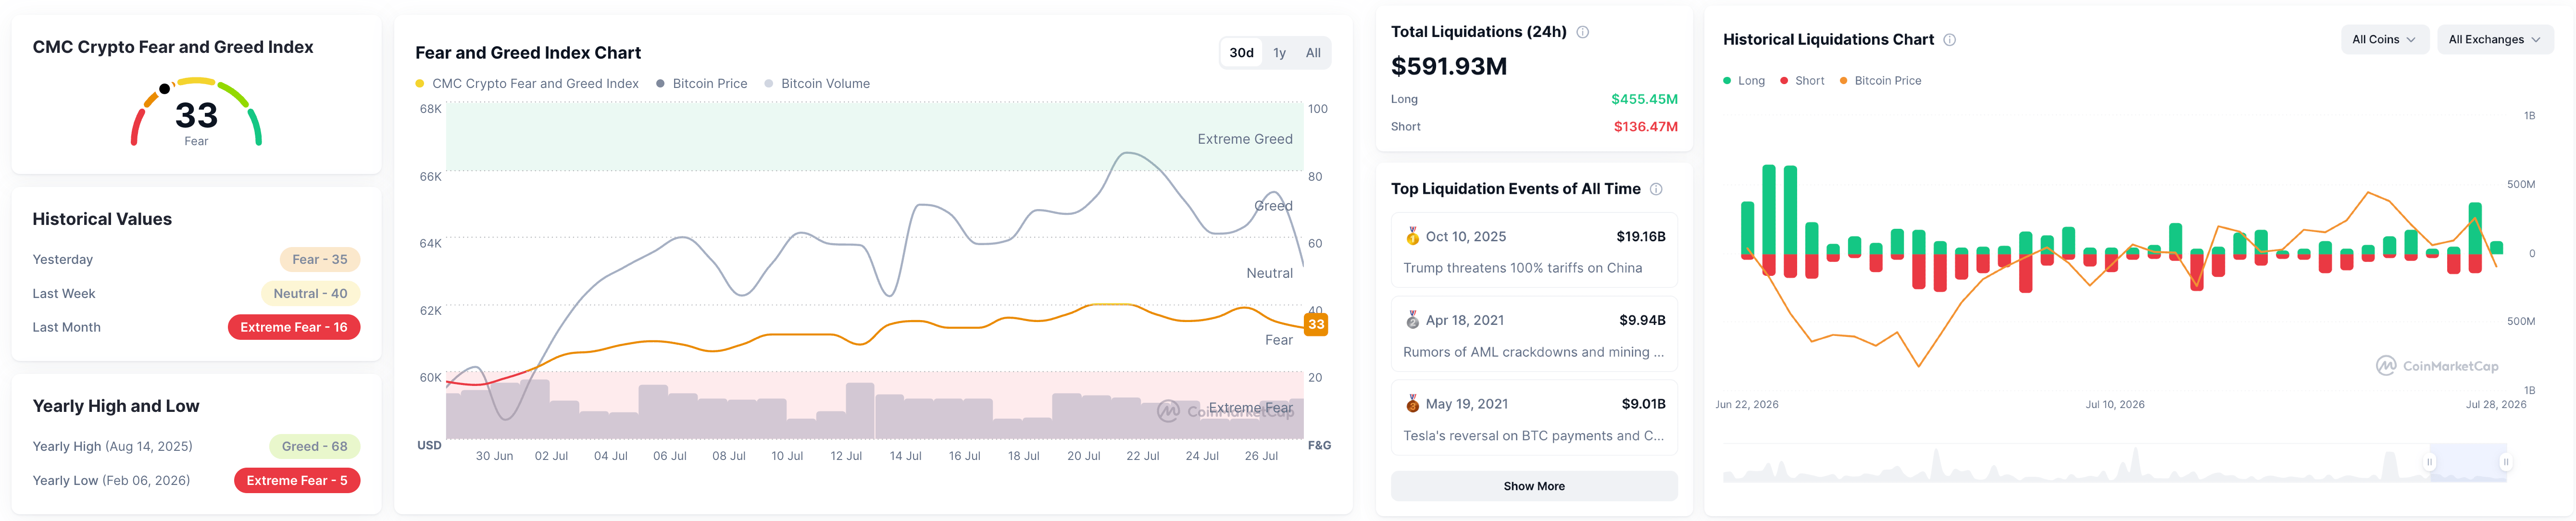
- The crypto market suffered nearly $600 million in liquidations over the last 24 hours, led by bullish positional wipeouts.
- Artificial Superintelligence Alliance and Shiba Inu have emerged as the worst-performing crypto assets over the last 24 hours.
Bitcoin (BTC) edges lower on Tuesday, extending its losses of over 2% from the previous day. The broader crypto market suffered nearly $600 million in liquidations over the last 24 hours amid renewed sell-off pressure. Artificial Superintelligence Alliance (FET) and Shiba Inu (SHIB) have emerged as the worst-performing crypto assets in the same time period.
CoinMarketCap’s Fear and Greed Index at 33, down from 39 on Sunday, reaffirms sustained downside pressure, keeping the sentiment bearish in the near term. At the same time, roughly $592 million in total liquidations over the last 24 hours, led by $455 million of long liquidations, echo renewed selling pressure.
Technical outlook: Bitcoin risks a steeper decline toward $60,000
Bitcoin maintains a bearish near-term bias as spot action holds well beneath the 50-day Exponential Moving Average (EMA) at $64,960 and the 200-day EMA at $74,126. The loss of the prior upward support trendline, now acting as resistance near $76,870, reinforces the idea that the market is capped by higher-timeframe sellers.
Momentum conditions are soft, with the Moving Average Convergence Divergence (MACD) crossing below its signal line and printing a negative histogram. At the same time, the Relative Strength Index (RSI) is at 45, suggesting downside pressure persists even as outright oversold conditions are avoided.
Looking down, the path of least resistance points toward the $60,000 psychological support.
On the topside, initial resistance is seen at the 50-day EMA around $64,960; a daily close above this barrier would be needed to ease immediate downside pressure and open the way toward the 200-day EMA at roughly $74,126, ahead of the broken trendline zone near $76,870.
Technical outlook: FET and SHIB are under pressure
Artificial Superintelligence Alliance edges lower on Tuesday, following a 9% drop the previous day. FET extends a bearish phase below its 50-day EMA at $0.1725 and the 200-day EMA at $0.2282, keeping the broader trend under strain.
The immediate support for FET aligns with the February 6 low at $0.1340. Based on the Fibonacci retracement from $0.1340 to $0.2889, a break below $0.1340 could break below the $0.1000 psychological threshold to target the 127.2% extension level at $0.0918.
The RSI hovers near oversold territory at 31, while the MACD crosses below its signal line, suggesting that a selling bias remains dominant even as short-term exhaustion signals begin to emerge.
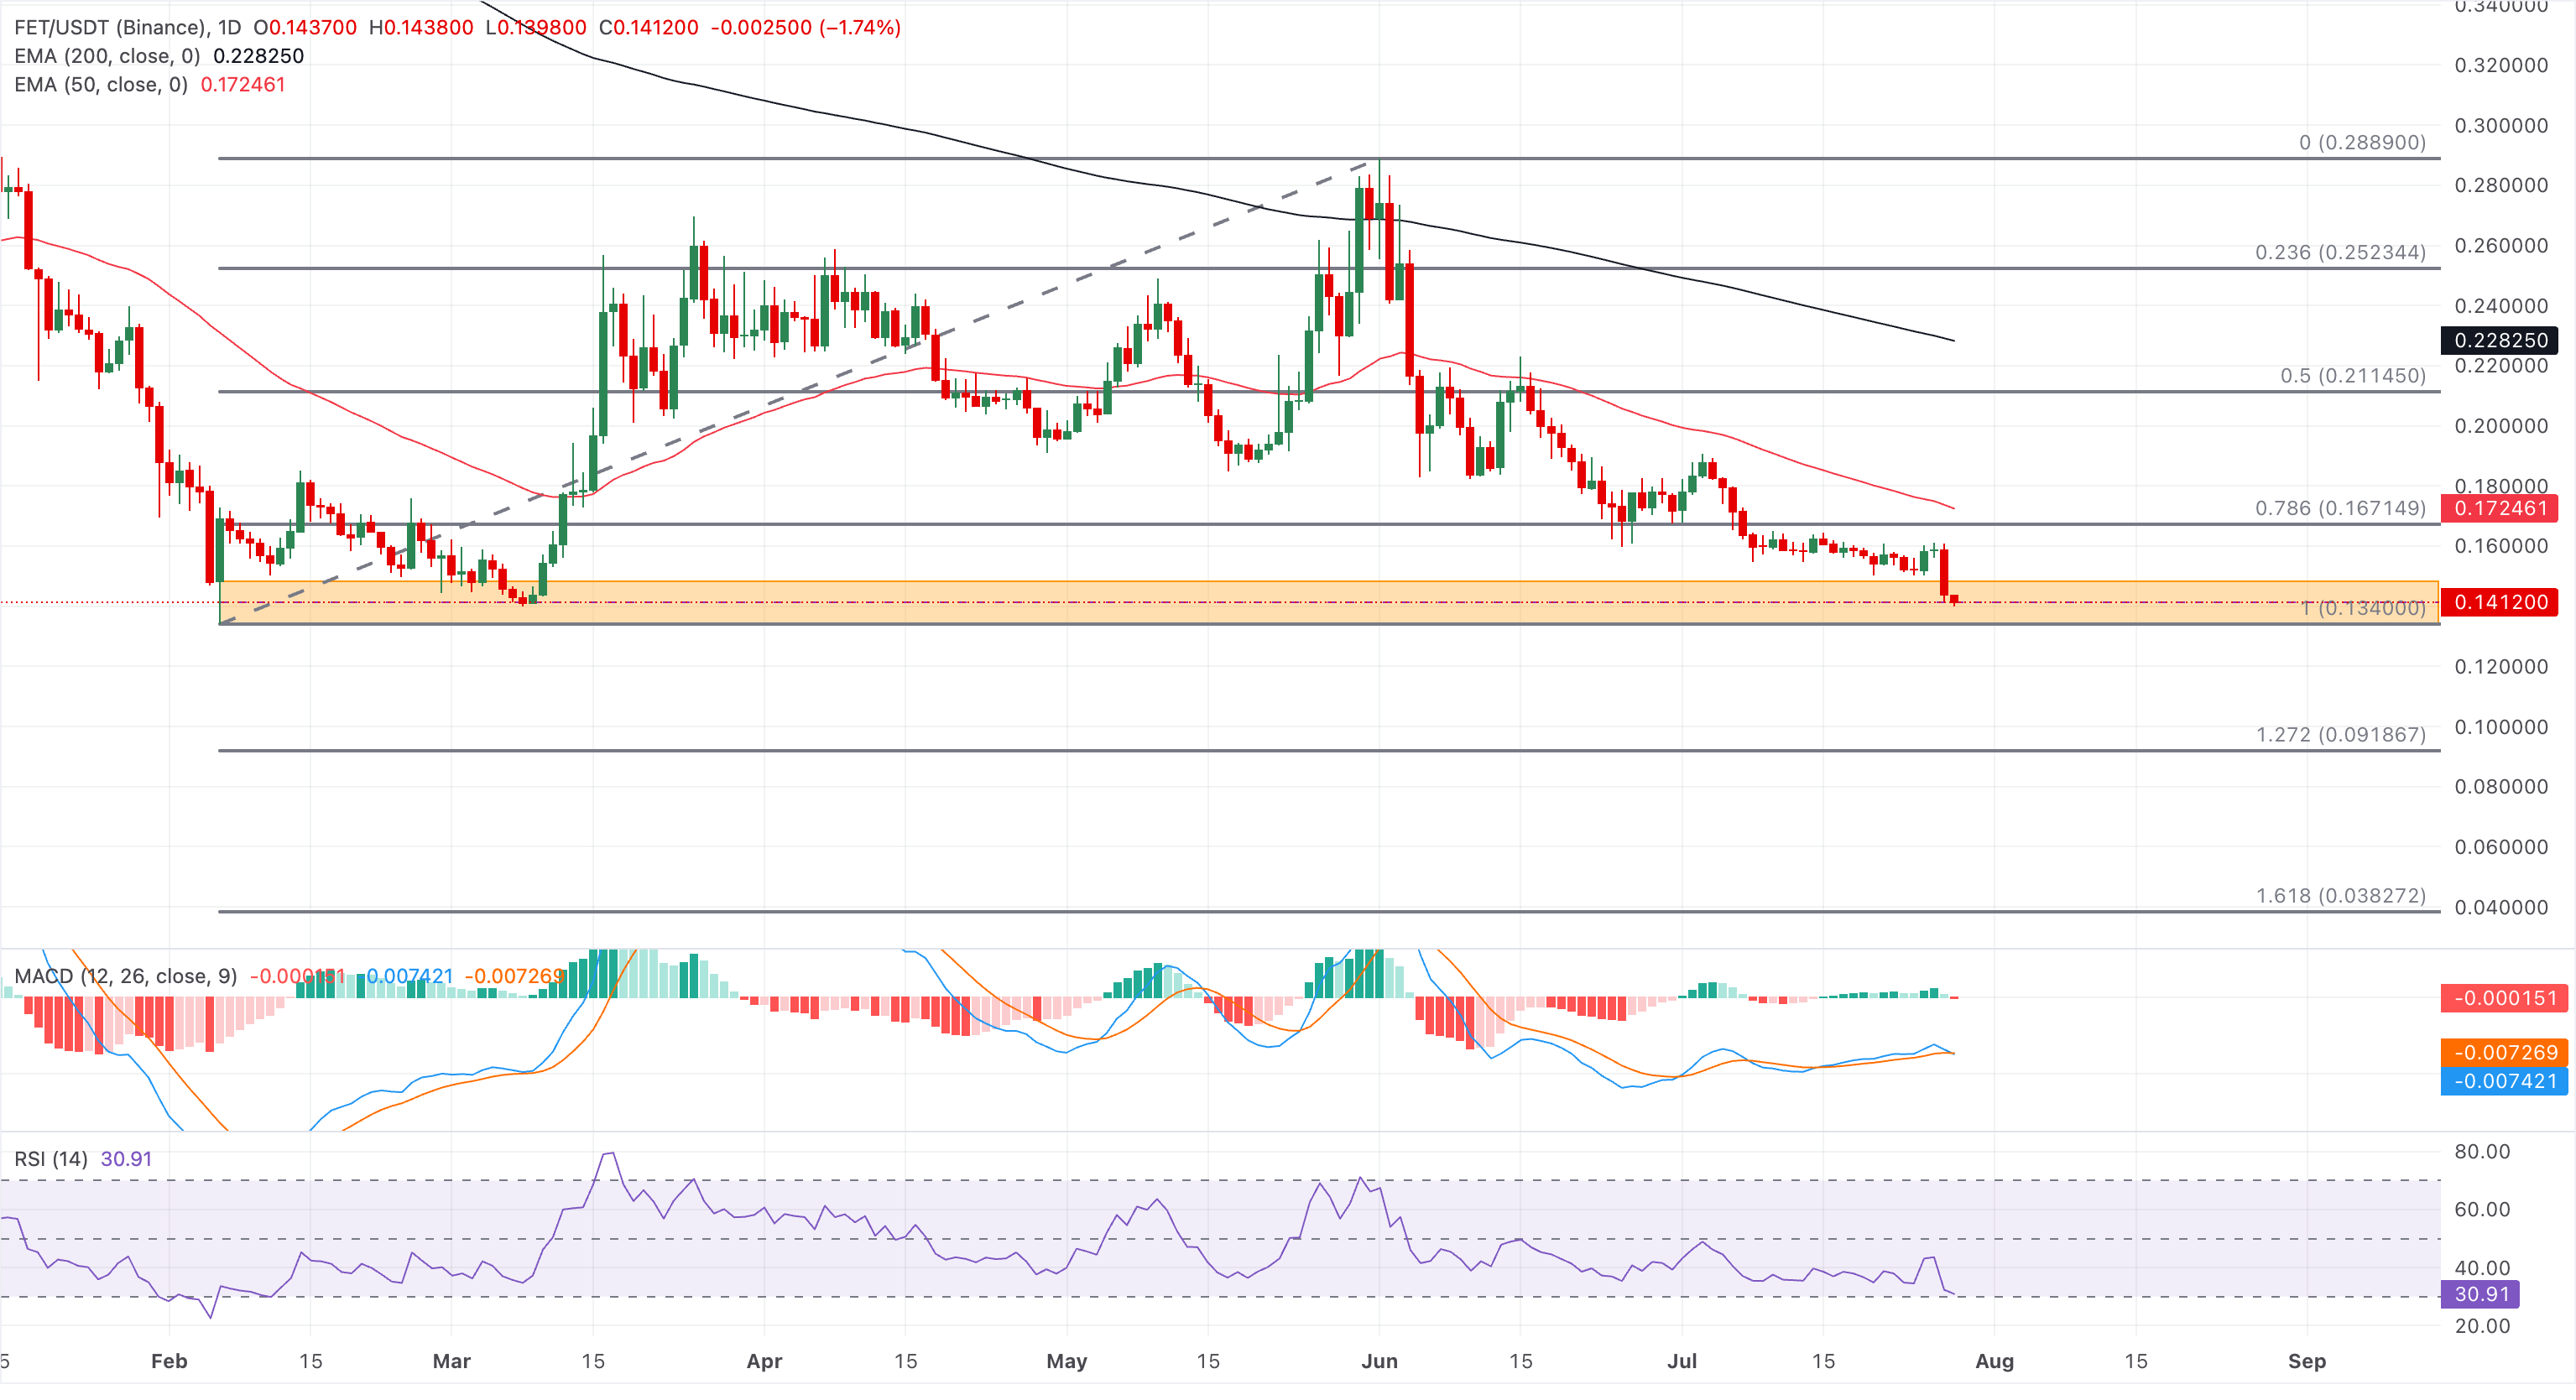
On the topside, initial resistance appears at the 78.6% Fibonacci retracement at $0.1671, followed by the 50-day EMA at $0.1725; a daily close above this cluster would be needed to ease immediate bearish pressure.
Shiba Inu is down 3% on Tuesday, extending the 9% decline from the previous day. The meme coin tests its 50-day EMA at $0.00000460, close to the 78.6% Fibonacci retracement level at $0.00000462, measured from $0.00000670 to $0.00000405. A decisive close below $0.00000460 could extend the decline toward the Fibonacci anchor at $0.00000405.
The RSI at 55 shows a sharp drop into the oversold zone, reflecting a steep decline in buying pressure.
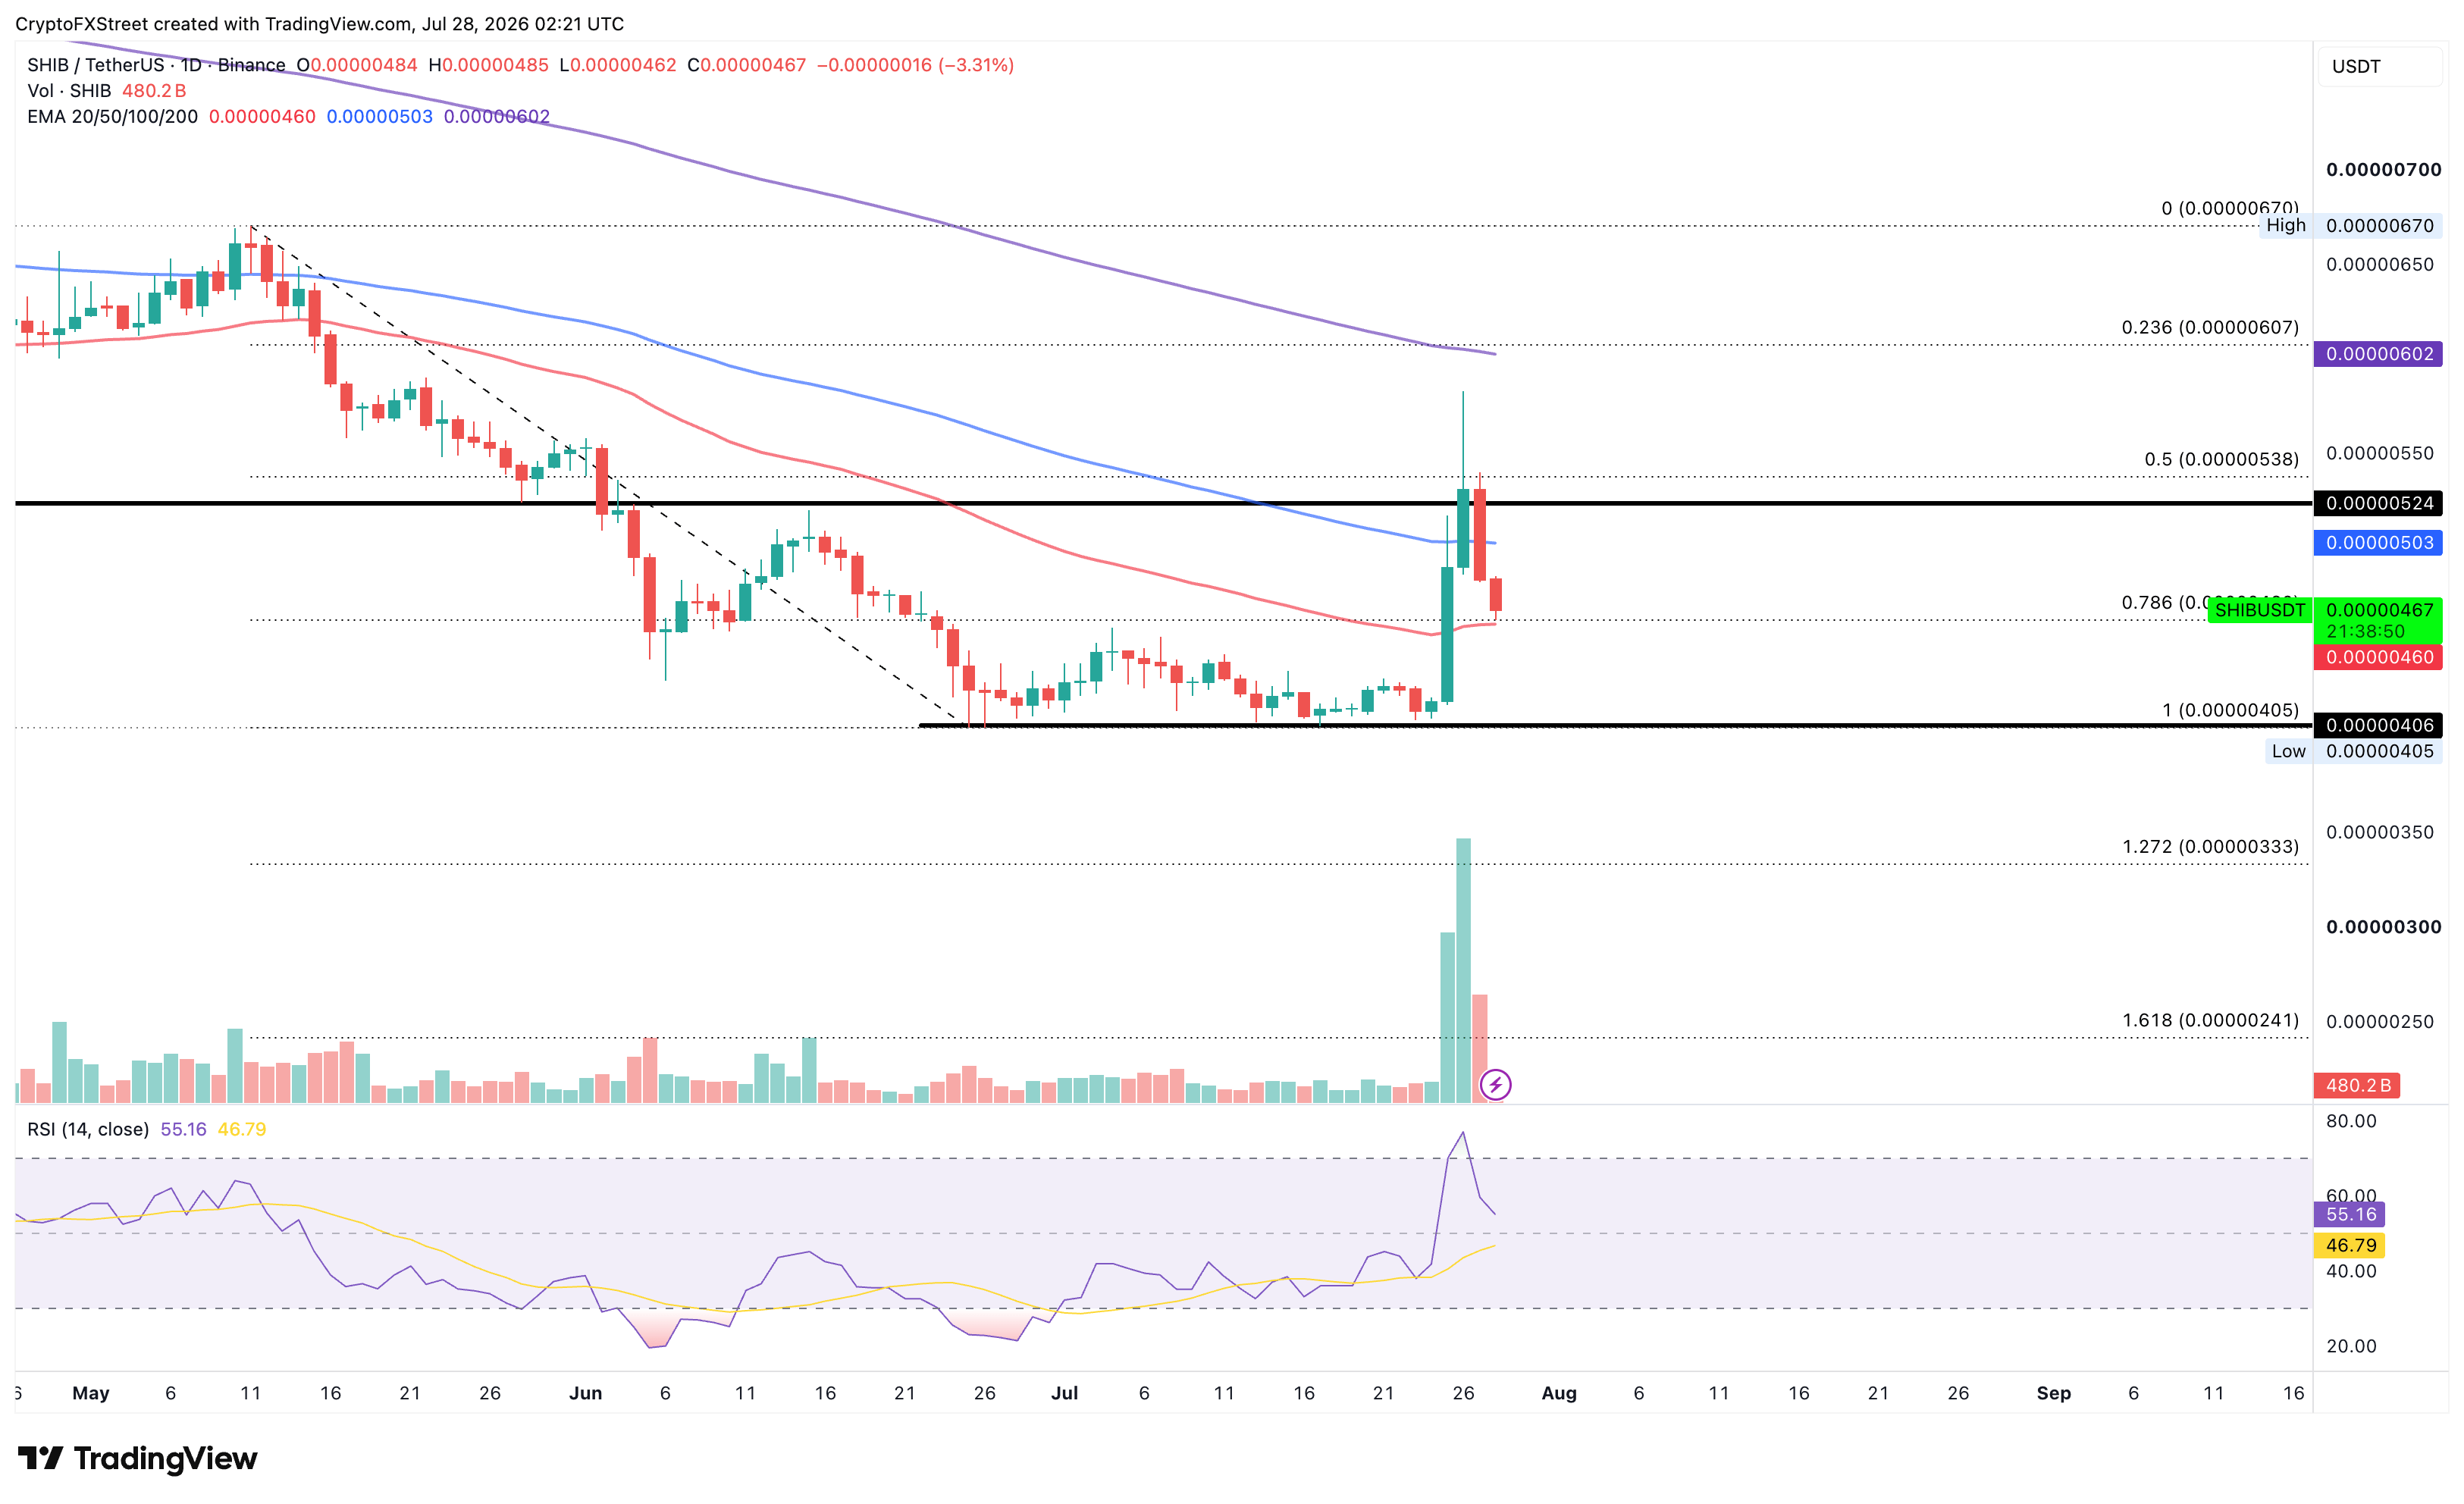
Looking up, the 100-day EMA at $0.00000503 emerges as the immediate resistance.
(The technical analysis of this story was written with the help of an AI tool. Know more.)
Recommended Articles


