


Silver (XAGUSD) Is down 2.02% on Jul 28: Is the Market Repricing It?
Silver (XAGUSD) is down 2.02% at Jul 28 00:55(ET), now at $57.165, with a 7-day down of 2.71%.
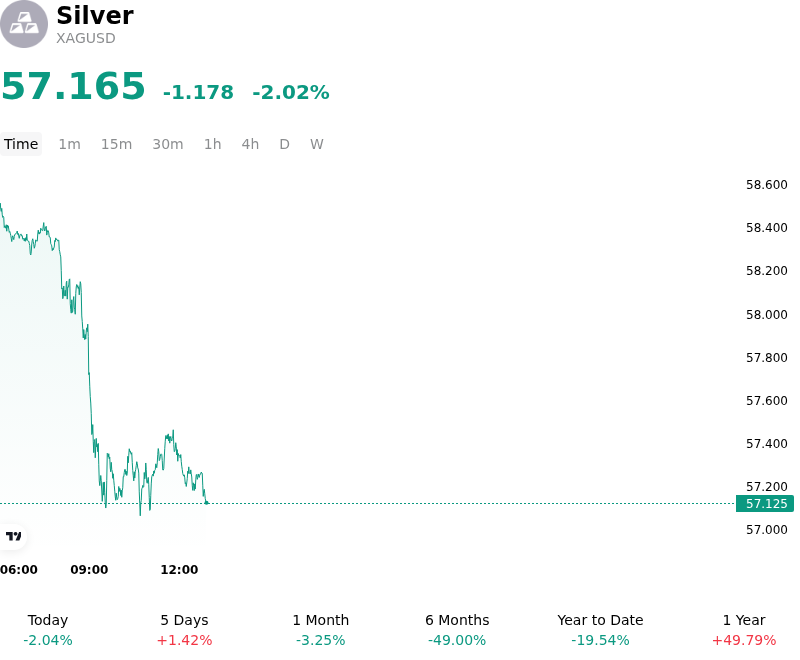
What is driving Silver (XAGUSD)’s stock price down today?
The decline in silver prices is primarily driven by a sharp recalibration of global interest rate expectations and a strengthening US dollar. Recent economic data, particularly stronger than anticipated labor market figures and persistent core inflation, has led institutional investors to price in a more hawkish stance from the Federal Reserve. As real yields rise, the opportunity cost of holding non-yielding precious metals increases, prompting a significant liquidation of long positions in the silver market.
Silver's dual role as both a financial asset and an industrial commodity has exacerbated the selling pressure. A slowdown in global manufacturing activity, evidenced by weakening Purchasing Managers Index data in key industrial hubs, has raised concerns regarding near-term demand for silver in the photovoltaic and electronics sectors. While the long-term structural demand for silver in the green energy transition remains a core thesis for many investors, the immediate outlook is being clouded by cyclical headwinds in the industrial sector and a temporary build-up in exchange-monitored inventory levels.
The move also reflects a broader shift in institutional capital flows, as the dollar index experiences a broad-based rally against its peers. This currency strength acts as a significant headwind for dollar-denominated commodities, reducing purchasing power for international buyers and dampening physical demand in major consuming nations. Furthermore, the break below key technical support levels has triggered systematic selling and stop-loss orders, accelerating the downward momentum during the trading session.
Market participants are currently monitoring the silver-to-gold ratio, which has widened as silver underperforms gold due to its higher sensitivity to economic growth cycles. The absence of an immediate geopolitical catalyst to sustain a safe-haven risk premium has left the metal vulnerable to these macroeconomic shifts. Until there is a clear signal of a dovish pivot from central banks or a stabilization in global manufacturing data, silver remains highly sensitive to liquidity-driven volatility and the trajectory of US real rates.
Technical Analysis of Silver (XAGUSD)
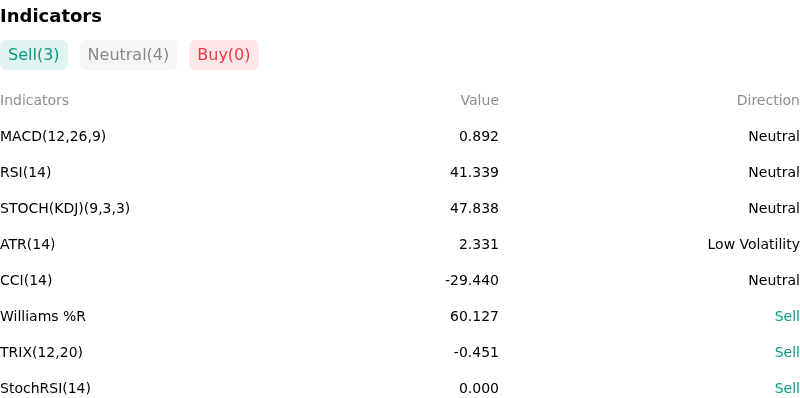
Technically, Silver (XAGUSD) shows a MACD (12,26,9) value of 0.892, indicating a neutral signal. The RSI at 41.339 suggests neutral condition and the Williams %R at 60.127 suggests sell condition. Please monitor closely.
More details about Silver (XAGUSD)
Recent Events and Risks:
- U.S. Dollar and Treasury Yield Surge: Stronger-than-expected U.S. economic data and hawkish Federal Reserve commentary over the last 48 hours have driven the U.S. Dollar Index (DXY) and Treasury yields higher, increasing the opportunity cost of holding non-yielding silver and triggering intraday selling pressure.
- China Industrial Demand Deterioration: Recent manufacturing data and lackluster stimulus signals from Beijing have intensified concerns regarding industrial silver consumption, particularly within the solar photovoltaic and electronics sectors, which represent a significant portion of silver's global demand profile.
- ETF Liquidation and Positioning Unwind: Market data from the last 72 hours indicates a reduction in holdings across major silver-backed exchange-traded products, suggesting that institutional investors are deleveraging long positions in response to shifting macro expectations, which could accelerate a downward price correction.
- Technical Support Breach and Algorithmic Selling: Spot silver's failure to maintain key psychological support levels during recent sessions has activated algorithmic sell orders and stop-loss triggers, increasing the risk of a liquidity-driven flush as participants move to protect capital in a high-volatility environment.
Recommended Articles


