

Worldcoin Price Forecast: WLD extends gains as constructive bullish bias persists above key EMAs
- Worldcoin extends its two-day rebound and trades over 4% on Tuesday, with a constructive bias holding above a dense cluster of key EMAs.
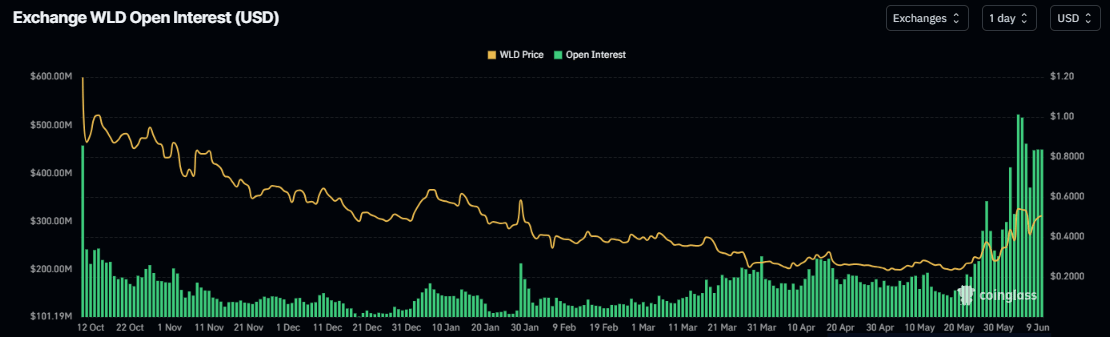
- Derivatives metrics remain supportive, with WLD’s Open Interest rising steadily alongside a mildly growing number of long positions.
- The technical outlook suggests a continuation of the rally, as momentum indicators show bullish strength gaining traction.
Worldcoin (WLD) extends its gains on Tuesday, trading at $0.50 and above a dense band of key Exponential Moving Averages (EMAs). Strengthening derivatives metrics, alongside a constructive technical outlook, suggest WLD could be well-positioned to extend its recent rally in the near term.
Derivatives data supports a bullish bias
CoinGlass data show that futures Open Interest (OI) across Worldcoin exchanges surges to $449.29 million from $377.25 million on Sunday and has been rising steadily since mid-May. An increase in OI indicates new or additional money entering the market and buying, which could fuel a rally in WLD's price.
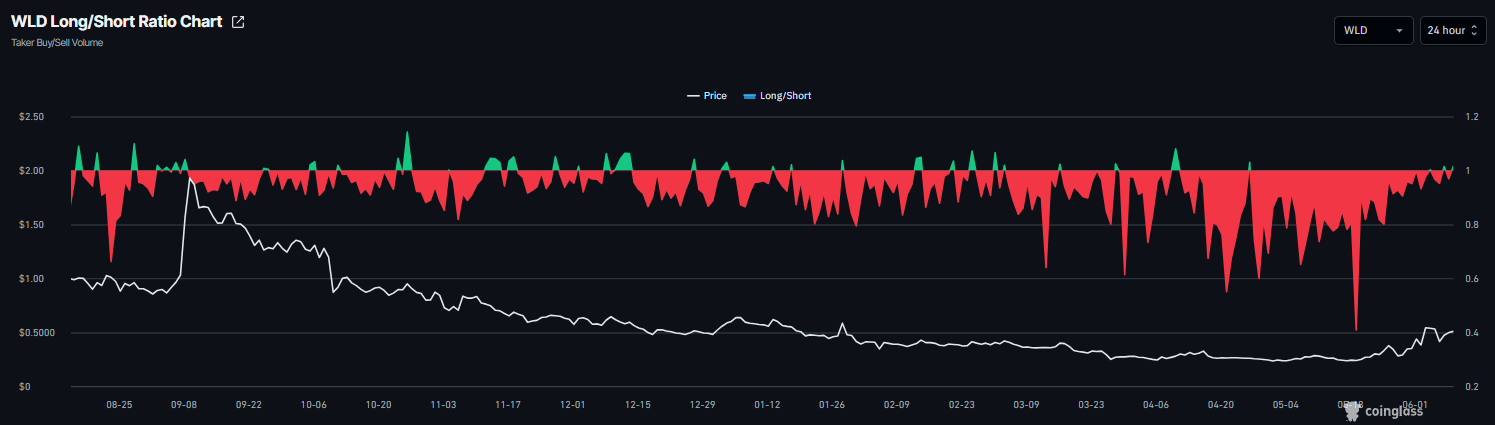
In addition, CoinGlass’ long-to-short ratio for WLD rebounds to 1.01 on Tuesday. If the ratio continues to rise above 1, it indicates bullish sentiment, as more traders are betting on the asset’s price to rise.
Some signs of concern
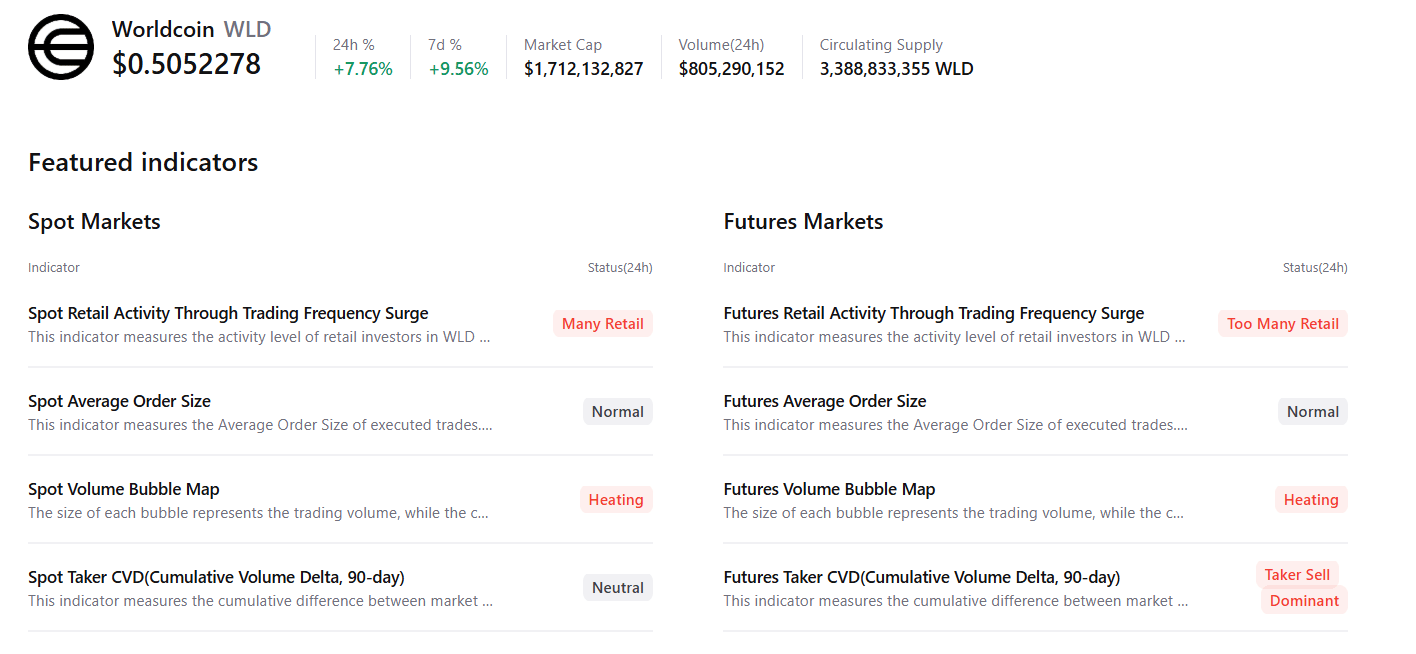
CryptoQuant’s summary data show some signs of concern: spot and futures markets indicate rising retail activity, heating conditions and sell-side dominance, capping the upside move.
Worldcoin Price Forecast: WLD maintains a bullish outlook
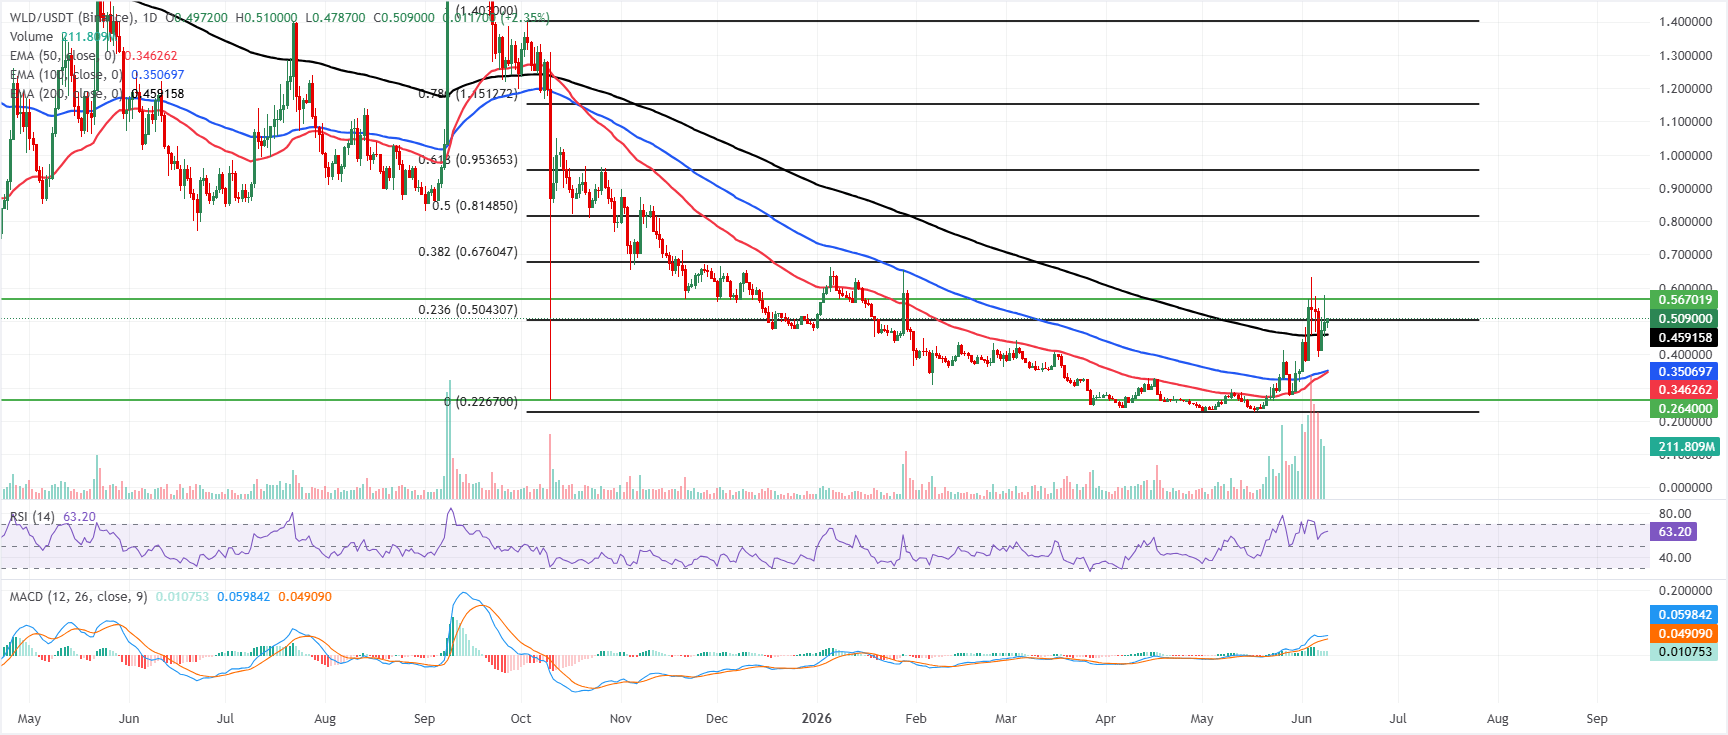
Worldcoin price trades at $0.509 on Tuesday, maintaining a constructive bullish bias as it holds above a dense band of Exponential Moving Averages (EMAs). The 23.6% Fibonacci retracement at roughly $0.504 now aligns as immediate support just beneath spot, while the 50-day, 100-day and 200-day EMAs cluster well below, reinforcing an underlying floor around the mid-$0.30s to upper-$0.40s.
The Relative Strength Index (RSI) on the daily chart near 63 suggests firm bullish momentum without yet reaching overbought territory, and the Moving Average Convergence Divergence (MACD) remains positive, hinting that upside pressure is still in play.
On the downside, initial support is seen at the 23.6% Fibonacci retracement near $0.504, followed by the 200-day EMA around $0.459, with deeper demand expected around the 100- and 50-day EMAs near the mid-$0.30 area, and finally at the horizontal support level at $0.264.
On the topside, immediate resistance emerges at the horizontal barrier around $0.567, ahead of the 38.2% Fibonacci retracement near $0.676, with further bullish extensions likely to encounter subsequent Fibonacci caps at approximately $0.815, $0.954, $1.151 and the prior swing high at $1.403.
(The technical analysis of this story was written with the help of an AI tool.)
Recommended Articles


