

Bitcoin Price Forecast: BTC rally pauses as it tests key 200-day EMA
- Bitcoin price takes a breather on Thursday after testing its key 200-day EMA near $82,162 the previous day.
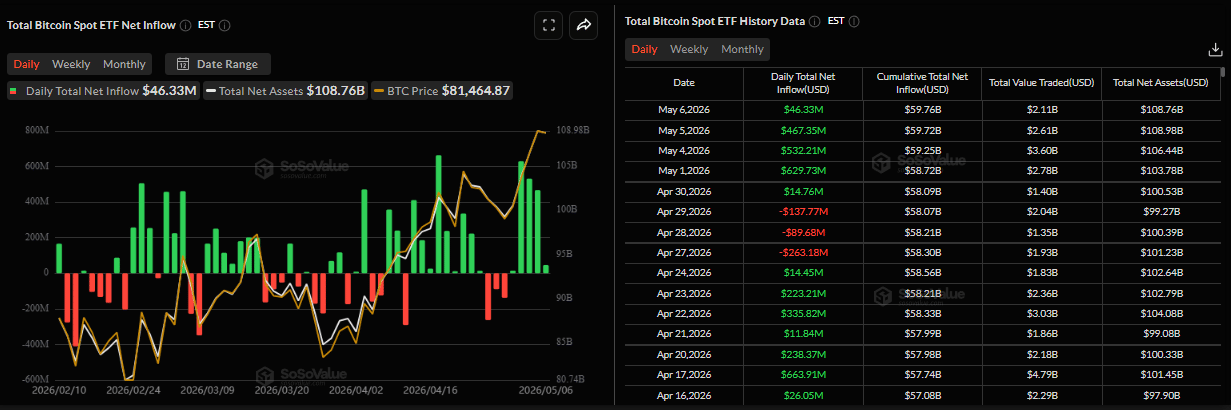
- US-listed spot recorded inflows of $46.33 million on Wednesday, marking the fifth consecutive day of gains.
- Risk-on sentiment strengthened amid hopes of a US-Iran peace deal, boosting appetite for cryptocurrencies.
Bitcoin (BTC) consolidates at the time of writing on Thursday after surging earlier this week, pausing near its key 200-day Exponential Moving Average (EMA) around $82,162. The upward price action in the Crypto King is further supported by consistent inflows into spot Bitcoin Exchange Traded Funds (ETFs), indicating sustained institutional interest. In addition, improving risk sentiment, fueled by optimism surrounding a potential US-Iran peace deal, continues to support the largest cryptocurrency by market capitalization.
Institutional demand continues
Institutional demand has remained strong so far this week. SoSoValue data show that US-listed BTC spot ETFs recorded inflows of $46.33 million on Wednesday, marking the fifth consecutive day of positive flow. If these inflows continue and intensify, BTC could see a further price rally.
Glassnode reported on Wednesday that the Crypto King is showing early signs of structural recovery, reclaiming key on-chain cost basis levels while pushing toward overhead resistance near $85,000.
The report further explained that the spot demand and ETF inflows are rebuilding, suggesting bulls remain in control; however, BTC is nearing the key overhead supply zone. On the derivatives side, traders' positioning remains skewed to the short side, creating conditions where further upside could be driven by short pressure.
“The trend appears constructive with bullish momentum intact, but the market is now entering a more reactive phase. A sustained break above resistance, supported by continued spot demand and easing sell-side pressure, will be required to confirm a durable continuation higher,” concluded the Glassnode analyst.
US-Iran peace hopes boost risk appetite
Bitcoin and the broader crypto markets have remained strong so far this week, with BTC hitting a three-month high at $82,850 on Wednesday. The risk-on sentiment strengthened amid hopes of a US-Iran peace deal, boosting investors’ appetite for cryptocurrencies.
The BBC reported on Wednesday that Iran stated a US proposal aimed at ending the conflict is “still being considered,” despite reports indicating both sides could be approaching a deal.
According to reports, the US presented Iran with a one-page memorandum of understanding that would gradually reopen the Strait of Hormuz and ease the American blockade on Iranian ports. Talks concerning Iran’s nuclear program would take place at a later stage, although no final agreement has yet been reached.
Hopes for peace between the US and Iran sparked a sharp decline in oil prices, helping to ease inflation worries and lowering expectations for an extended hawkish stance from the Federal Reserve (Fed). BTC and the broader crypto market generally thrive in low-interest-rate environments, as cheaper borrowing costs boost liquidity and encourage investors to shift capital toward riskier, high-growth assets.
However, Chicago Fed President Austan Goolsbee warned that inflation has not continued to cool toward the Federal Reserve’s 2% target and has instead accelerated since the conflict started.
Bitcoin Price Forecast: BTC nears key resistance zone
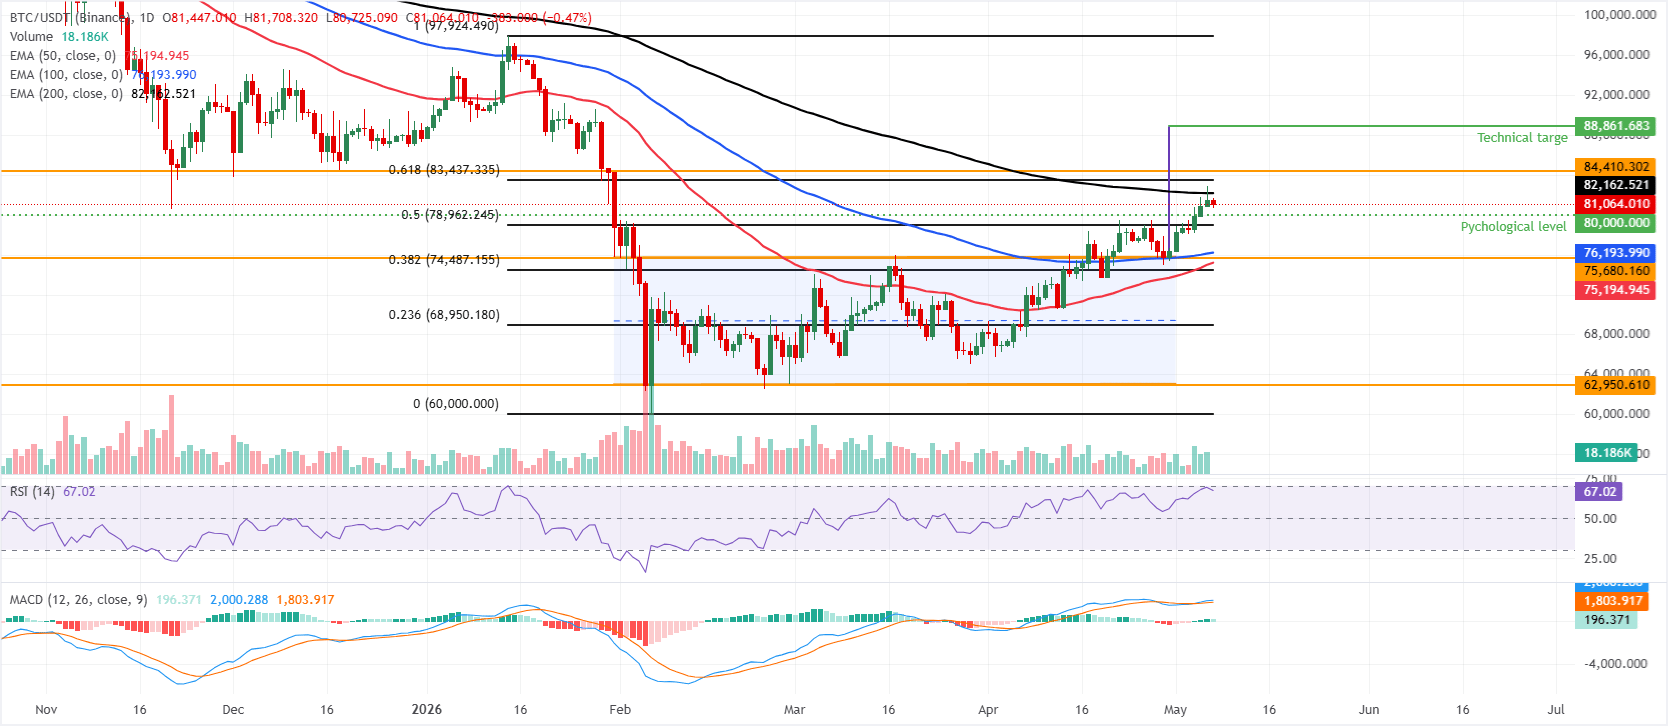
Bitcoin price is trading slightly down at $81,000 on Thursday after testing the key 200-day Exponential Moving Average (EMA) at $82,162 the previous day.
The Crypto King maintains a constructive bullish bias as it stays above the 50-day and 100-day EMAs, clustered around the mid-$70,000s, while probing the upper half of its horizontal channel.
The largest cryptocurrency by market capitalization is now sandwiched between nearby support at the psychologically important $80,000 level and overhead resistance from the 200-day EMA near $82,164, with the 61.8% Fibonacci retracement (drawn from January high to February low) at about $83,437 acting as a secondary cap.
Momentum remains positive, as the Relative Strength Index (RSI) on the daily chart hovers just below overbought territory near 67 and the Moving Average Convergence Divergence (MACD) prints above the zero line with a positive reading, hinting that buyers still retain the upper hand despite proximity to strong resistance.
On the downside, initial support is seen around $80,000, reinforced by the 50% retracement near $78,962, the 100-day EMA at roughly $76,193, the reclaimed channel top around $75,680, and the 50-day EMA near $75,194, to form a broader demand band.
On the topside, sustained gains face immediate resistance at the 200-day EMA around $82,162, followed by the 61.8% retracement at approximately $83,437, while a daily close above the horizontal barrier near $84,410 would strengthen the broader bullish structure and open the door to the channel breakout target at $88,861, measured as the channel’s width projected from the breakout point.
(The technical analysis of this story was written with the help of an AI tool.)
Bitcoin, altcoins, stablecoins FAQs
Bitcoin is the largest cryptocurrency by market capitalization, a virtual currency designed to serve as money. This form of payment cannot be controlled by any one person, group, or entity, which eliminates the need for third-party participation during financial transactions.
Altcoins are any cryptocurrency apart from Bitcoin, but some also regard Ethereum as a non-altcoin because it is from these two cryptocurrencies that forking happens. If this is true, then Litecoin is the first altcoin, forked from the Bitcoin protocol and, therefore, an “improved” version of it.
Stablecoins are cryptocurrencies designed to have a stable price, with their value backed by a reserve of the asset it represents. To achieve this, the value of any one stablecoin is pegged to a commodity or financial instrument, such as the US Dollar (USD), with its supply regulated by an algorithm or demand. The main goal of stablecoins is to provide an on/off-ramp for investors willing to trade and invest in cryptocurrencies. Stablecoins also allow investors to store value since cryptocurrencies, in general, are subject to volatility.
Bitcoin dominance is the ratio of Bitcoin's market capitalization to the total market capitalization of all cryptocurrencies combined. It provides a clear picture of Bitcoin’s interest among investors. A high BTC dominance typically happens before and during a bull run, in which investors resort to investing in relatively stable and high market capitalization cryptocurrency like Bitcoin. A drop in BTC dominance usually means that investors are moving their capital and/or profits to altcoins in a quest for higher returns, which usually triggers an explosion of altcoin rallies.
Recommended Articles


