


Crypto Today: Bitcoin, Ethereum, XRP struggle for direction amid US-Iran failed negotiations
- Bitcoin remains suppressed below $71,000 as weak sentiment and US-Iran failed negotiations weigh.
- Ethereum falters, with its upside capped at $2,200 amid fading retail demand.
- XRP faces a deteriorating technical structure, with major moving averages capping recovery attempts.
The cryptocurrency market remains on edge on Monday, weighed down by weak sentiment following the collapse of negotiations to end the war between the United States (US) and Iran over the weekend.
Bitcoin (BTC) reflects the risk-off mood, declining toward the pivotal $70,000 threshold. Altcoins, including Ethereum (ETH) and Ripple (XRP), paint a similar grim picture. Ethereum is struggling to find direction, trading below $2,200 while XRP hovers around $1.32.
US-Iran peace talks fail, weighing on crypto assets
The peace negotiations between the US and Iran in Pakistan failed, with both parties leaving Islamabad on Sunday with little to show for it. US Vice President JD Vance and Iranian officials said significant differences remain amid efforts to reach a deal that could bring peace to the Middle East.
“We leave here with a very simple proposal, a method of understanding that is our final and best offer. We’ll see if the Iranians accept it,” JD Vance stated in a press conference after the talks.
Despite the negotiations collapsing, the fragile ceasefire deal struck last week is still holding. Meanwhile, US President Donald Trump wrote on Truth Social that the US will blockade the Strait of Hormuz, halting all traffic in and out of Iranian ports through the key global shipping channel.
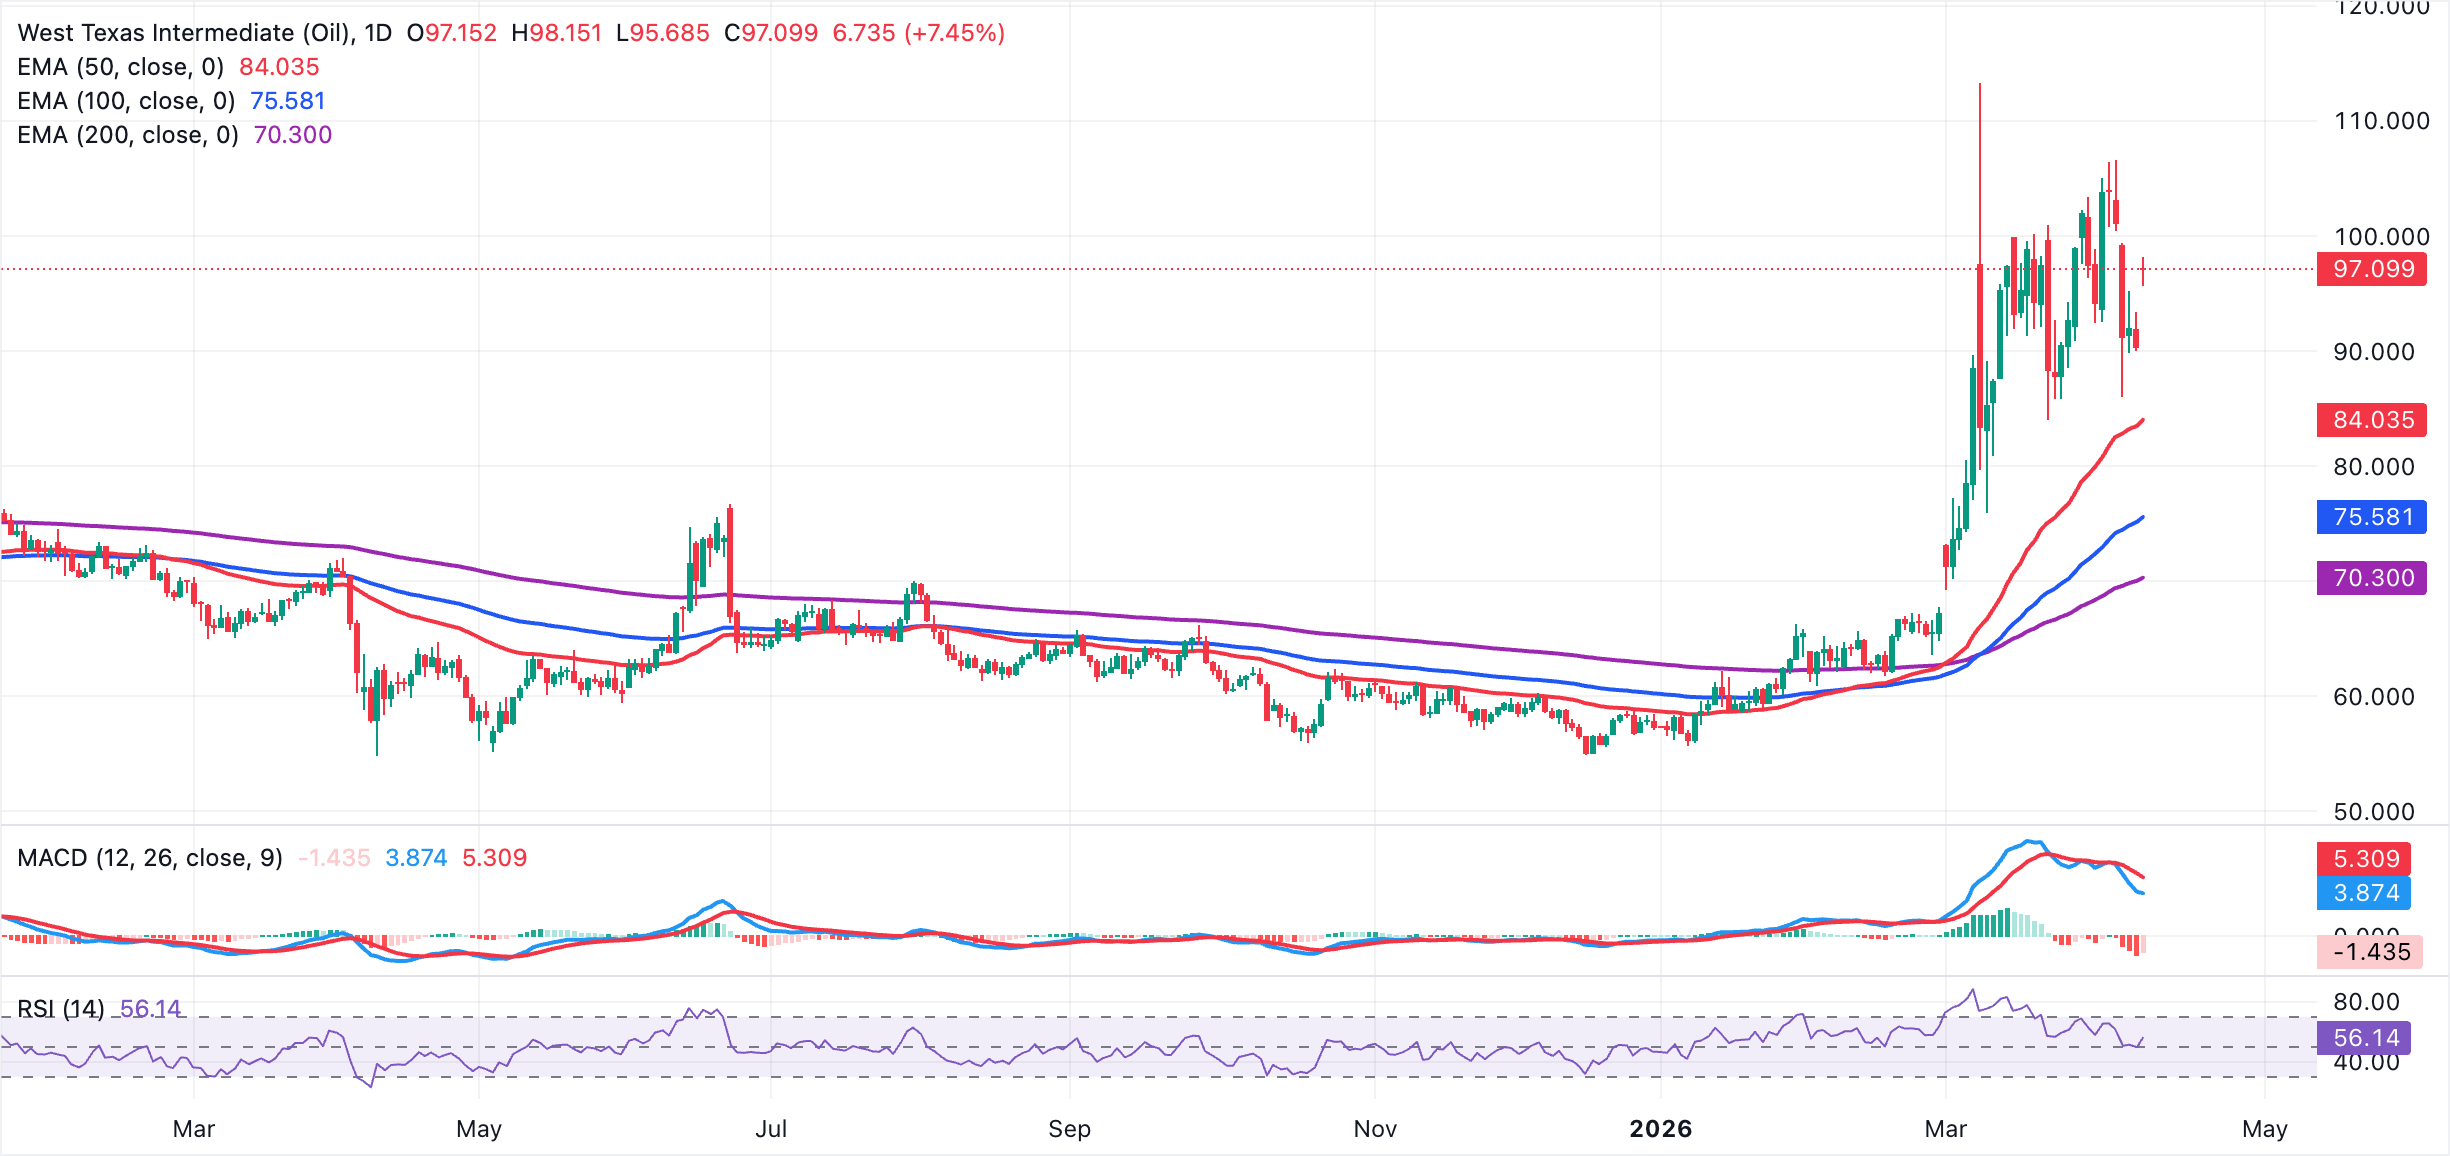
West Texas Intermediate (WTI) Oil prices surged, trading around $97.00 at the time of writing, up from roughly $86.00 on Wednesday. At least 20% of the world’s Oil and Gas supplies pass through the Strait of Hormuz, and its reopening could ease pressure on the global economy.
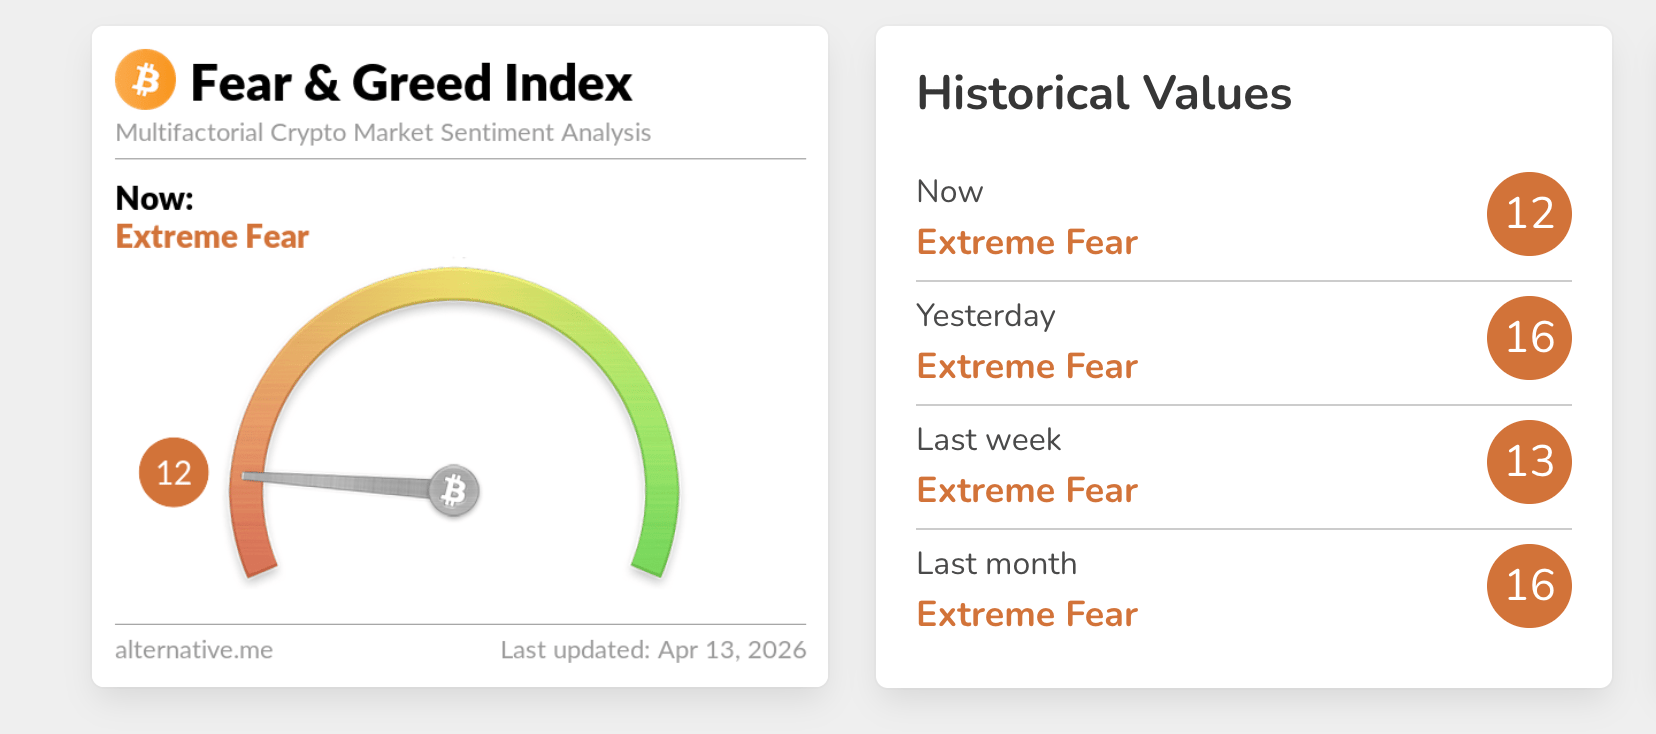
Meanwhile, sentiment across the crypto market remains significantly suppressed, as evidenced by the crypto Fear & Greed Index, which holds at 12 in the extreme fear territory on Monday, down from 16 the previous day. If this bearish mood persists, crypto prices could struggle to sustain their recovery, leading to frequent pullbacks.
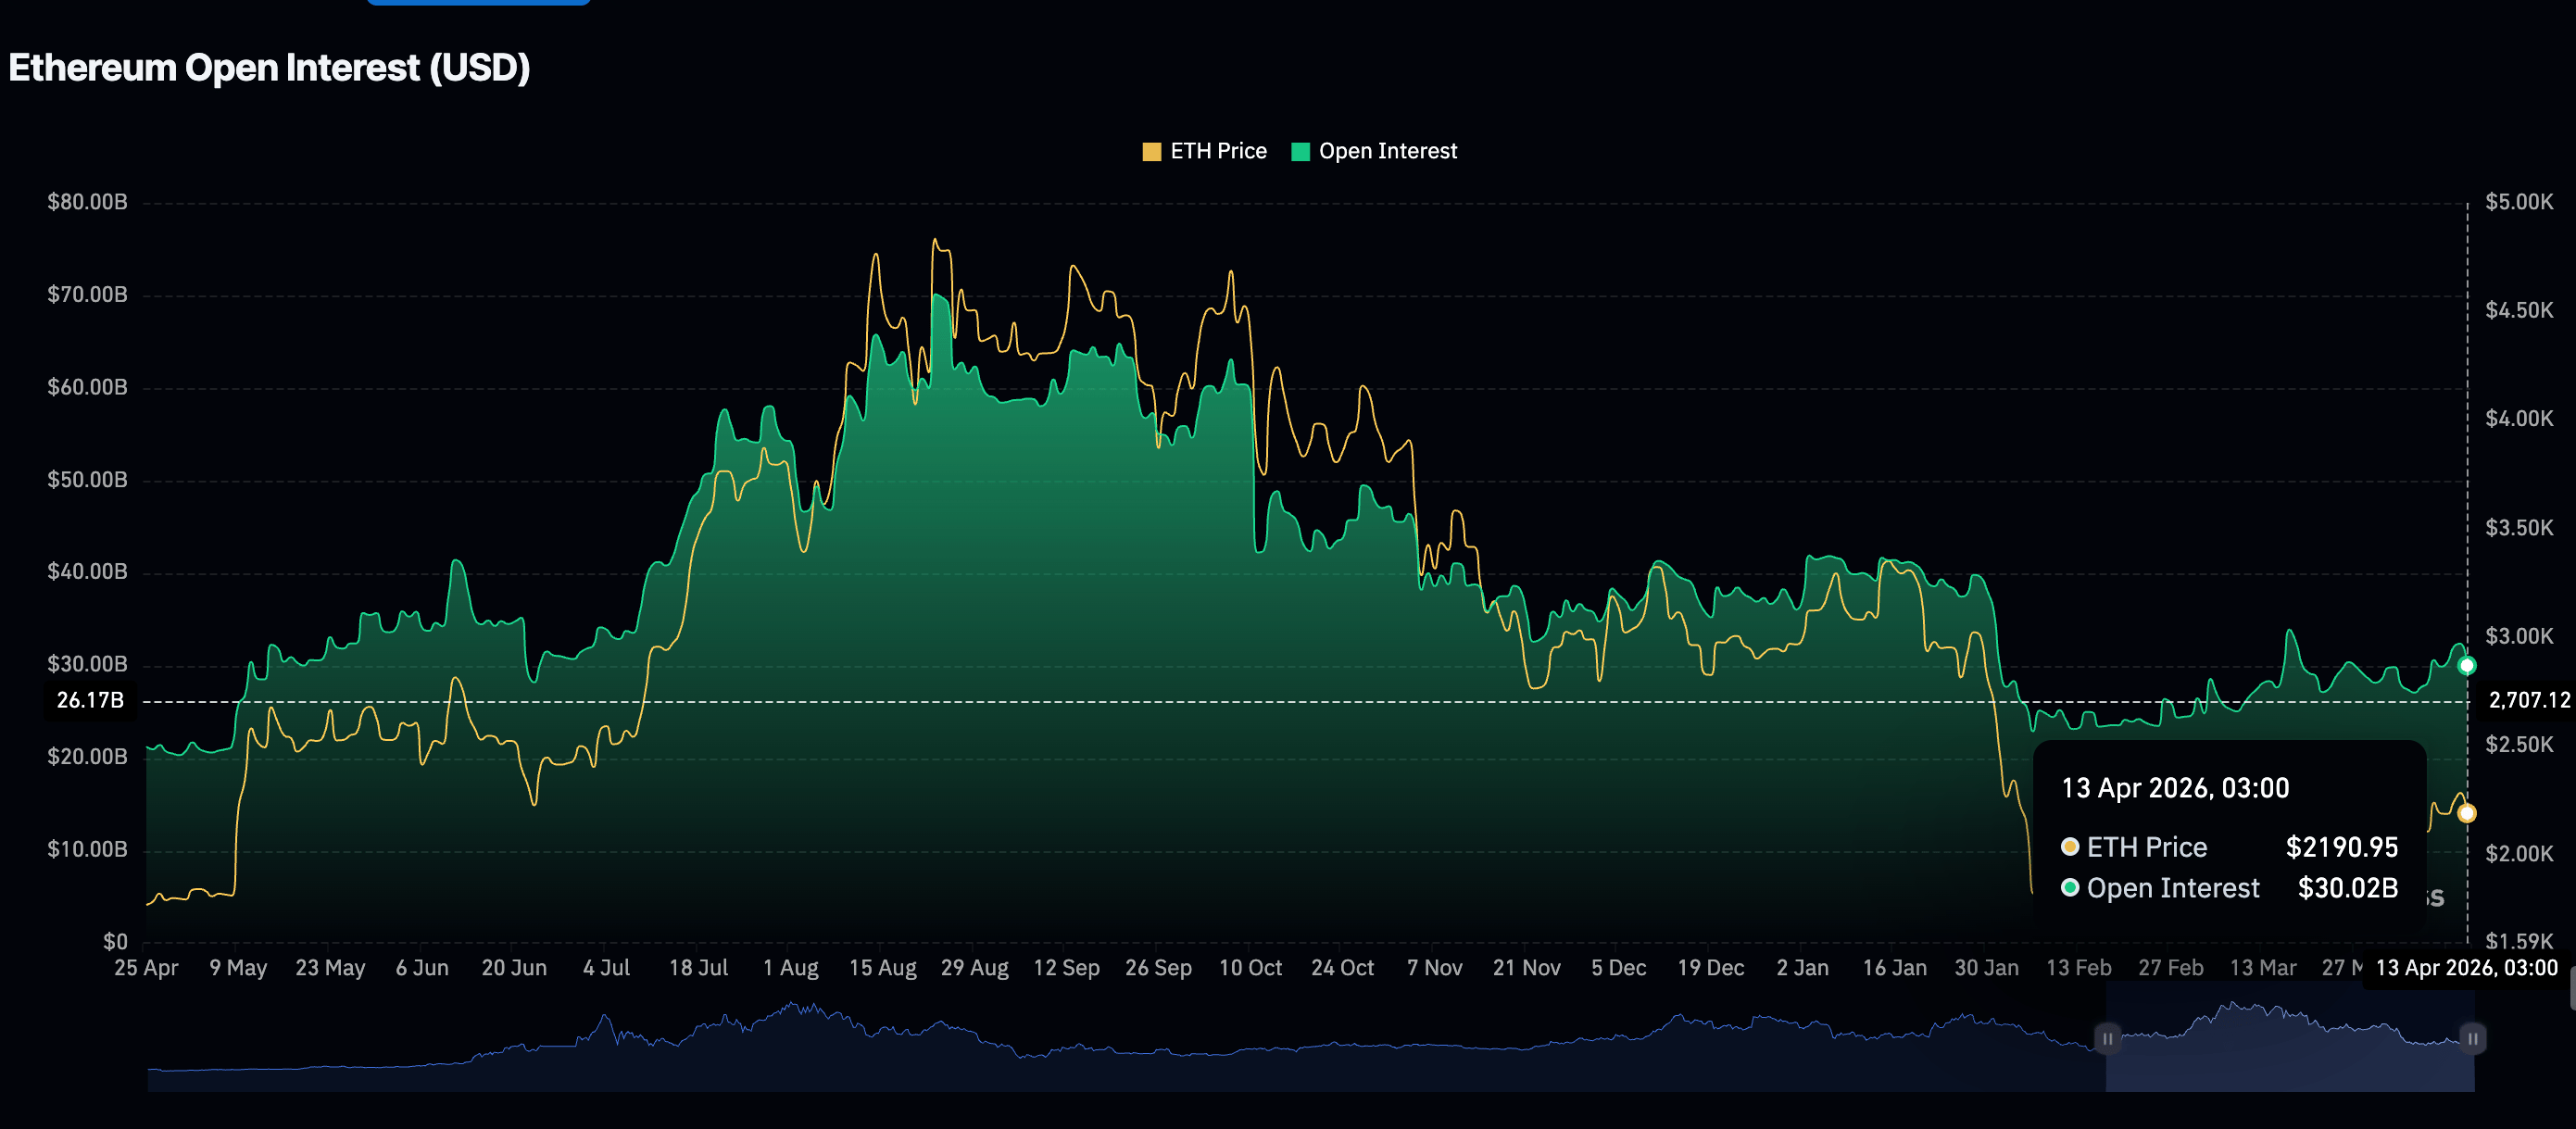
Meanwhile, retail interest in Ethereum has generally sustained a bearish outlook, with Open Interest (OI), which reflects the notional value of outstanding futures contracts, falling to roughly $30.00 billion on Monday from $32.27 billion the previous day.
Similarly, retail demand for XRP derivatives continues to fade, as futures OI averages $2.38 billion on Monday, compared to $2.48 billion the previous day. A persistent decline in the OI suggests that investors are losing conviction in XRP’s ability to sustain recovery and are unwilling to open new positions.
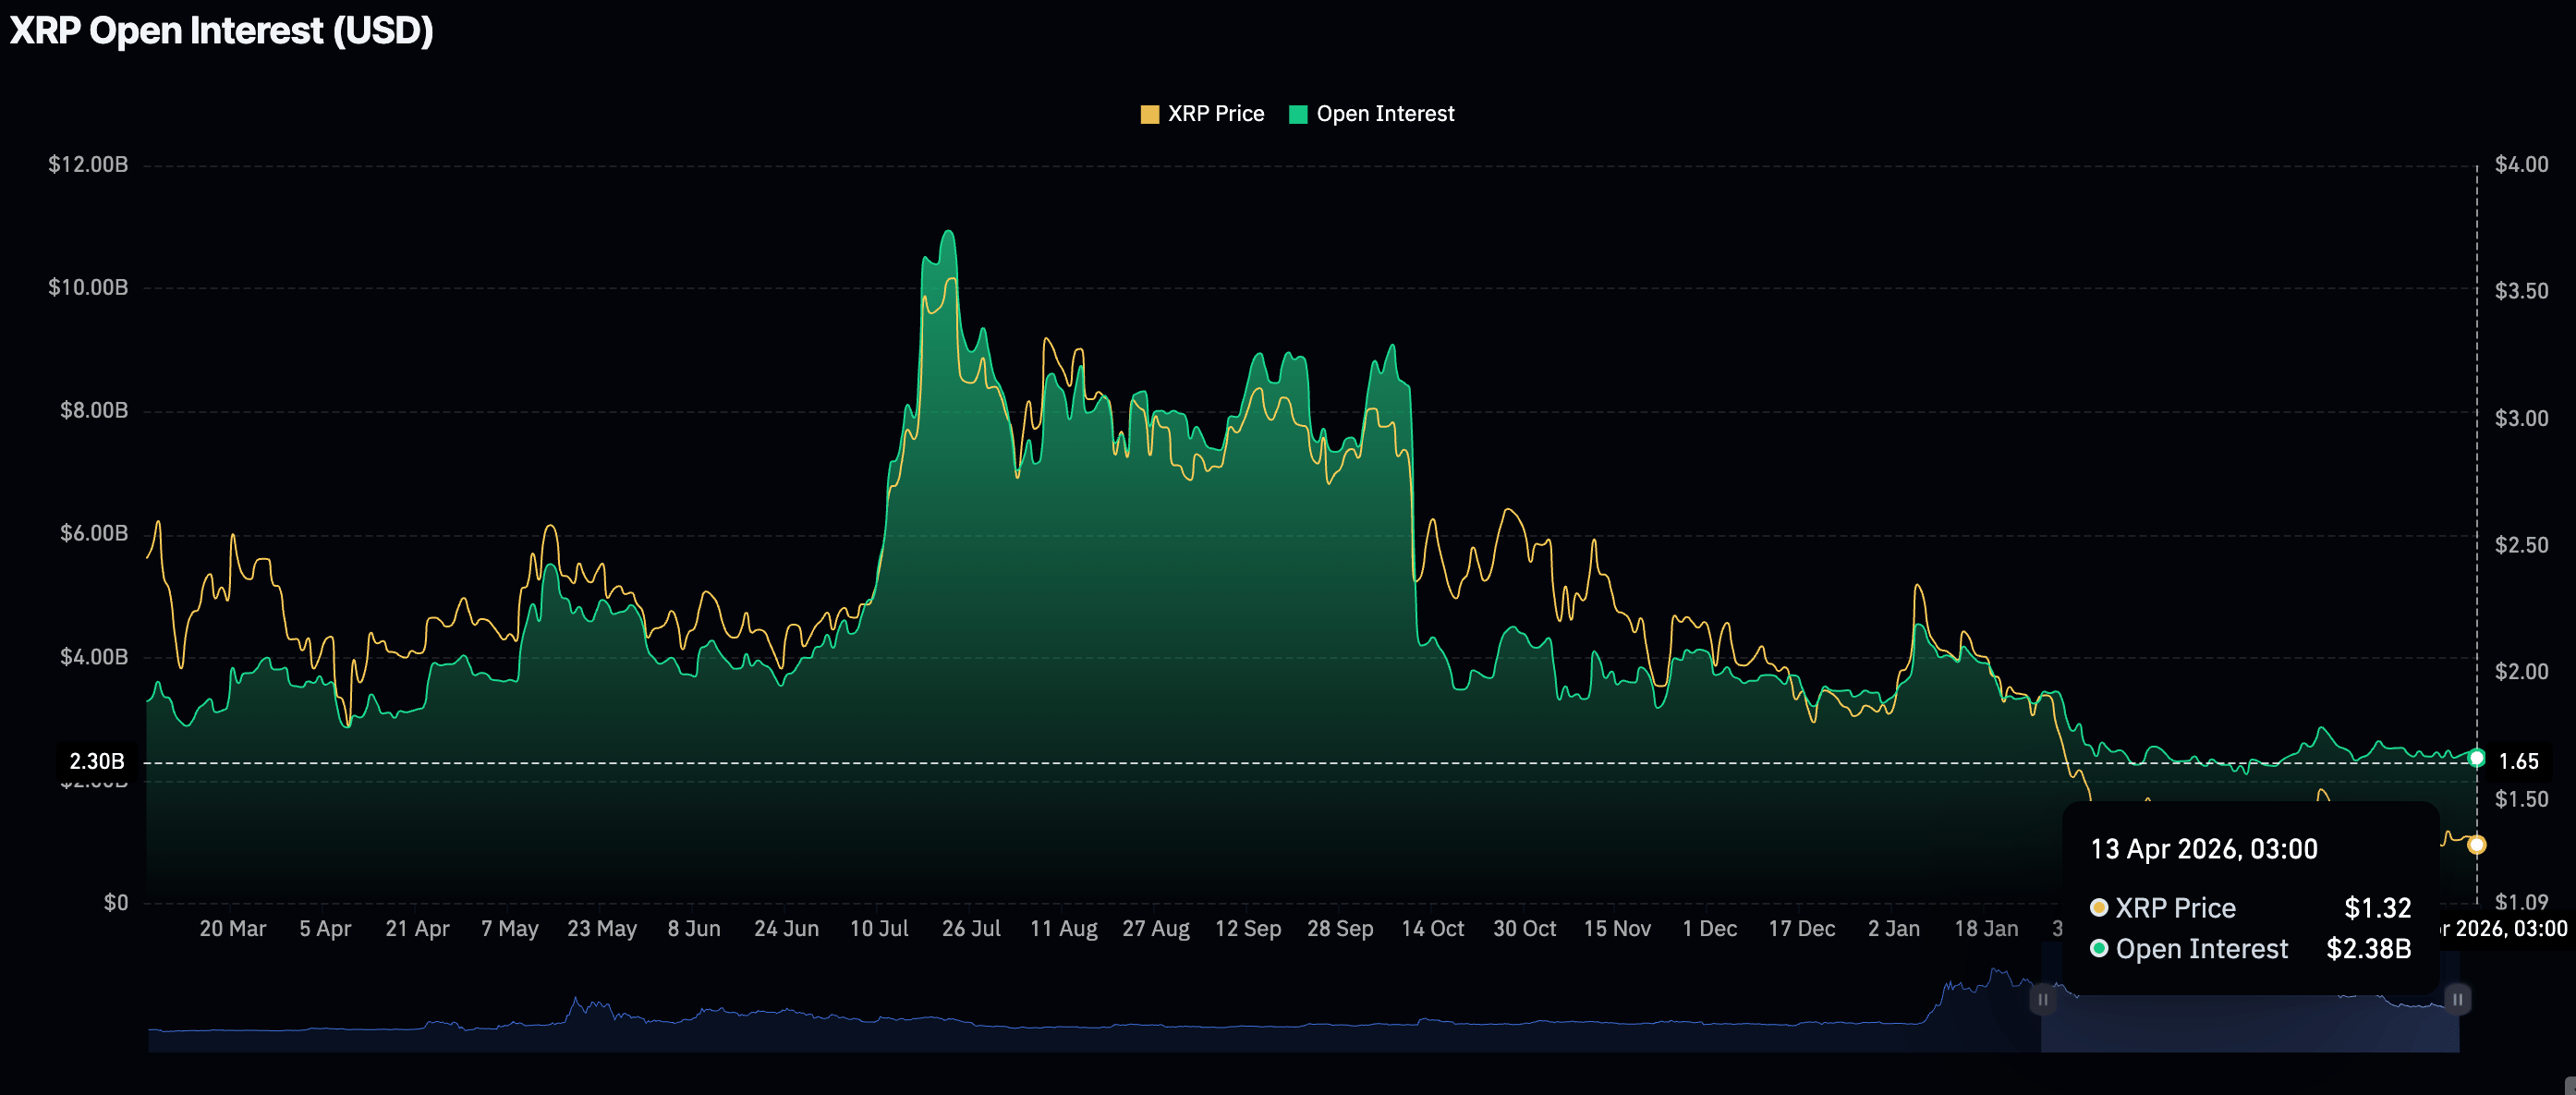
Chart of the day: Bitcoin holds key support
Bitcoin trades at $70,805, holding just above the 50-day Exponential Moving Average (EMA) at $70,737, which lends initial directional support but leaves the price capped beneath the higher 100-day and 200-day EMAs. The Moving Average Convergence Divergence (MACD) histogram remains positive, with the line staying above zero on the daily chart, hinting at a still constructive underlying momentum tone. At the same time, the Relative Strength Index (RSI) around 53 sits in neutral territory on the same chart, suggesting only a modest bullish bias as long as price defends the 50-day EMA.
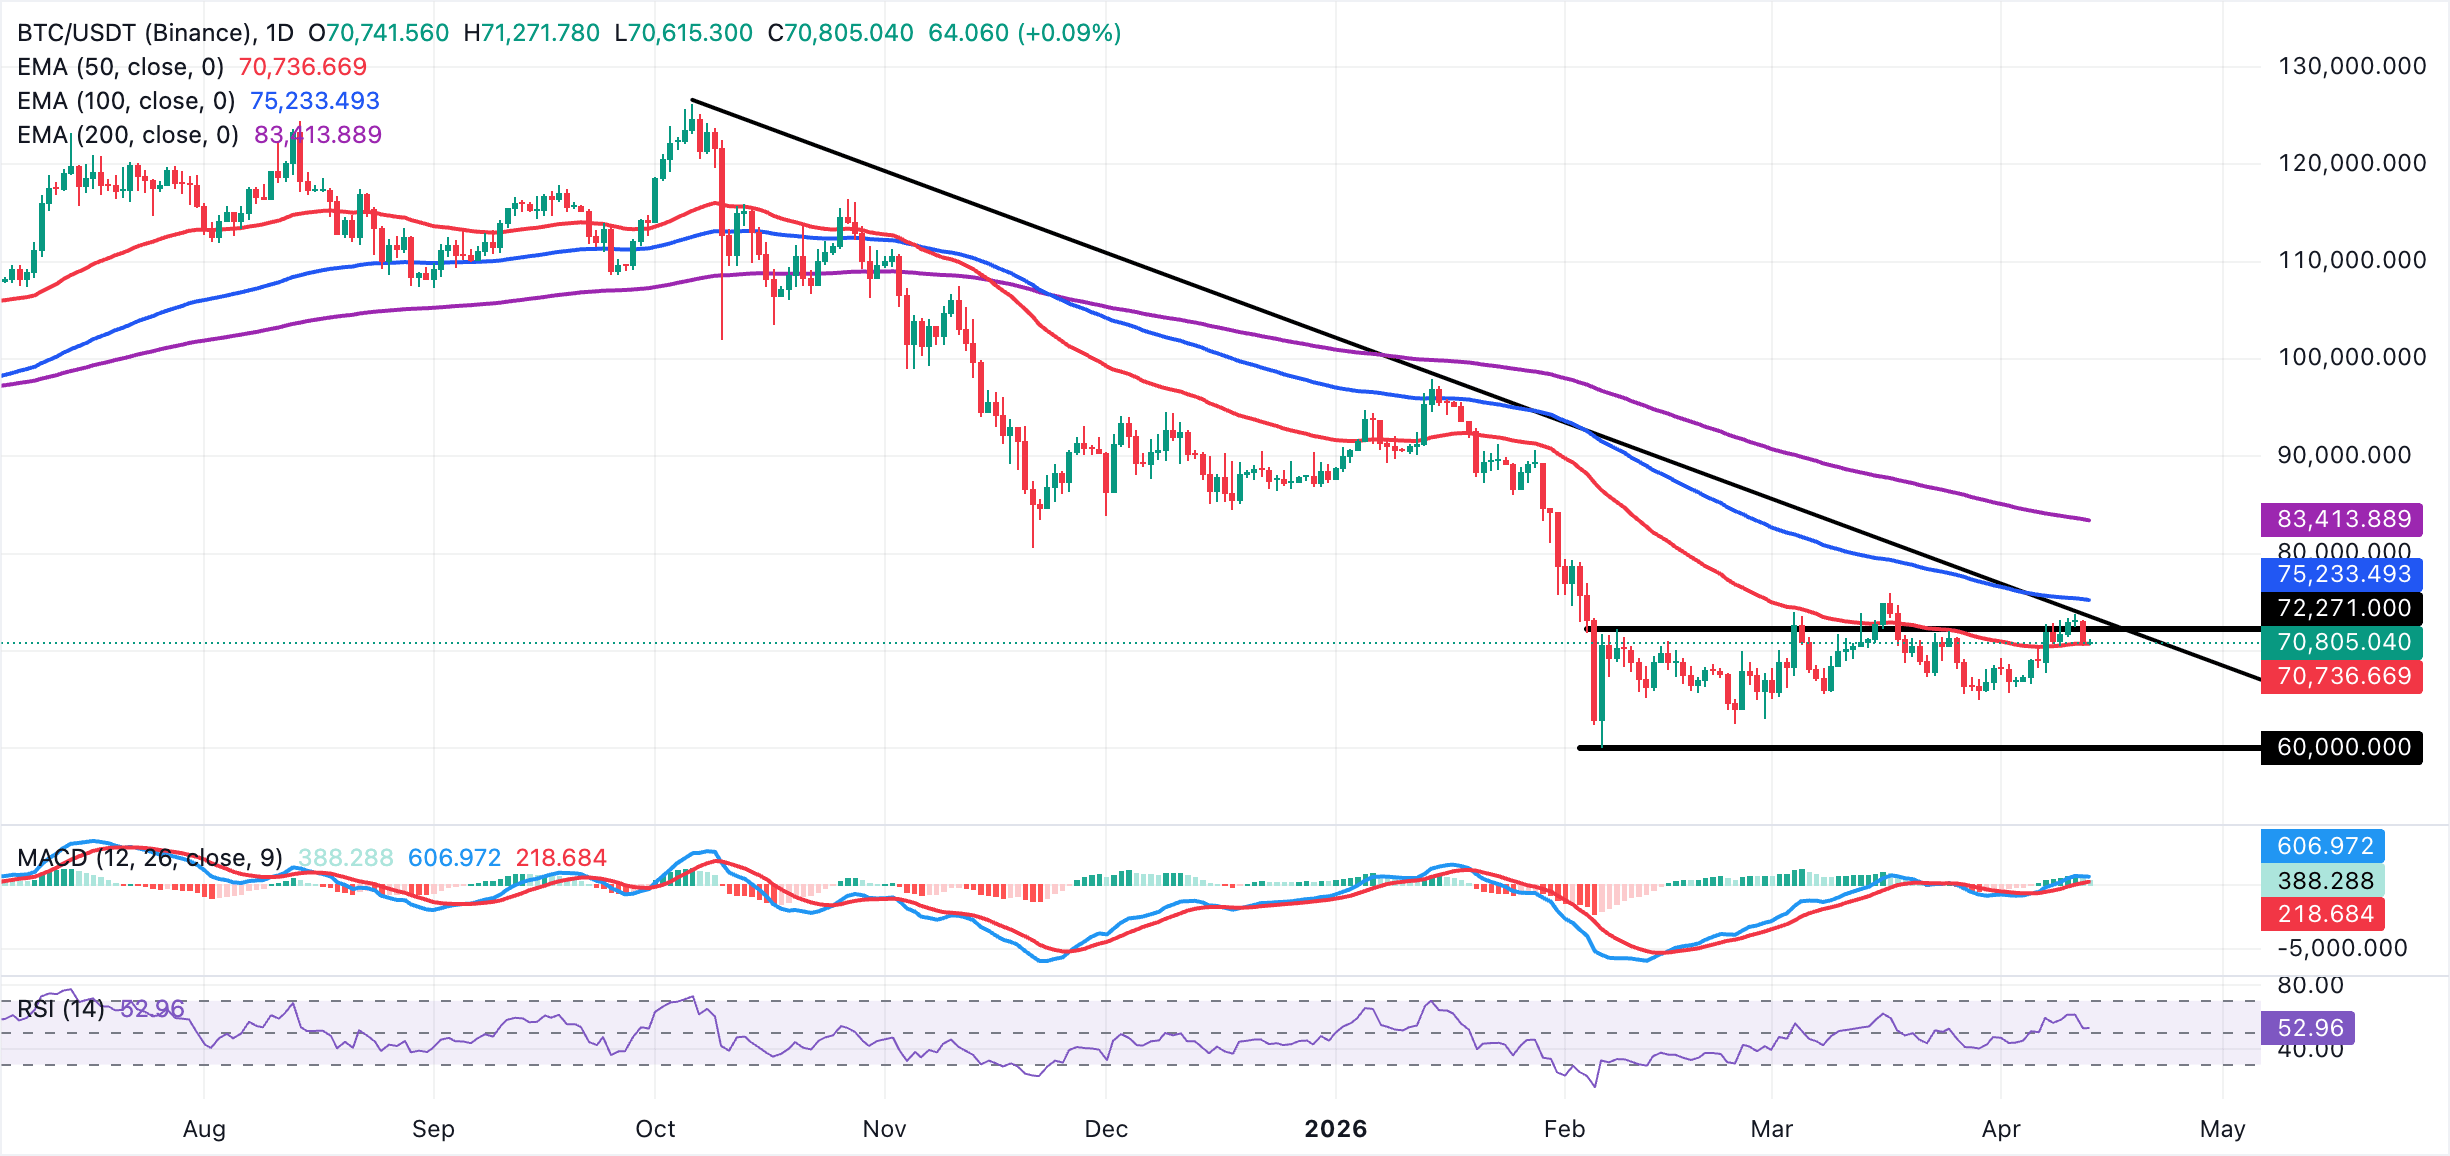
On the topside, immediate resistance emerges at the former downward-trendline break area around $73,448, with the 100-day EMA following higher at $75,233 and the 200-day EMA much further up toward $83,414, collectively forming a broader supply band on advances. On the downside, the primary support is the 50-day EMA at $70,737. A daily close below that level would weaken the current constructive outlook and expose BTC to deeper corrective pressure.
Altcoins technical outlook: Ethereum and XRP upside remains limited
Ethereum trades at $2,185, keeping a corrective-to-bearish near-term bias as it holds under the 100-day and 200-day EMAs at roughly $2,353 and $2,677, respectively. The price remains marginally above the 50-day EMA at $2,163, which offers initial dynamic support. At the same time, the long-standing downward resistance trend line, with a break level near $2,314, continues to cap the topside.
Meanwhile, a positive MACD reading above zero on the daily chart and the RSI around 54 hint at modest bullish momentum, but this remains constrained by the dominant overhead averages.
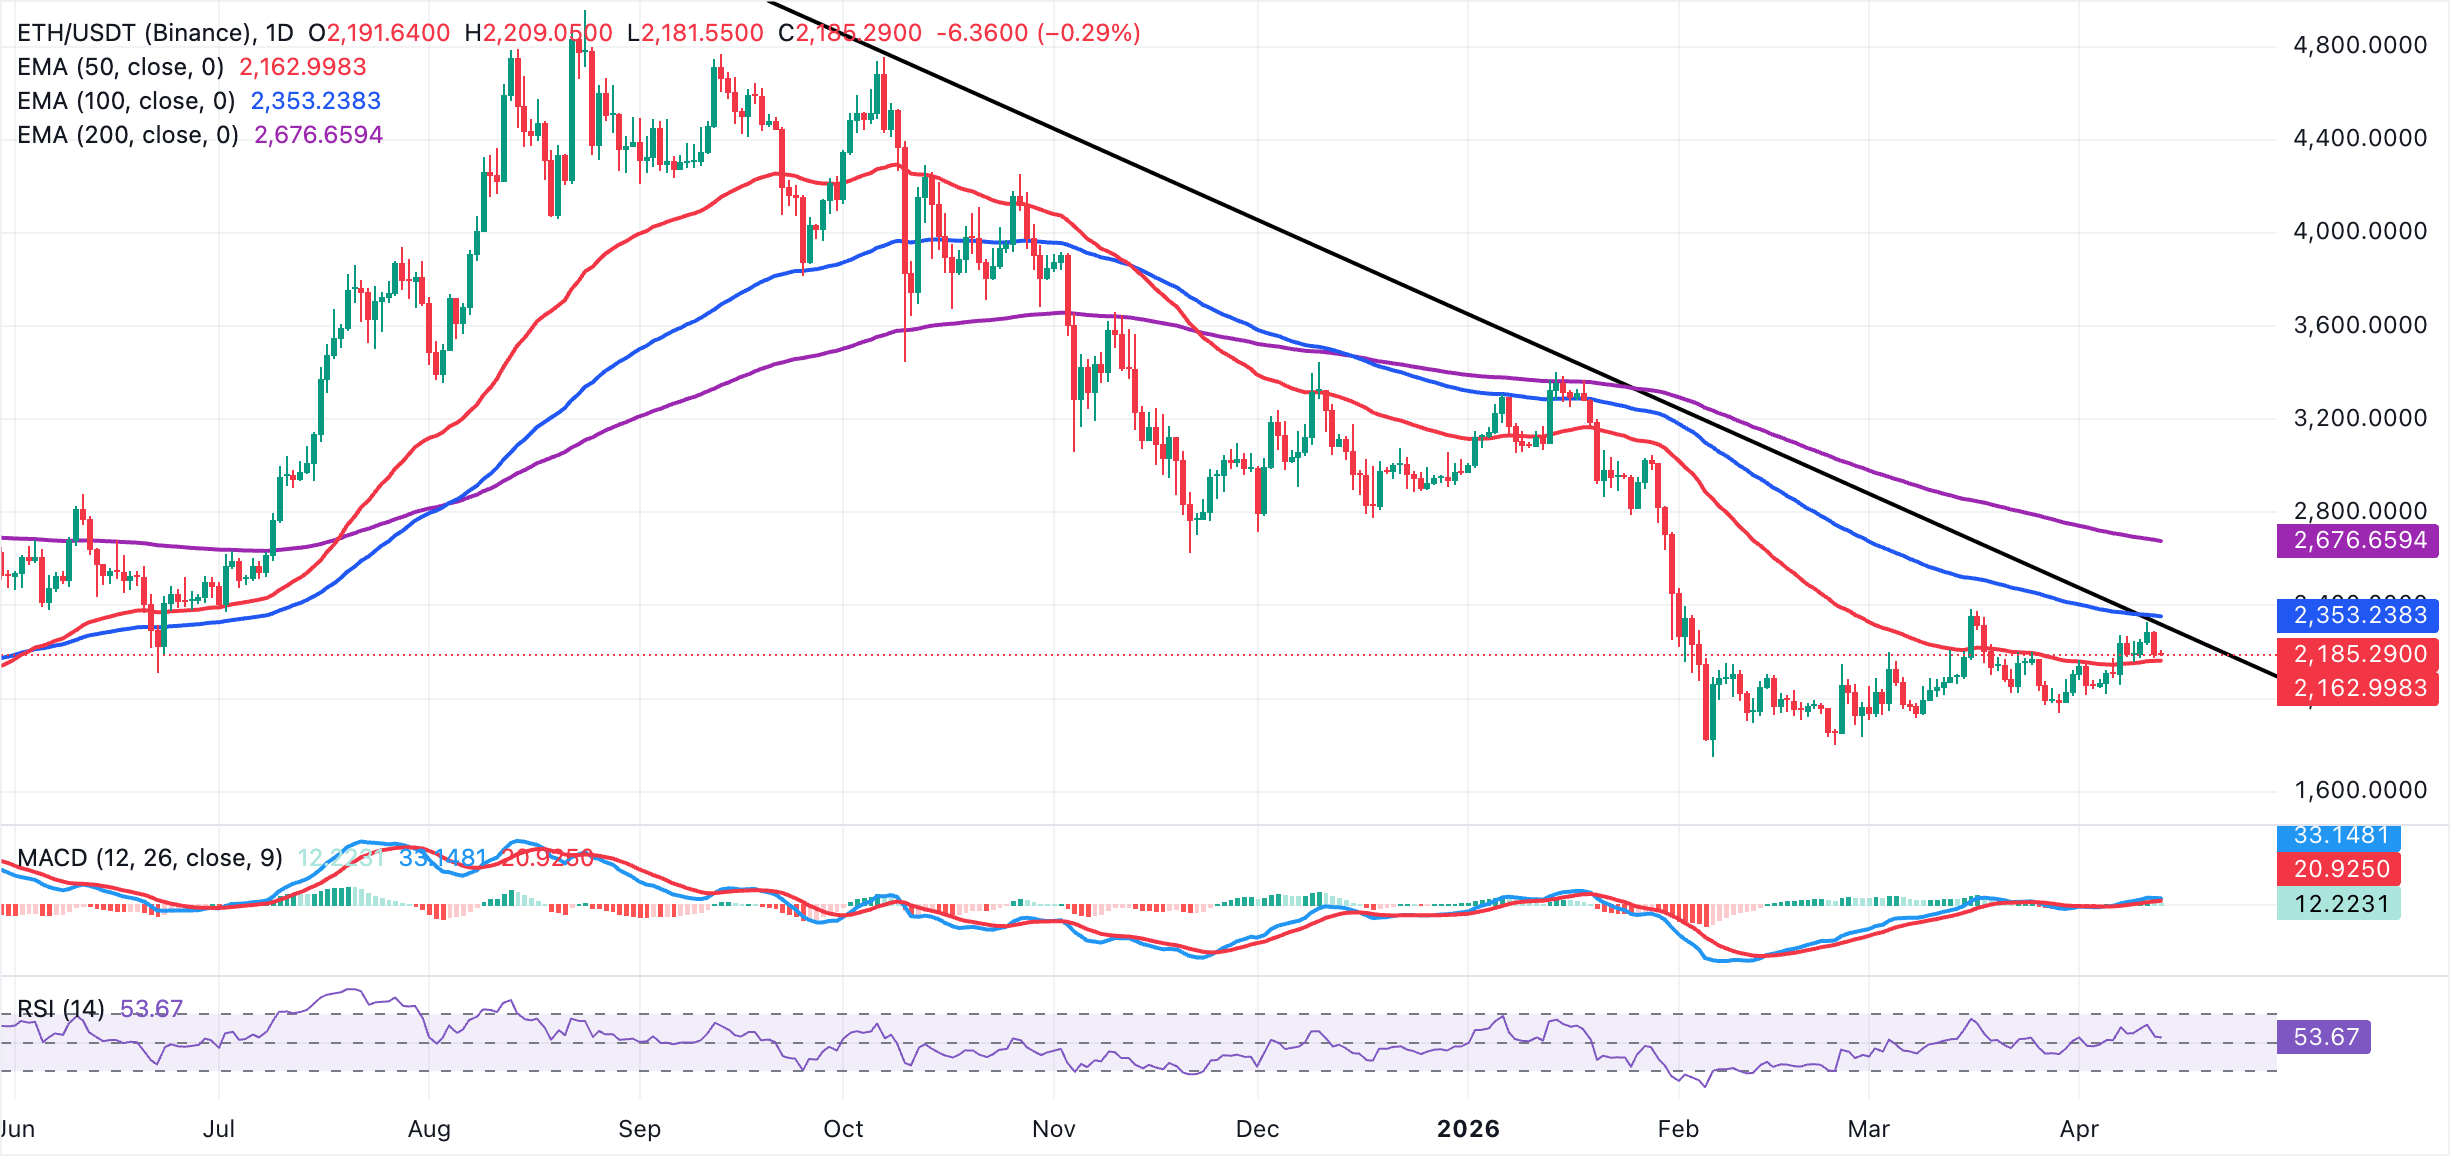
On the topside, Ethereum's immediate resistance is seen at the descending trendline break zone around $2,314, followed by the 100-day EMA at $2,353. A sustained move above these would be needed to ease downside pressure before the more distant 200-day EMA near $2,677 comes into view. On the downside, the 50-day EMA at $2,163 serves as the first important support. A daily close below this level would expose a deeper retracement, leaving ETH vulnerable to renewed selling while it trades beneath the higher EMAs.
As for XRP, the price trades at $1.32, keeping a bearish near-term bias, as it remains entrenched below the 50-day, 100-day, and 200-day EMAs at $1.41, $1.56, and $1.81, respectively. The long-standing downward resistance trendline, whose break level sits near $1.74, reinforces the broader descending structure.
Meanwhile, the RSI is around 43 on the daily chart, and a marginally positive but flat MACD hints at subdued momentum rather than an imminent bullish reversal.
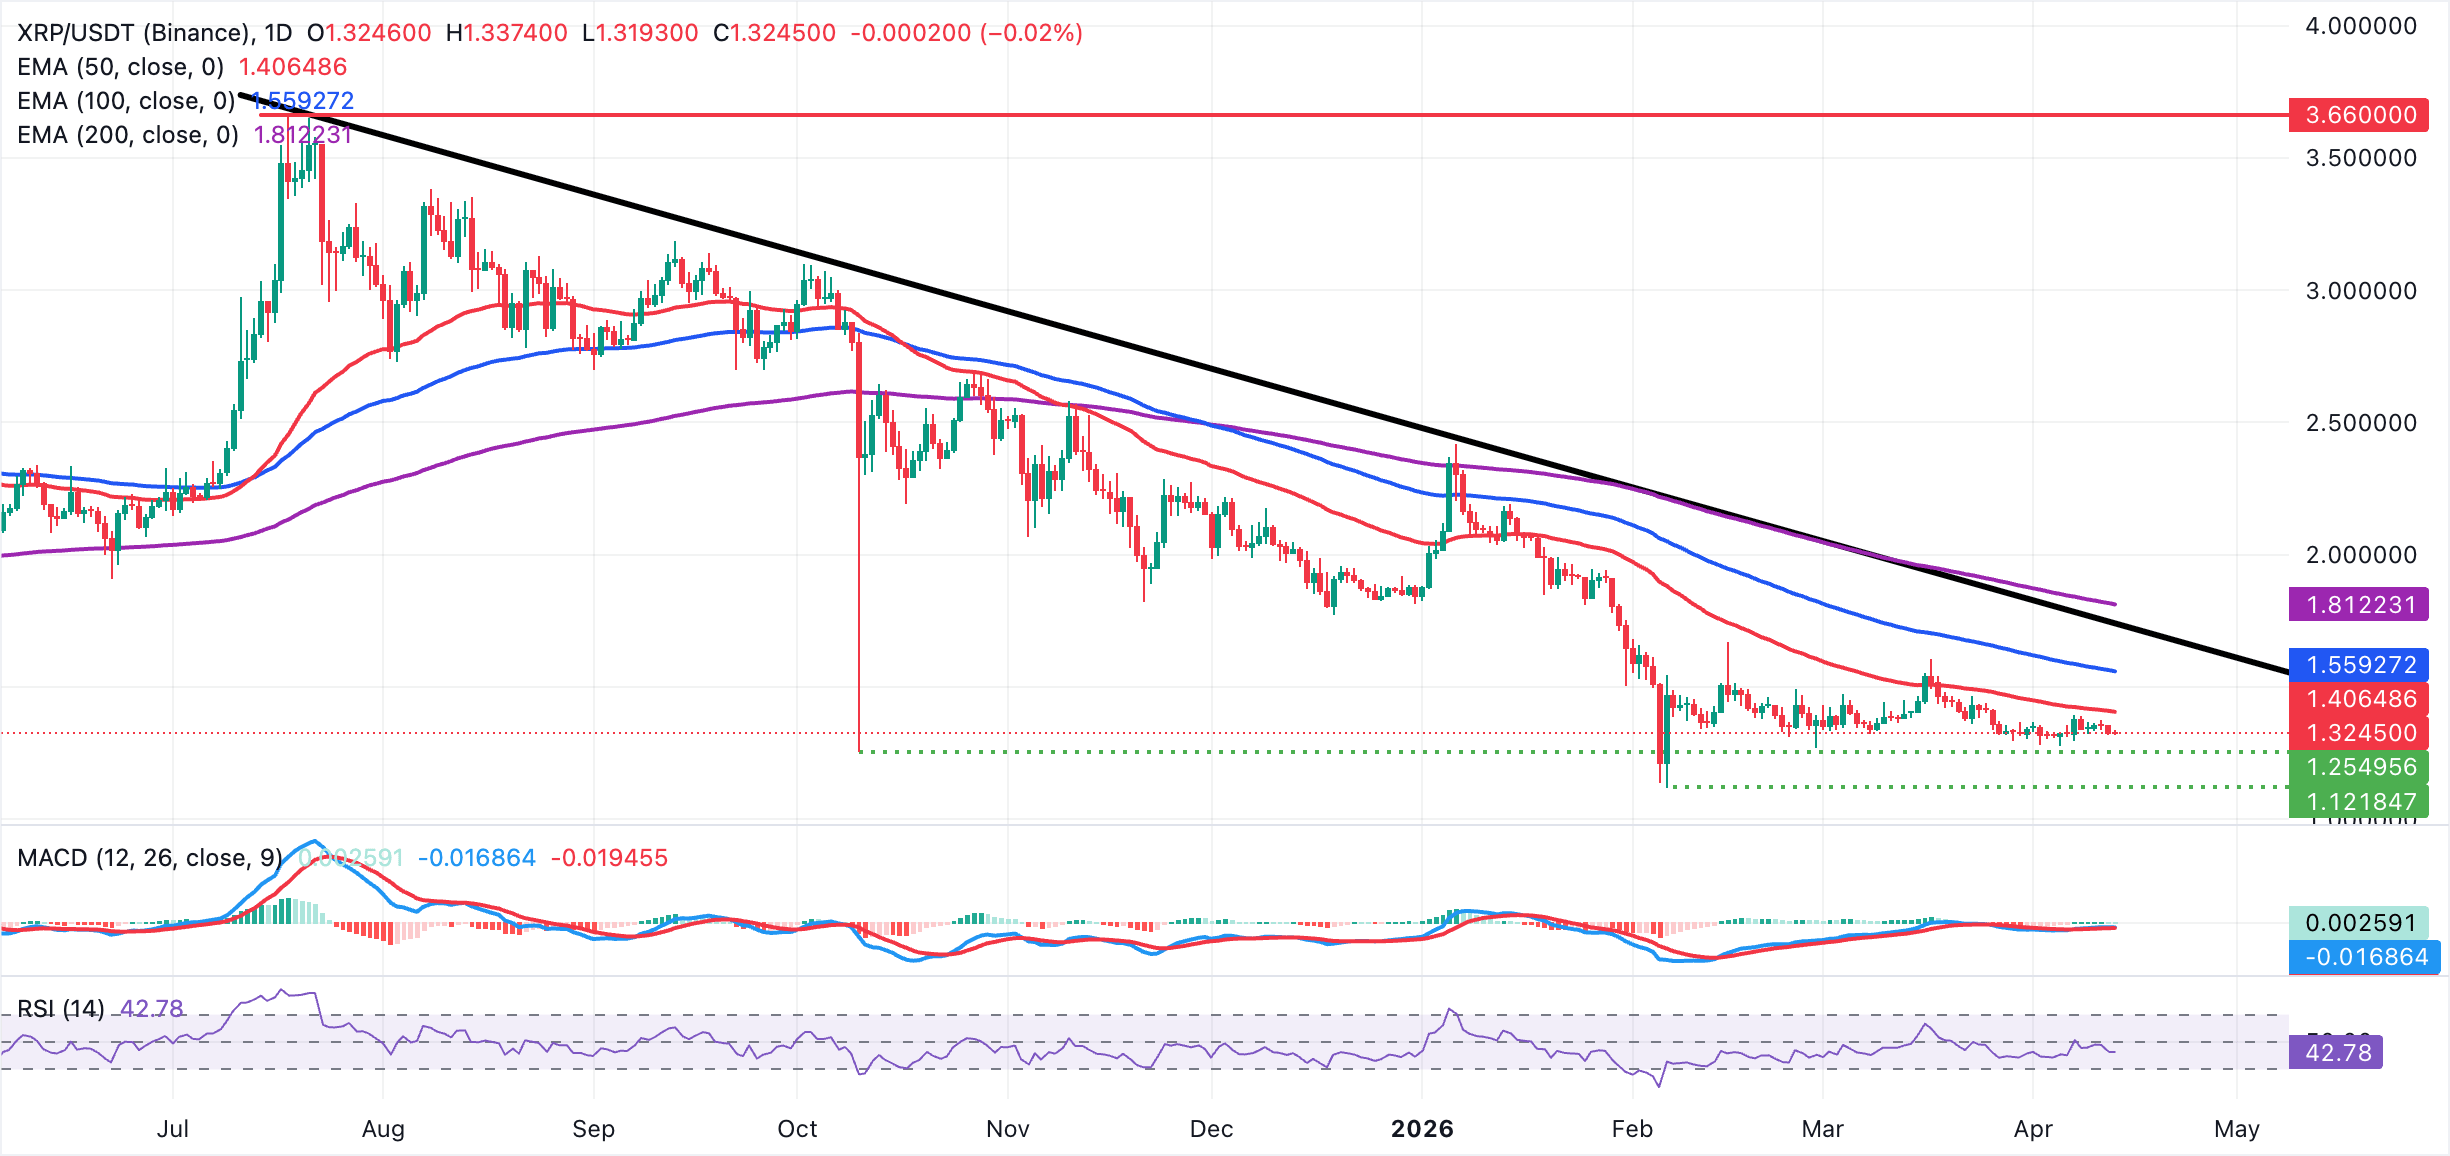
On the topside, initial resistance lies at the 50-day EMA around $1.41. A daily close above this barrier would be needed to ease immediate downside pressure and open the way toward the 100-day EMA near $1.56. Further north, the descending resistance trend line near $1.74 precedes the 200-day EMA around $1.81, which together define a stronger medium-term supply zone that bulls would have to reclaim to challenge the prevailing bearish structure.
Cryptocurrency prices FAQs
Token launches influence demand and adoption among market participants. Listings on crypto exchanges deepen the liquidity for an asset and add new participants to an asset’s network. This is typically bullish for a digital asset.
A hack is an event in which an attacker captures a large volume of the asset from a DeFi bridge or hot wallet of an exchange or any other crypto platform via exploits, bugs or other methods. The exploiter then transfers these tokens out of the exchange platforms to ultimately sell or swap the assets for other cryptocurrencies or stablecoins. Such events often involve an en masse panic triggering a sell-off in the affected assets.
Macroeconomic events like the US Federal Reserve’s decision on interest rates influence crypto assets mainly through the direct impact they have on the US Dollar. An increase in interest rate typically negatively influences Bitcoin and altcoin prices, and vice versa. If the US Dollar index declines, risk assets and associated leverage for trading gets cheaper, in turn driving crypto prices higher.
Halvings are typically considered bullish events as they slash the block reward in half for miners, constricting the supply of the asset. At consistent demand if the supply reduces, the asset’s price climbs.
(The technical analysis of this story was written with the help of an AI tool.)
Recommended Articles


