

Crypto Today: Bitcoin, Ethereum, XRP extend recovery despite ETF outflows, low retail demand
- Bitcoin edges higher, backed by positive sentiment after US President Trump signed a bill ending the government shutdown.
- Ethereum bulls regain control, reclaiming $3,500 despite steady ETF outflows.
- XRP gains momentum above $2.50, shrugging off low retail demand with Open Interest below $4 billion.
Bitcoin (BTC) is trading above $103,000 at the time of writing on Thursday, as bulls tighten their grip on the broader cryptocurrency market. Altcoins, including Ethereum (ETH) and Ripple (XRP), are also in the green, hovering above $3,500 and $2.50, respectively.
Meanwhile, interest in the cryptocurrency market remains relatively low, especially with institutional investors' demand for Exchange Traded Funds (ETFs) cooling. Retail demand has also been on the back foot since the October 10 deleveraging event, which saw over $19 billion in crypto assets liquidated in a single day.
However, sentiment is poised to improve after US President Donald Trump signed legislation ending the longest government shutdown in the history of the country.
Trump stated that the US "can never let this happen again," adding, "This is no way to run a country." Markets, including crypto, are edging higher as investors react positively to the news.
Data spotlight: Bitcoin, Ethereum rise despite ETF outflows
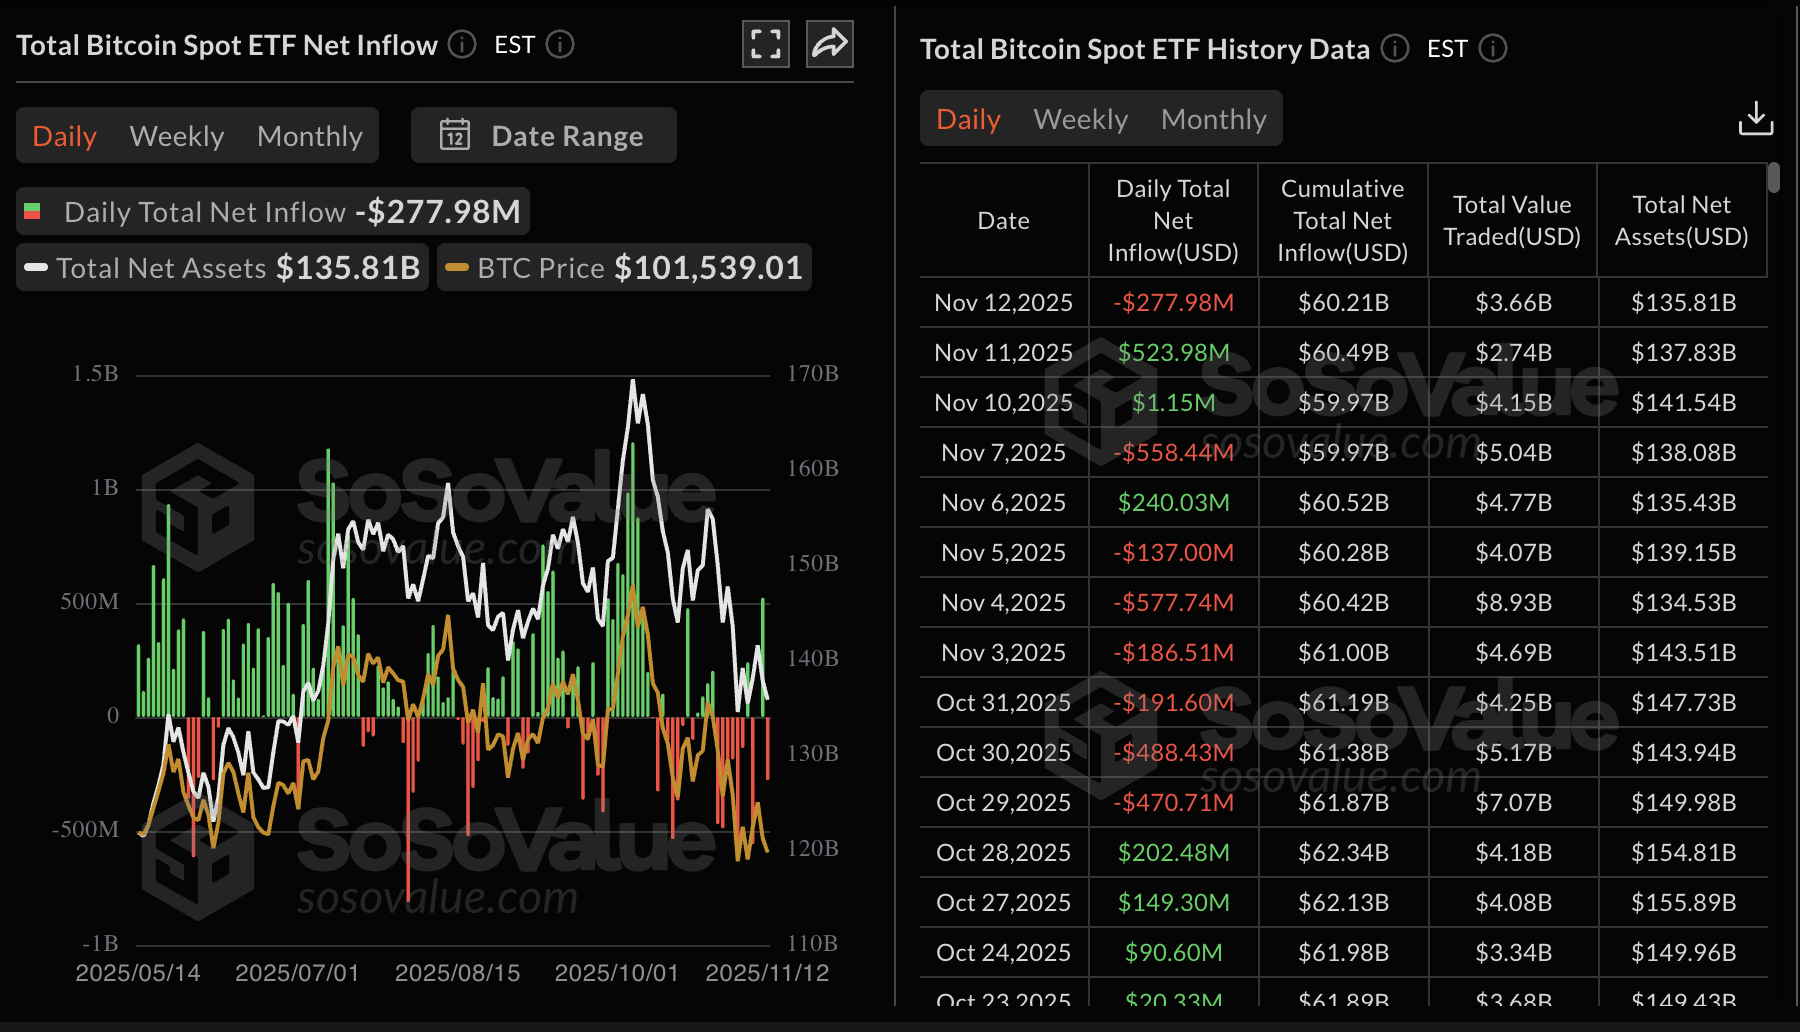
Institutional demand for Bitcoin has been erratic this week as investors navigated macroeconomic uncertainty amid the extended US government shutdown.
According to SoSoValue data, US-listed ETFs experienced outflows of approximately $278 million on Wednesday, breaking a two-day bullish streak. Inflows on Tuesday totalled $524 million, and on Monday, $1.15 million.
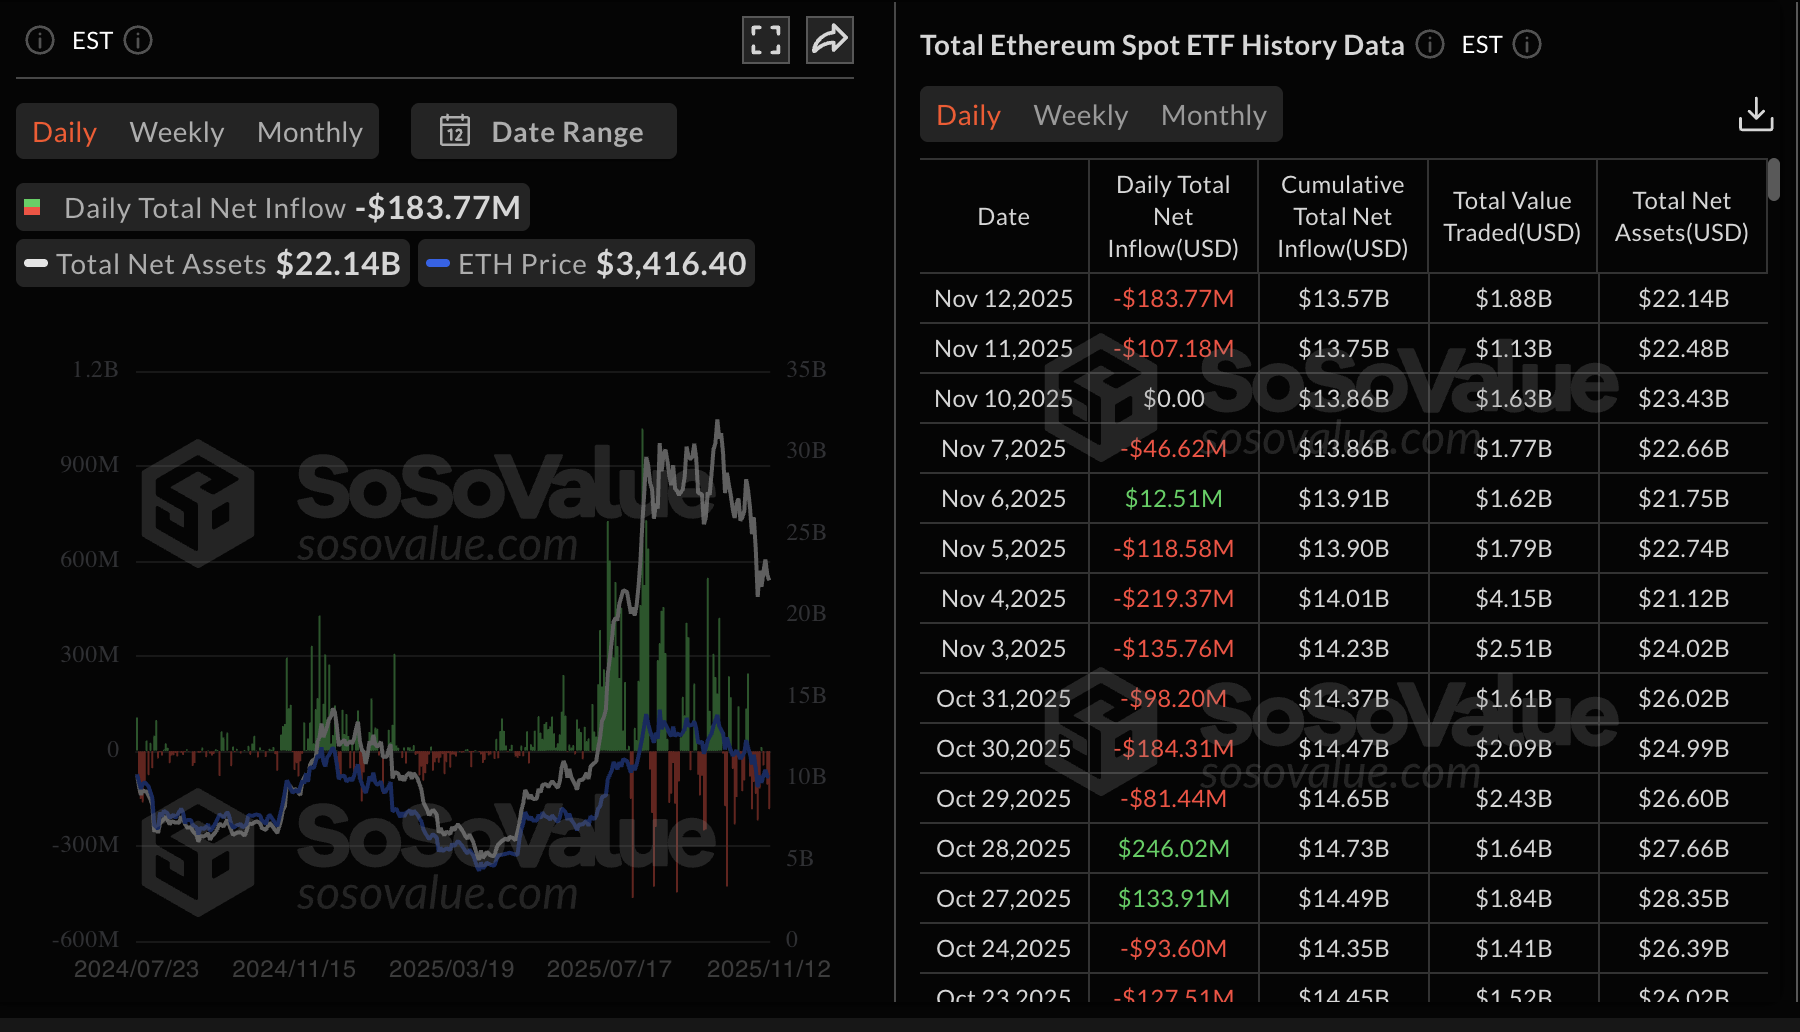
Ethereum ETFs extended their outflow streak, with approximately $184 million withdrawn from US-listed products on Wednesday. ETF outflows on Tuesday totaled $107 million, while Monday saw zero flows.
ETFs have become a key indicator of investor interest, with risk-off sentiment characterised by persistent outflows.
Meanwhile, retail demand for XRP has not picked up following the October 10 deleveraging event. CoinGlass data on the XRP derivatives market shows the futures Open Interest (OI) averaging $3.67 billion on Thursday, down from $3.95 billion the previous day and $8.36 billion on October 10.
A steady increase in OI is required to support XRP's short-term recovery, indicating that investors have confidence in the token and the ecosystem and are willing to increase their risk exposure.
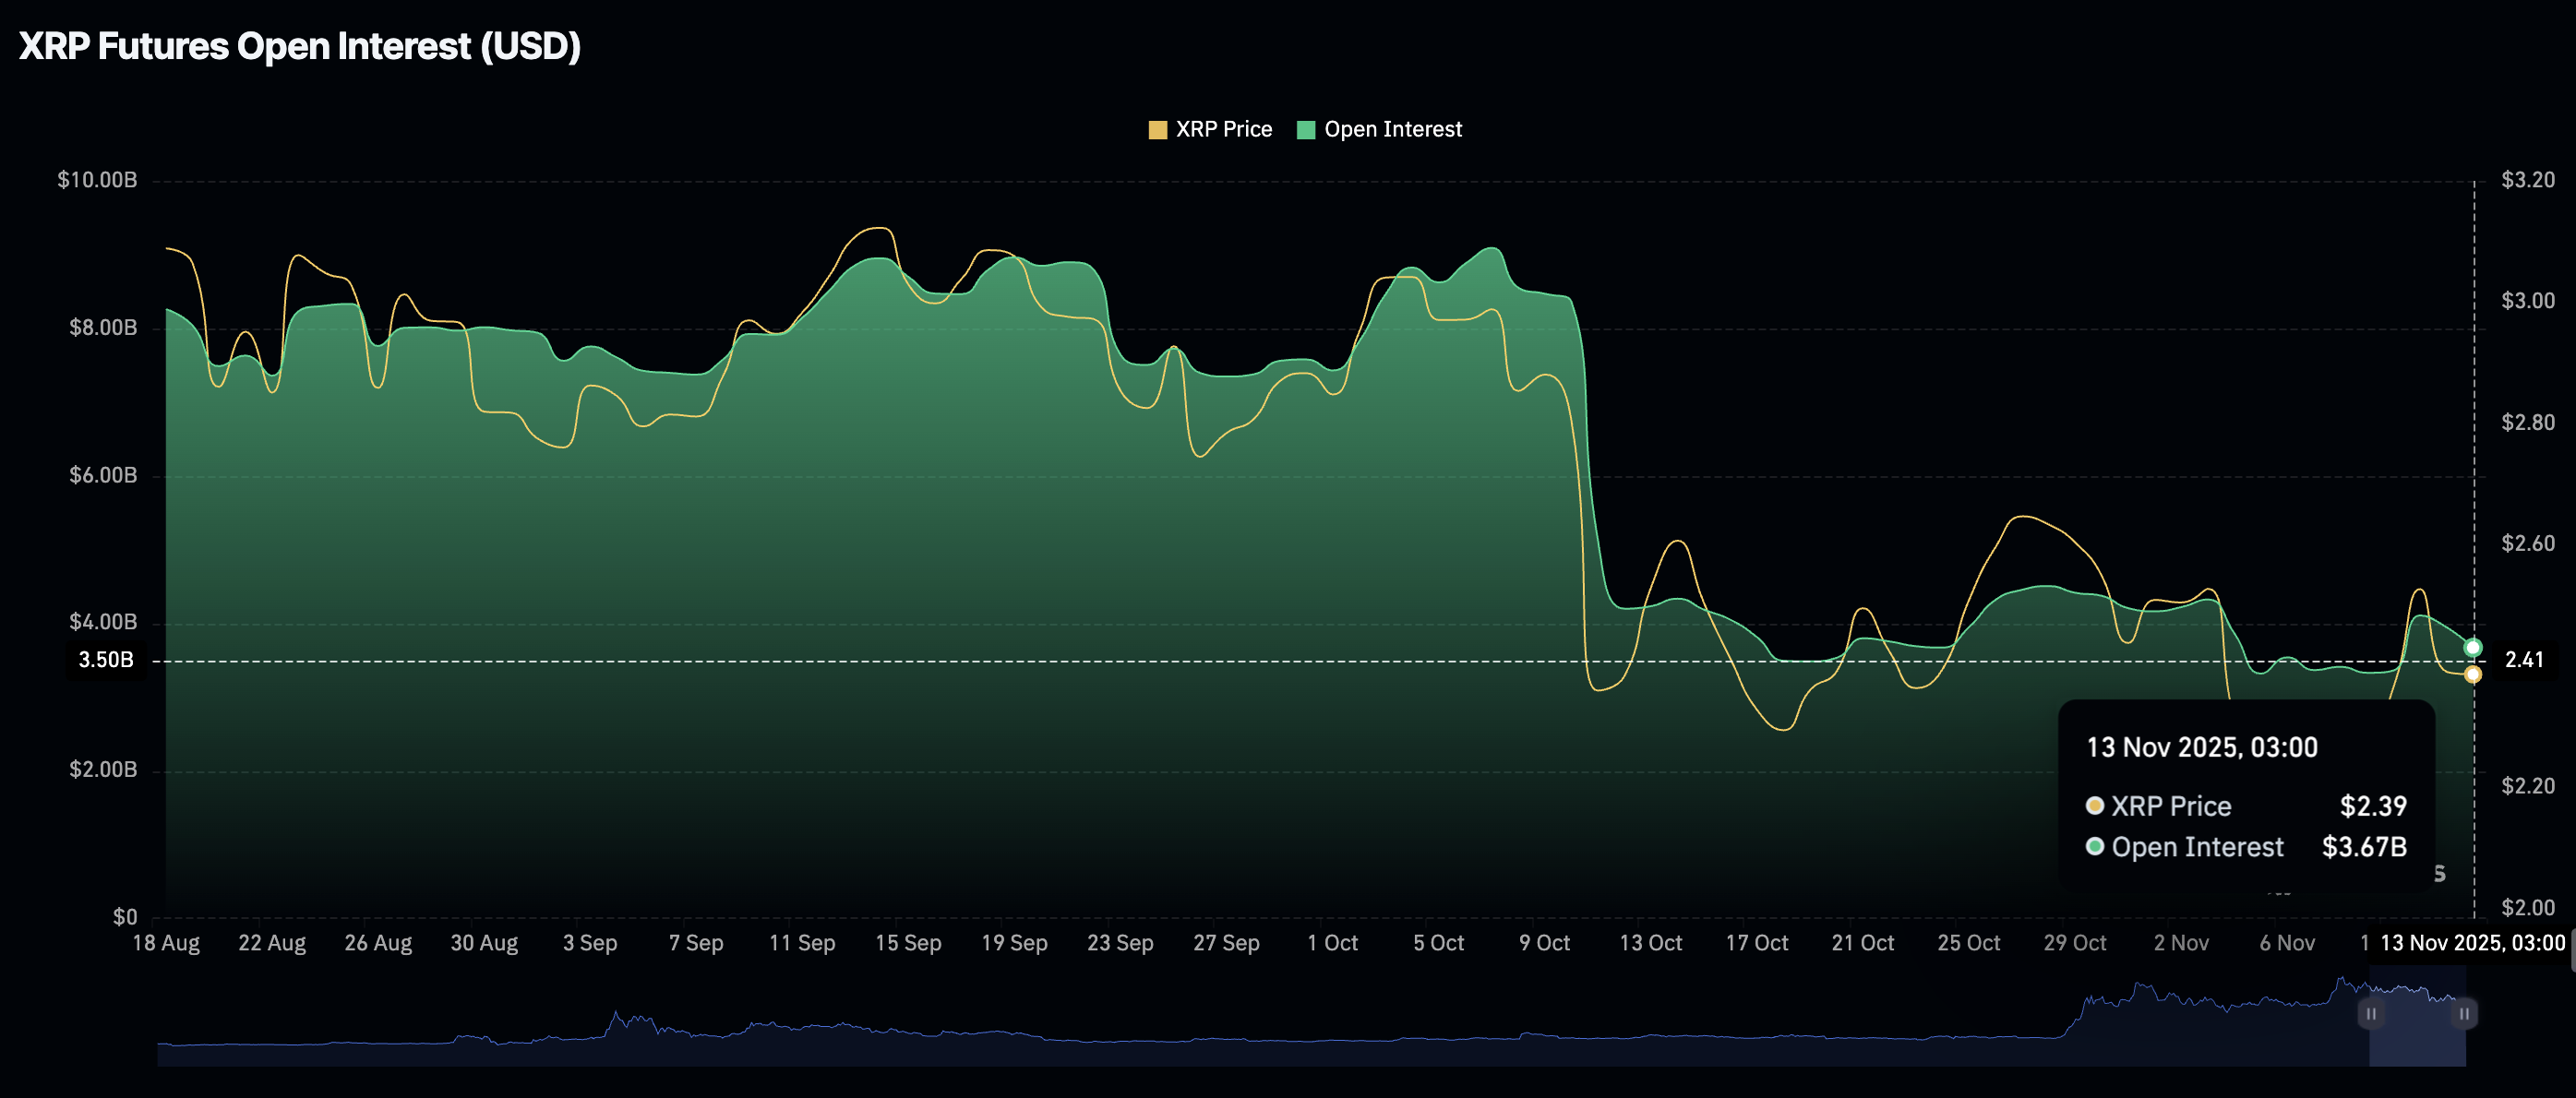
Chart of the day: Bitcoin rebounds and bulls tighten their grip
Bitcoin is trading above $103,000 at the time of writing on Thursday after rising from the previous day's low of $100,813. BTC bulls are deliberately taking back control, as reflected in key technical indicators on the daily chart.
The Moving Average Convergence Divergence (MACD) momentum indicator on the daily chart is poised to trigger a buy signal if the blue line crosses above the red line. Traders will watch for green histogram bars above the mean line to ascertain that bullish momentum is increasing.
A break above the 200-day Exponential Moving Average (EMA) at $107,866 would validate BTC's short-term bullish outlook toward the round-number resistance at $110,000.
The Relative Strength Index (RSI) has risen to 42 while remaining in the bearish region. However, higher RSI readings will support bullish momentum and increase the odds of a steady short-term uptrend.
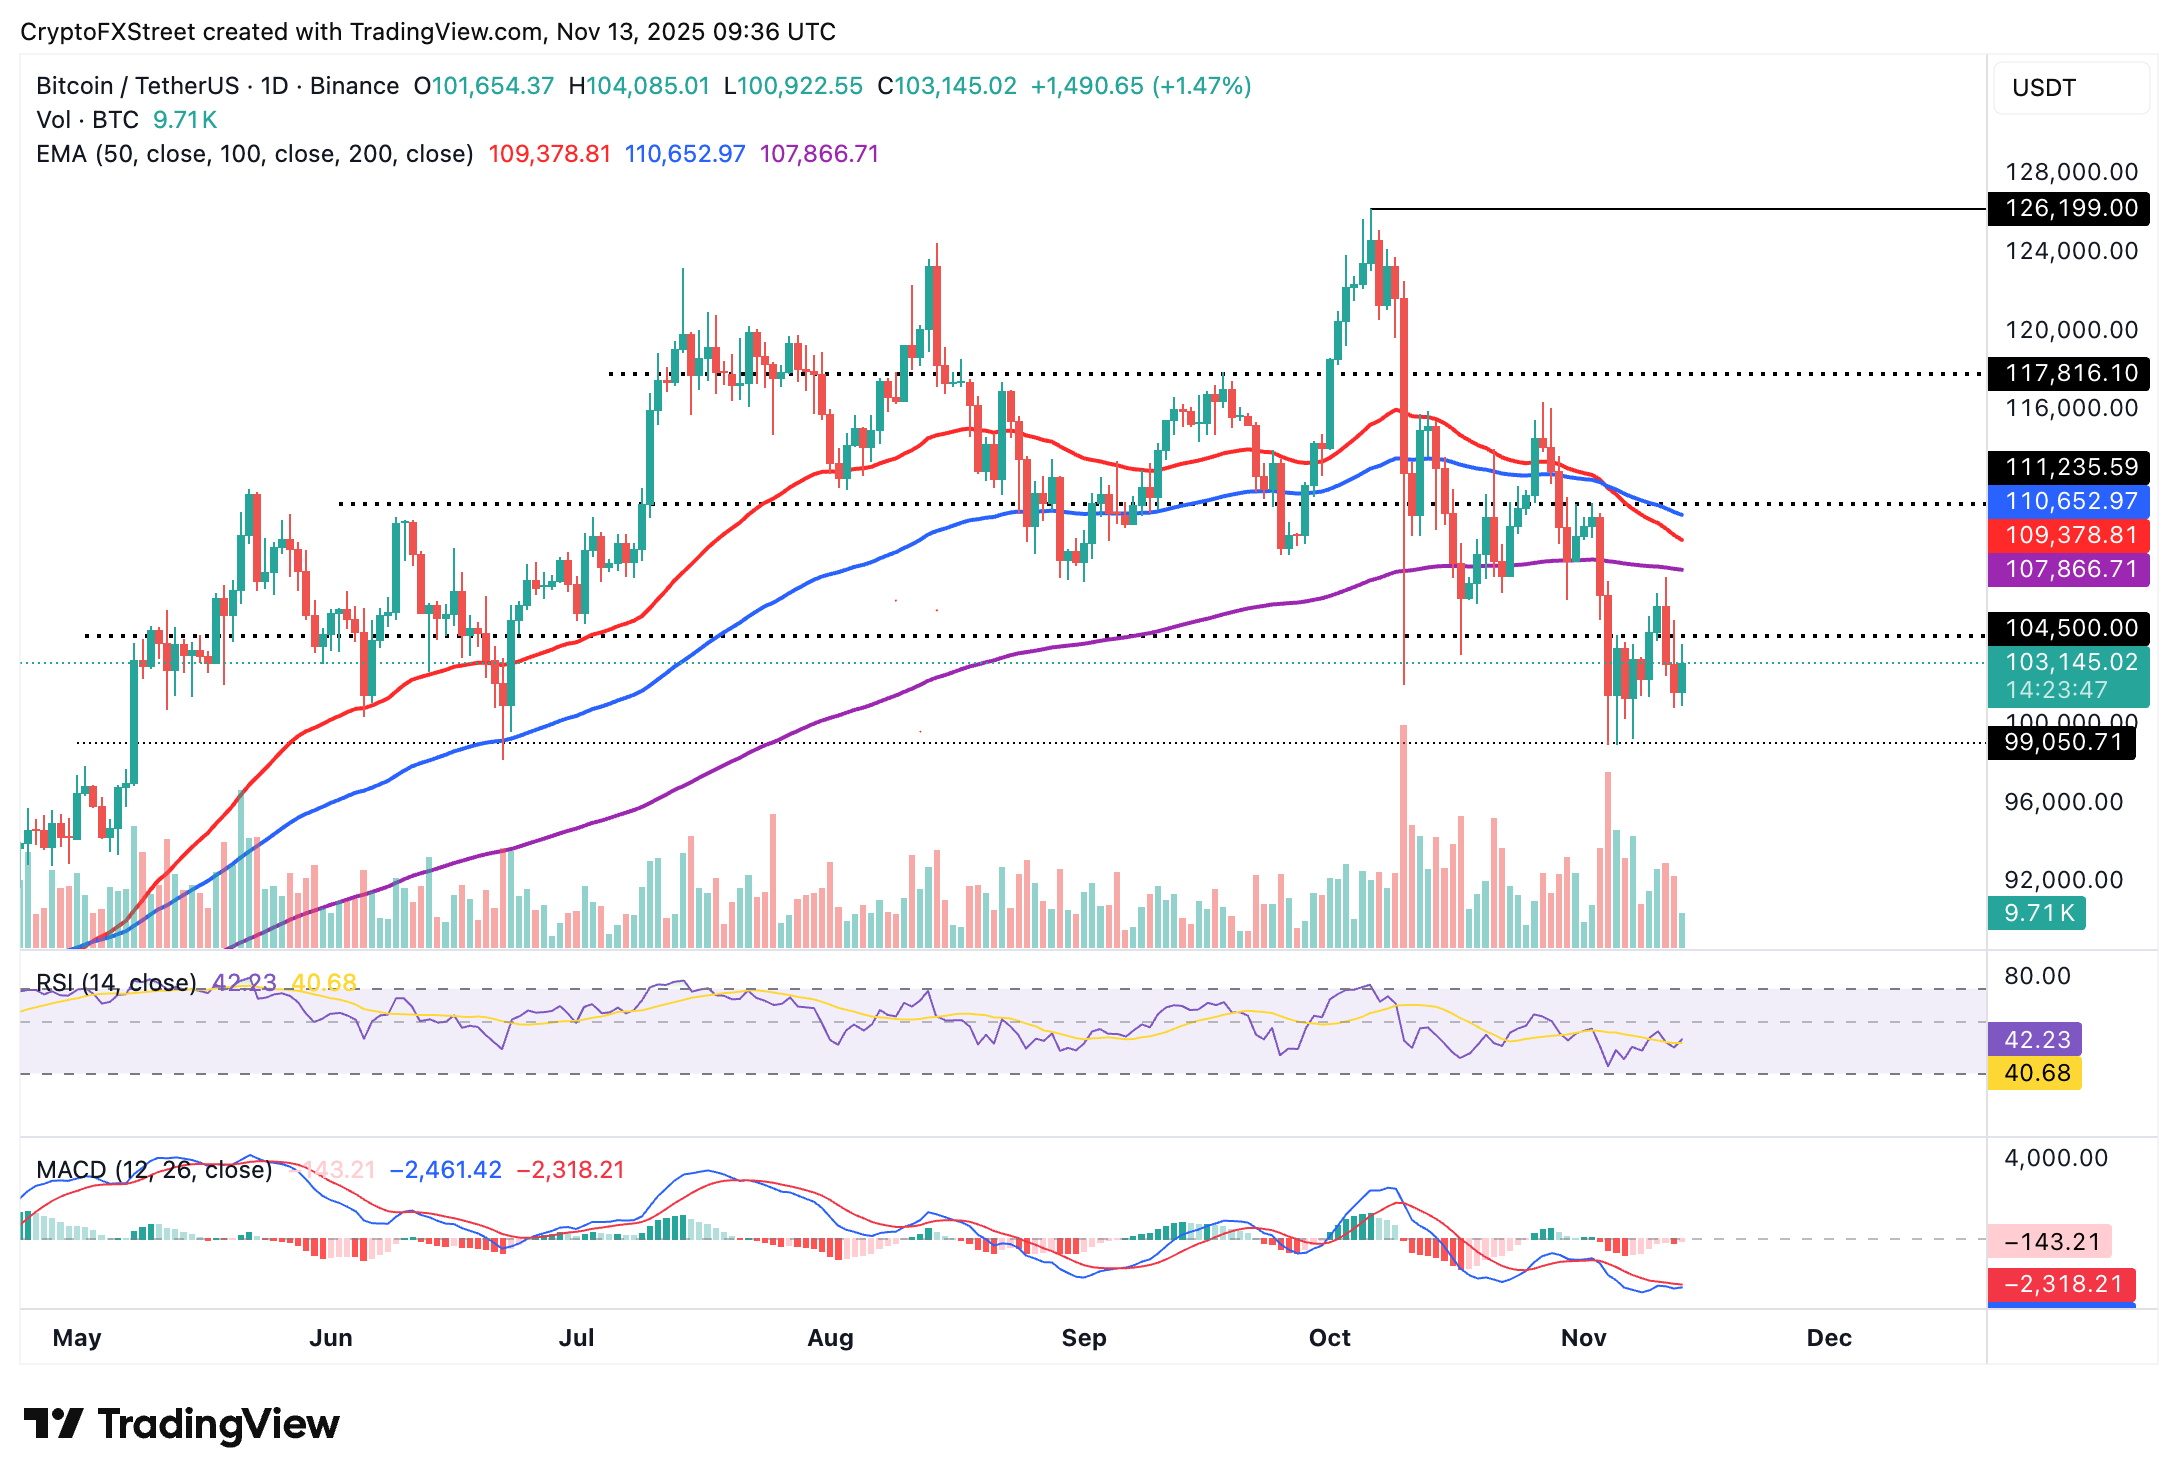
Still, traders must be cautiously optimistic, particularly given that Bitcoin is positioned below key moving averages, including the 200-day, 100-day, and 50-day EMAs, which back a bearish outlook.
Altcoins update: Ethereum, XRP eye short-term breakout
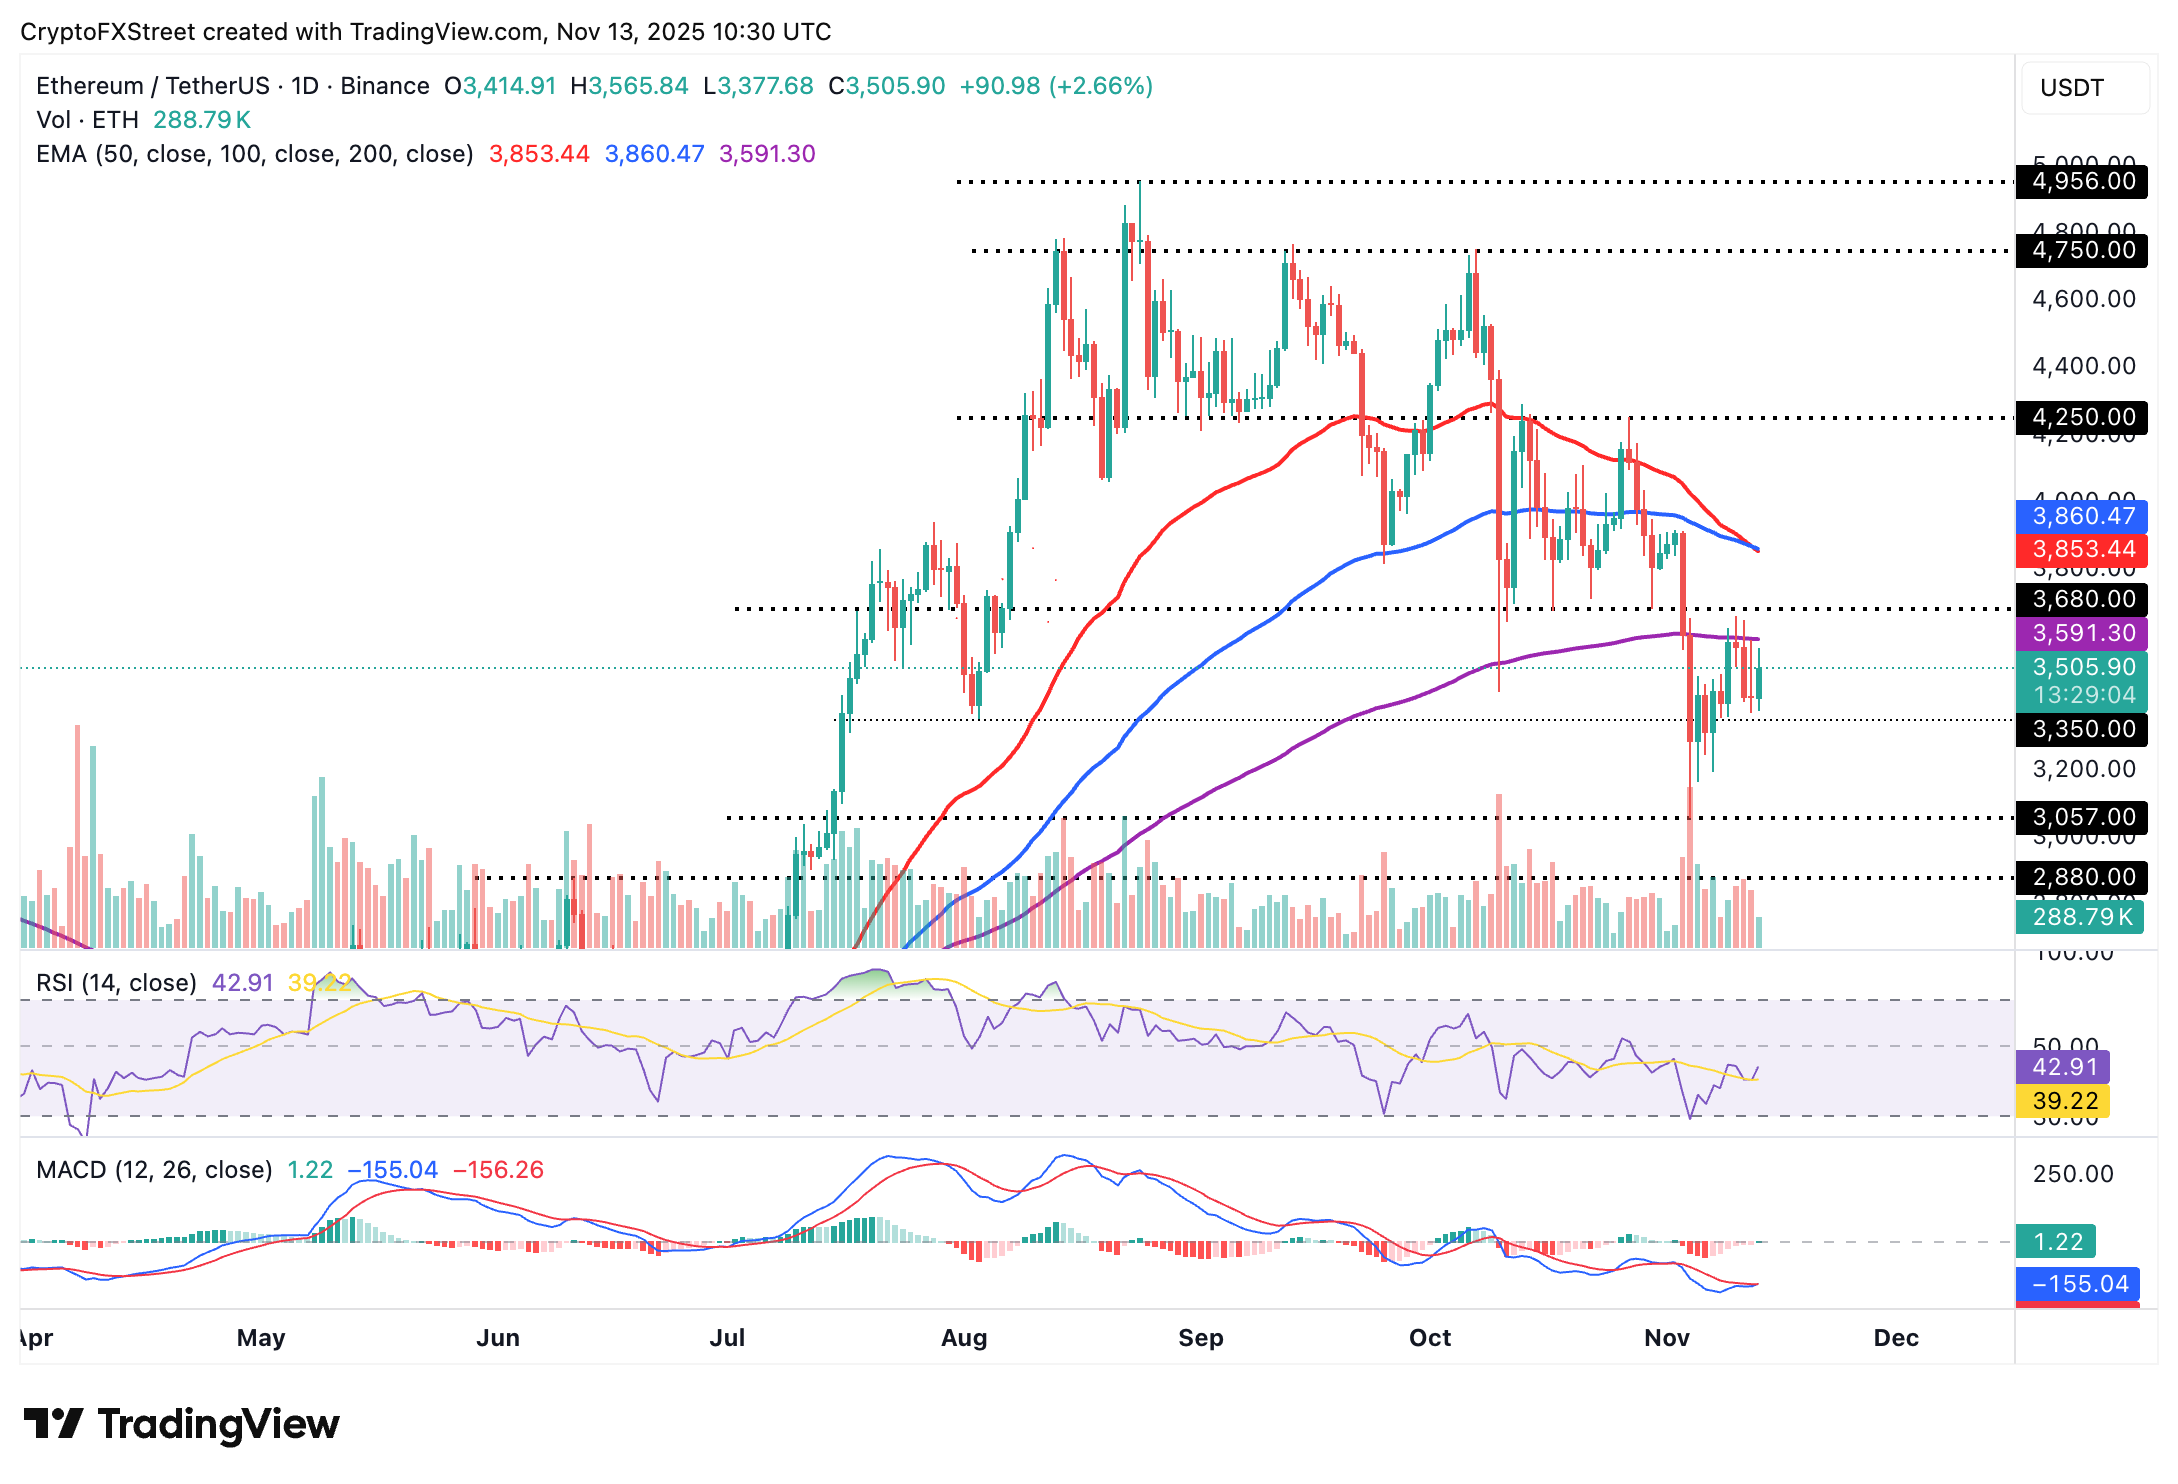
Ethereum is trading above $3,500 after extending its recovery from Wednesday's low of $3,371. The path of least resistance is upward, backed by the RSI recovering to 42 on the daily chart.
If the uptrend continues above the midline, bulls will tighten their grip further, potentially propelling the smart contracts token toward the next resistance, highlighted by the 50-day EMA at $3,853.
The MACD indicator is poised to trigger a buy signal, likely encouraging investors to increase risk exposure as they anticipate a steady uptrend. Still, if early profit-taking overwhelms demand, a correction toward the next key support at $3,350, last tested on Saturday, may follow.
XRP, on the other hand, is trading above $2.50 at the time of writing on Thursday, supported by a strengthening short-term technical structure and improving sentiment in the broader cryptocurrency market.
A buy signal maintained by the Moving Average Convergence Divergence (MACD) indicator since Monday underpins XRP's short-term bullish outlook. If the blue MACD line holds above the red signal line as the indicator generally rises, risk appetite will increase.
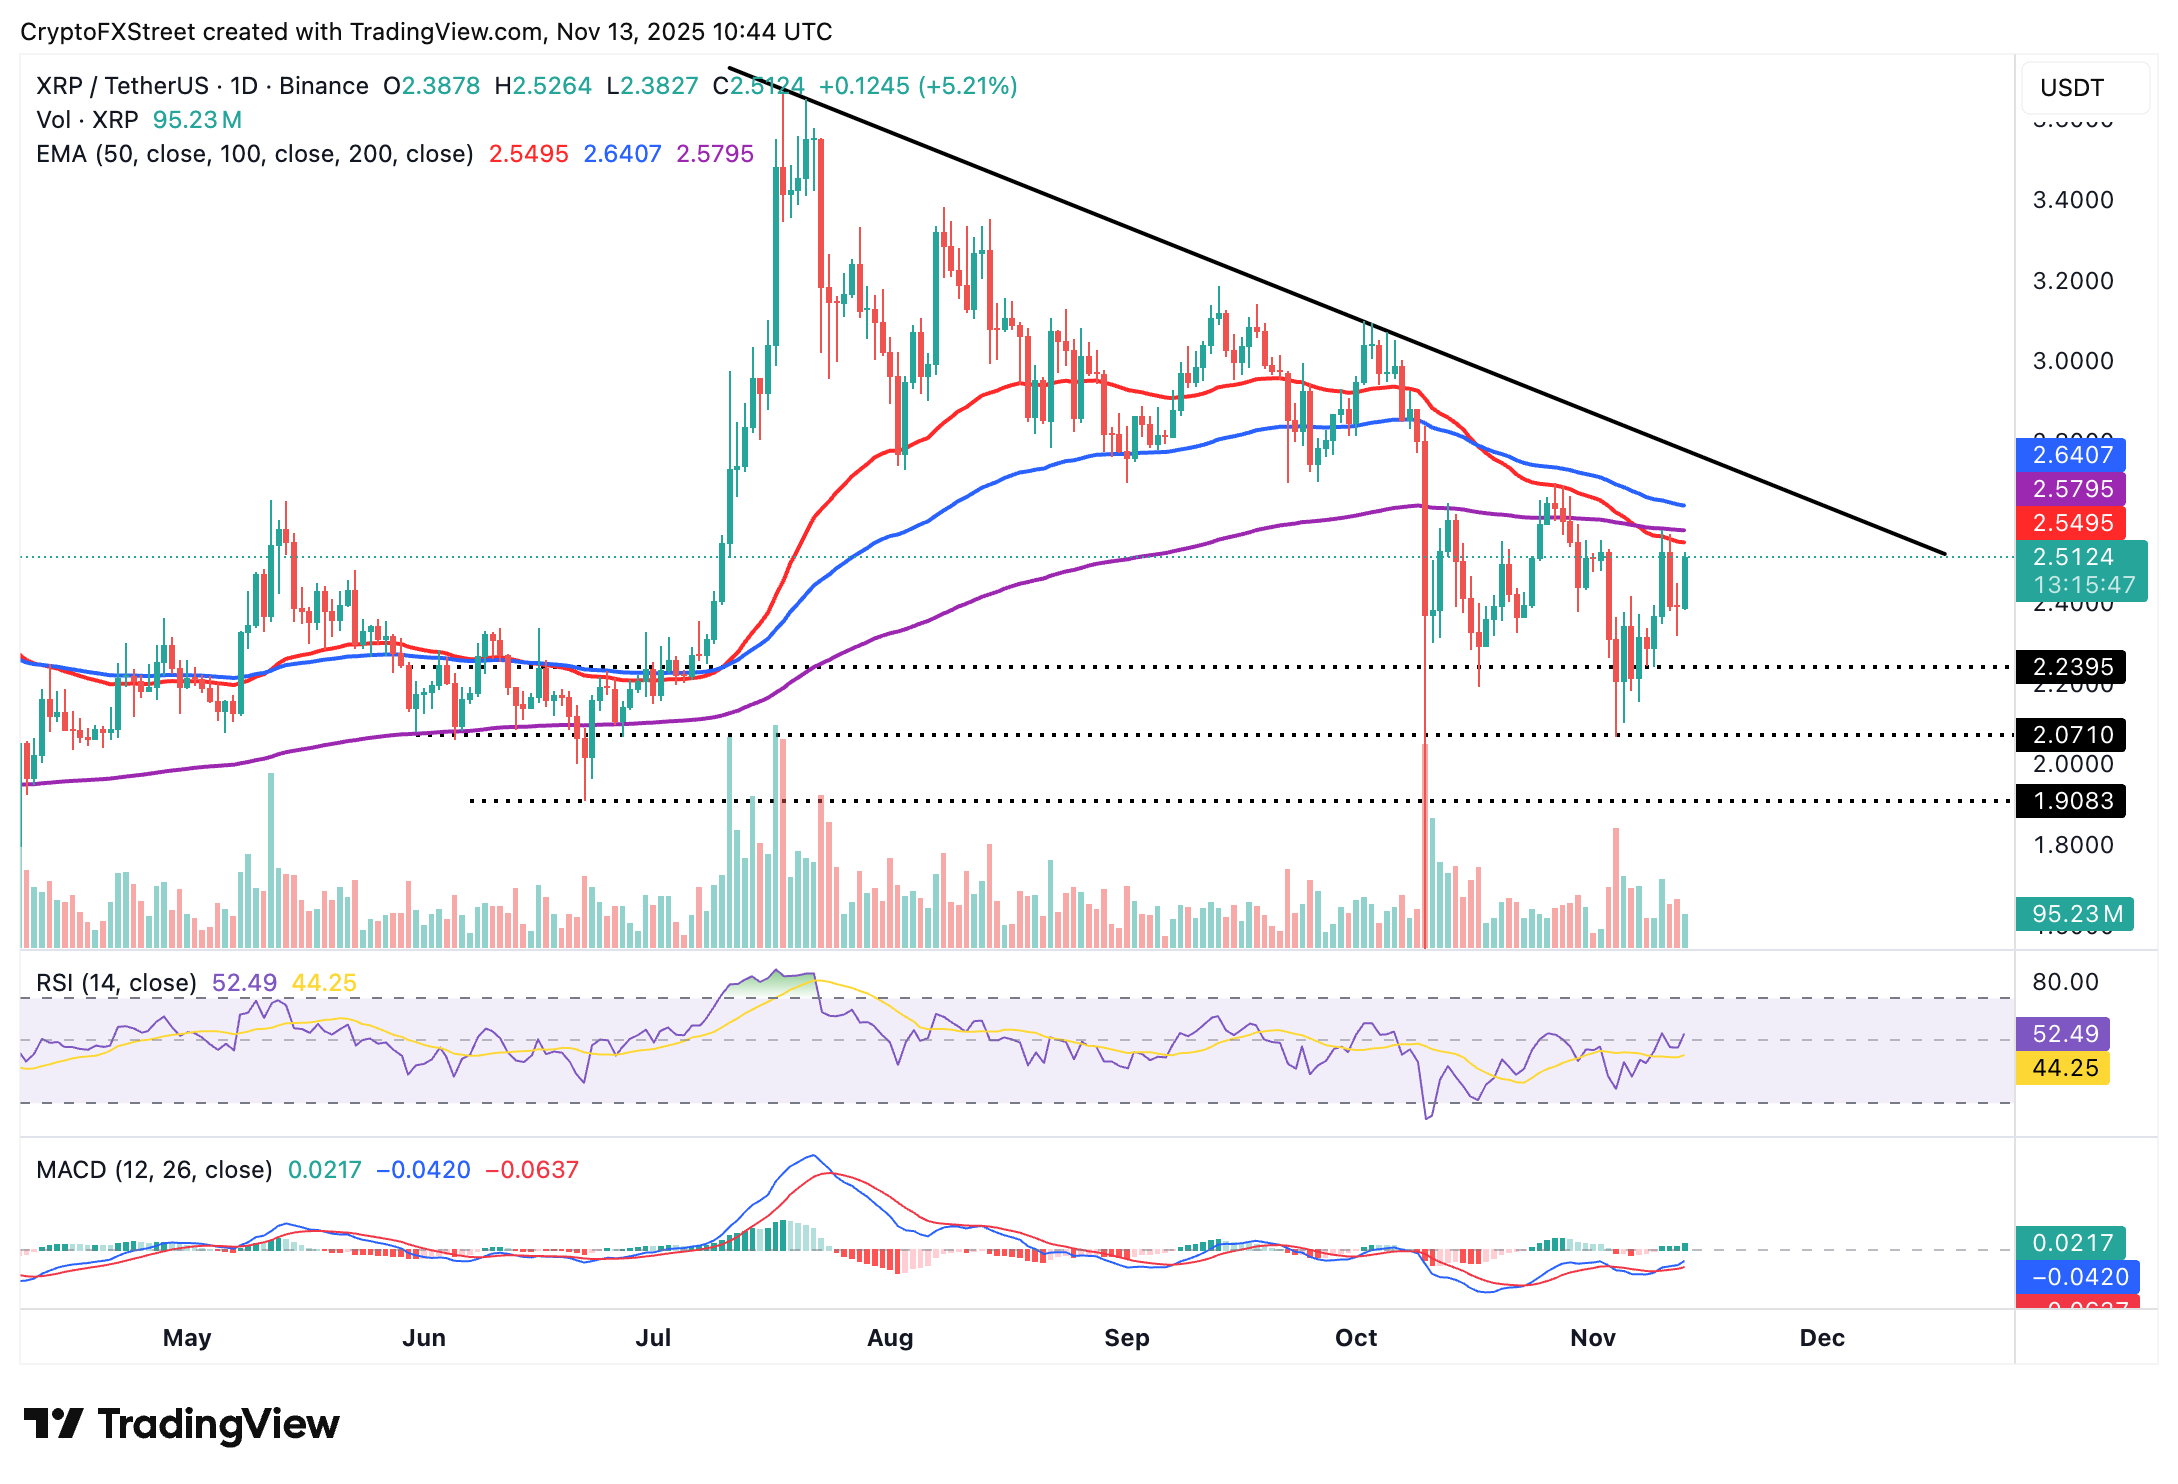
The RSI has also crossed into the bullish region above the neutral level of 50, improving the odds of a sustained rebound. Key areas of interest for traders are highlighted by the 50-day EMA at $2.54, the 200-day EMA at $2.57, and the 100-day EMA at $2.64.
Crypto ETF FAQs
An Exchange-Traded Fund (ETF) is an investment vehicle or an index that tracks the price of an underlying asset. ETFs can not only track a single asset, but a group of assets and sectors. For example, a Bitcoin ETF tracks Bitcoin’s price. ETF is a tool used by investors to gain exposure to a certain asset.
Yes. The first Bitcoin futures ETF in the US was approved by the US Securities & Exchange Commission in October 2021. A total of seven Bitcoin futures ETFs have been approved, with more than 20 still waiting for the regulator’s permission. The SEC says that the cryptocurrency industry is new and subject to manipulation, which is why it has been delaying crypto-related futures ETFs for the last few years.
Yes. The SEC approved in January 2024 the listing and trading of several Bitcoin spot Exchange-Traded Funds, opening the door to institutional capital and mainstream investors to trade the main crypto currency. The decision was hailed by the industry as a game changer.
The main advantage of crypto ETFs is the possibility of gaining exposure to a cryptocurrency without ownership, reducing the risk and cost of holding the asset. Other pros are a lower learning curve and higher security for investors since ETFs take charge of securing the underlying asset holdings. As for the main drawbacks, the main one is that as an investor you can’t have direct ownership of the asset, or, as they say in crypto, “not your keys, not your coins.” Other disadvantages are higher costs associated with holding crypto since ETFs charge fees for active management. Finally, even though investing in ETFs reduces the risk of holding an asset, price swings in the underlying cryptocurrency are likely to be reflected in the investment vehicle too.
Recommended Articles


