

PUMP Hits All-Time High as Daily Volume Tops $1 Billion

Source Beincrypto

PUMP,  the native token that powers the Solana-based memecoin launchpad Pump.fun, has surged nearly 25% in the past 24 hours.

The altcoin briefly touched an all-time high of $0.008456 earlier today, highlighting the intensity of the rally. With a climbing bullish bias, PUMP appears poised to register further gains as traders enter the new week.

PUMP’s Rally Backed by Explosive Market Interest

PUMP’s double-digit rally has been accompanied by a rise in the token’s daily trading volume. Per Santiment, this has exceeded $1.16 billion, up by 132% in the past 24 hours. This highlights the growing market interest in the altcoin.

When an asset’s price and trading volume surge, it signals strong conviction among market participants. Therefore, PUMP’s double-digit rally paired with a 132% spike in daily volume indicates that buyers are aggressively entering the market.

For token TA and market updates: Want more token insights like this? Sign up for Editor Harsh Notariya’s Daily Crypto Newsletter here.
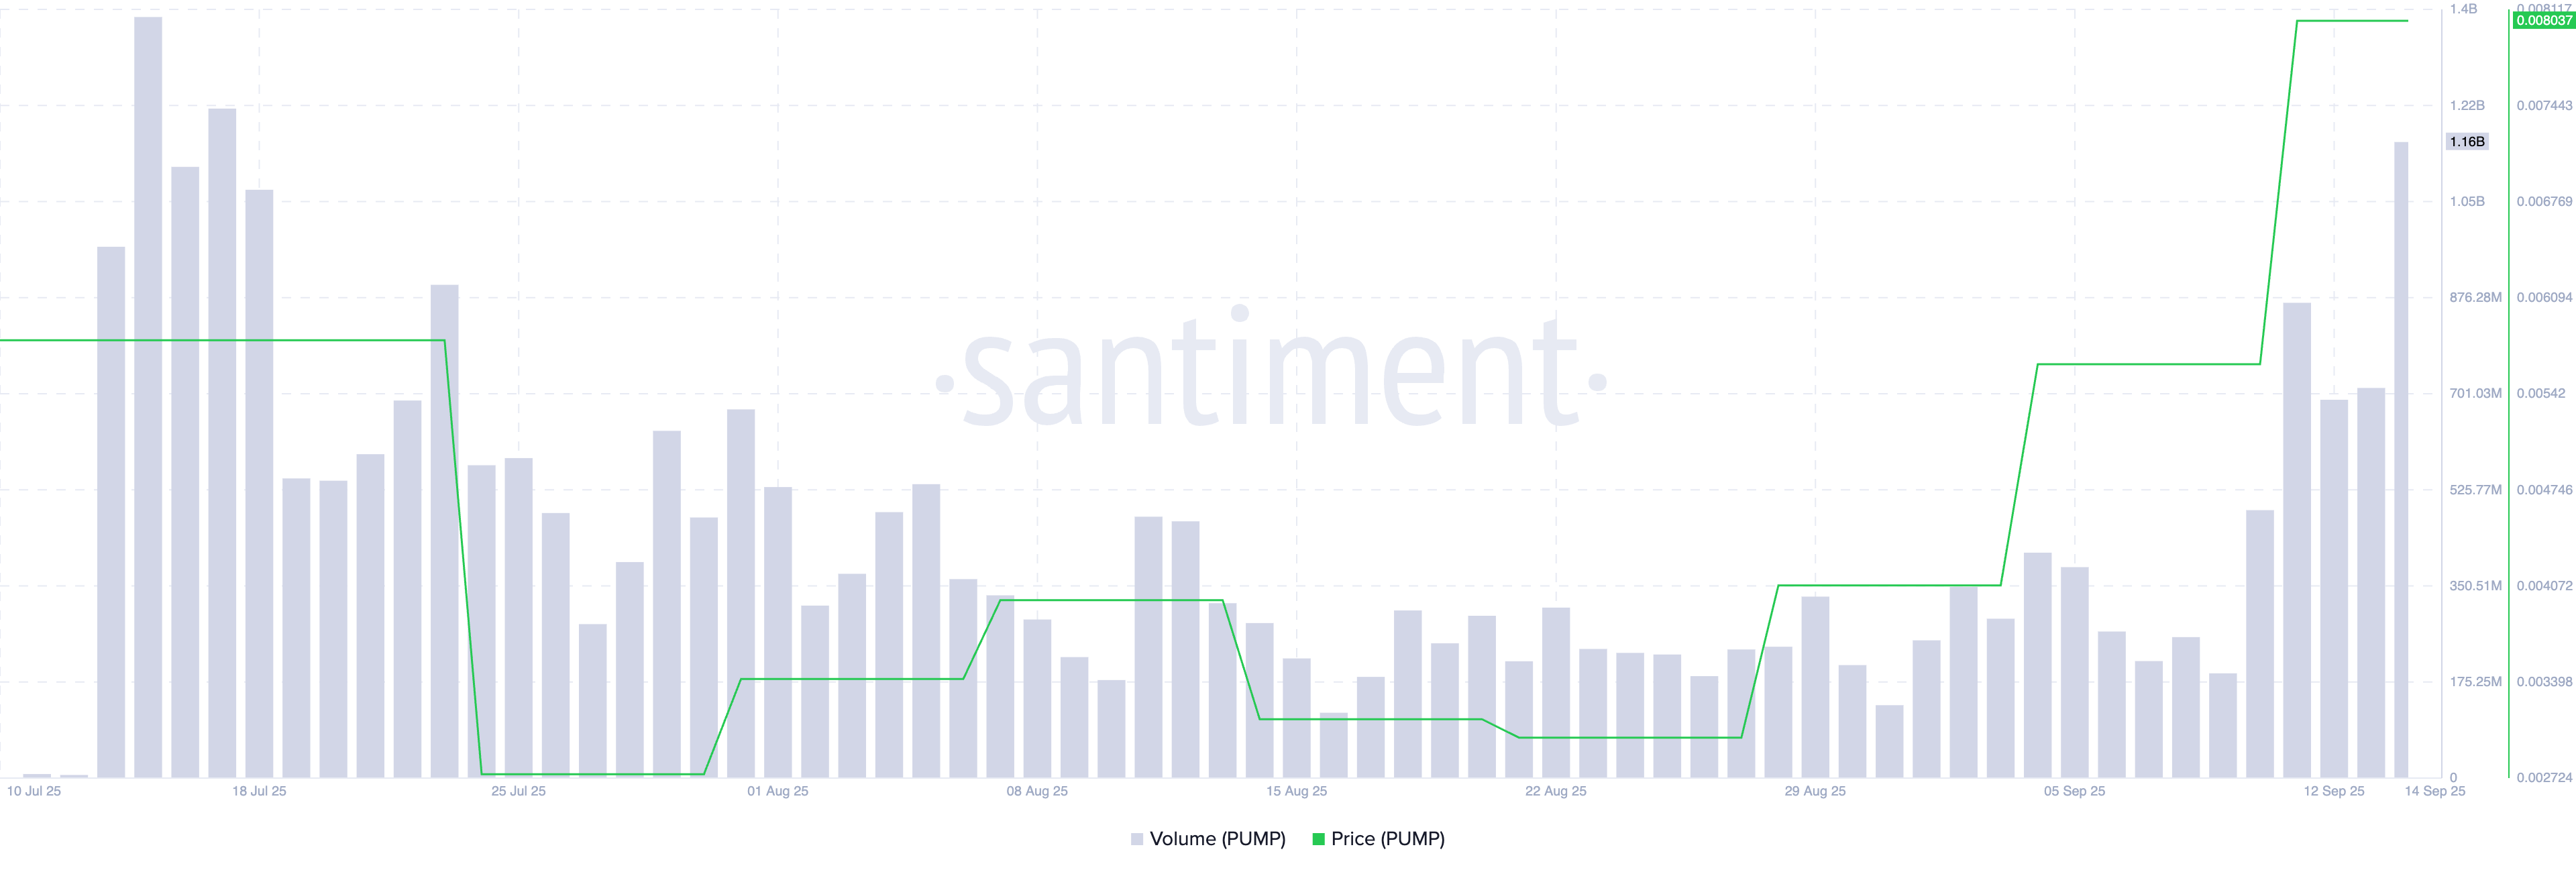

PUMP Price/ Trading Volume. PUMP Price/ Trading Volume. Source: Santiment

This trend often reflects genuine demand and could fuel further upward momentum in the coming sessions. 

Furthermore, readings from momentum indicators observed on the PUMP/USD one-day chart support this bullish outlook. For example, its Aroon Up is 100%, confirming the rally’s strength. 
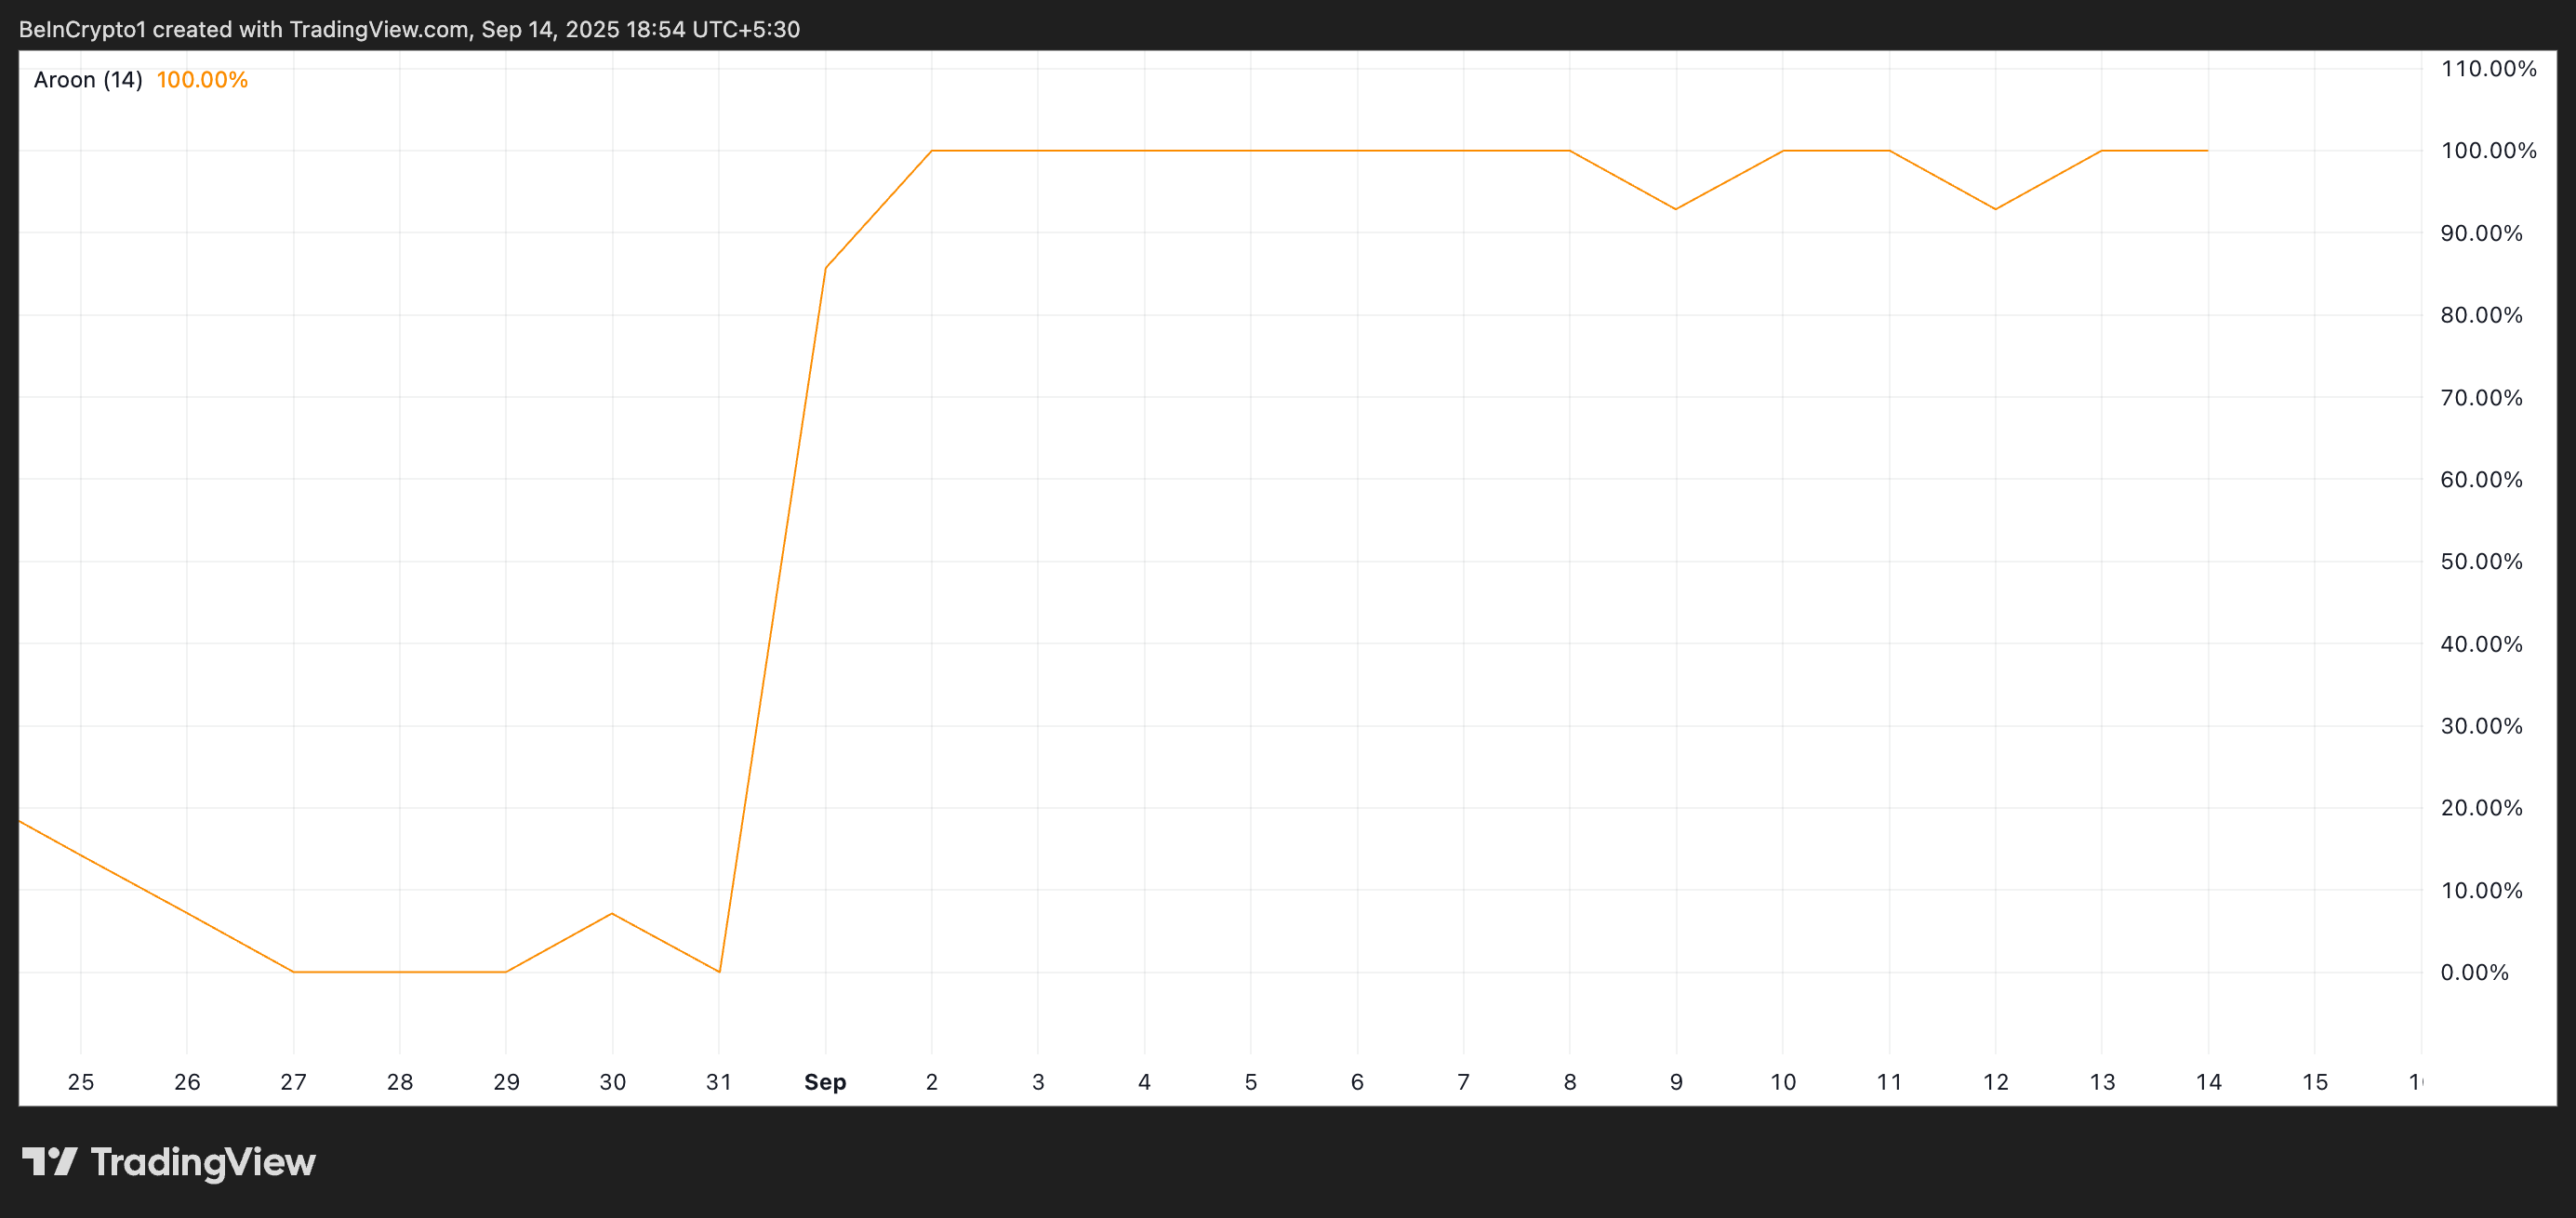
PUMP Aroon Up LinePUMP Aroon Up Line. Source: TradingView

The Aroon Indicator identifies the strength and direction of a trend by measuring the time elapsed since the most recent highs and lows. 

When the Aroon Up Line registers at 100%, it indicates that a new high has just been set and that the bullish trend is at its strongest possible reading. This shows PUMP buyers are firmly in control, and signals that upward momentum will likely continue in the near term.

Will PUMP Retake Its ATH or Slip Toward Support? 

At press time, the altcoin trades at $0.007803, hovering just below its new price peak of $0.008456. If buy-side pressure grows, PUMP could reclaim this price peak and attempt to rally beyond it.
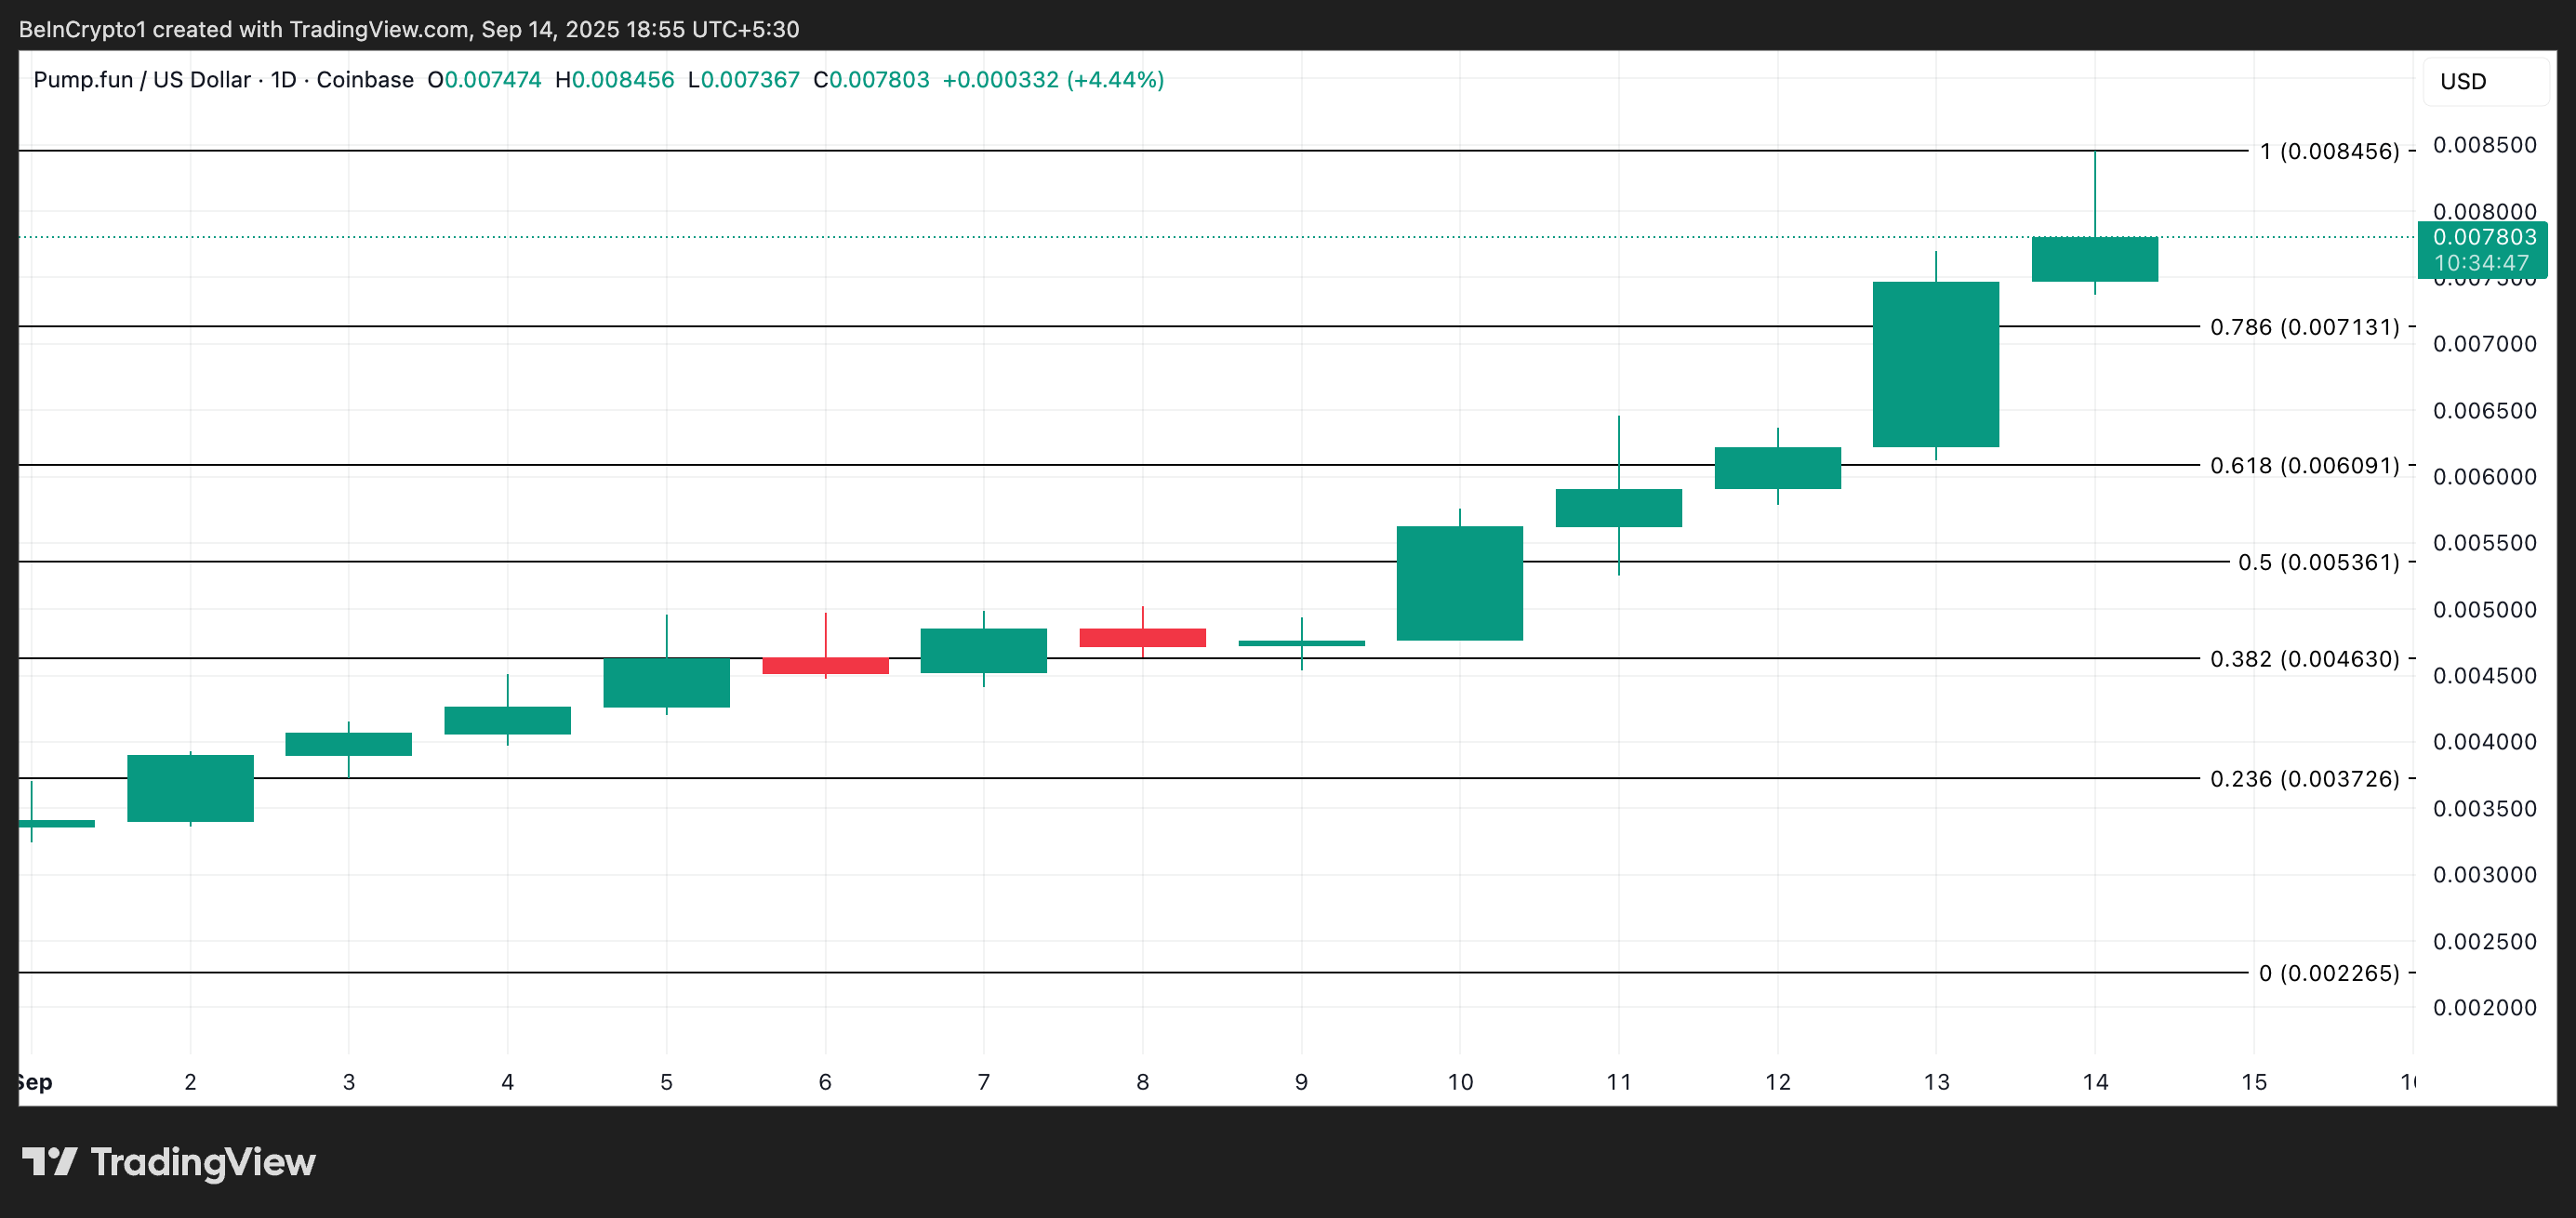
PUMP Price Analysis.PUMP Price Analysis. Source: TradingView

However, an uptick in profit-taking activity could invalidate this bullish outlook. If selloffs resume, PUMP could reverse its current uptrend and fall to support at $0.007131.

Disclaimer: For information purposes only. Past performance is not indicative of future results.
placeholder
Strong profits, falling shares: bank earnings day one meets a memory-chip rout — with CPI and ASML aheadGoldman Sachs blew past estimates (EPS $17.01 vs $13.09 expected, profit +33%) while JPMorgan missed ($5.75 vs $5.93) and Wells Fargo fell 3% — yet the S&P 500 finished flat at 7,805.45, pinned below its record close as a memory-chip rout (SOX −2.67%, Micron under $1,000) kept the pressure on. Tonight brings the week's decider: US September CPI at 8:30 ET, then Bank of America, Morgan Stanley, BlackRock and ASML before the open. Here are the levels, both cases, and the watch list.
Author  Irene Q.
Oct 14, Wed
Goldman Sachs blew past estimates (EPS $17.01 vs $13.09 expected, profit +33%) while JPMorgan missed ($5.75 vs $5.93) and Wells Fargo fell 3% — yet the S&P 500 finished flat at 7,805.45, pinned below its record close as a memory-chip rout (SOX −2.67%, Micron under $1,000) kept the pressure on. Tonight brings the week's decider: US September CPI at 8:30 ET, then Bank of America, Morgan Stanley, BlackRock and ASML before the open. Here are the levels, both cases, and the watch list.
placeholder
US September CPI recap: inflation hits 3.7% as core runs hot — is an October Fed hike back on the table?September CPI landed hot: headline 3.7% y/y, core 2.6% y/y and 0.3% m/m. October hike odds jumped from ~22% to ~37% — yet the dollar faded to 101.74, gold closed higher and the S&P 500 fell 1.11%. Here is the full repricing, the levels and what to watch next.
Author  Irene Q.
Oct 15, Thu
September CPI landed hot: headline 3.7% y/y, core 2.6% y/y and 0.3% m/m. October hike odds jumped from ~22% to ~37% — yet the dollar faded to 101.74, gold closed higher and the S&P 500 fell 1.11%. Here is the full repricing, the levels and what to watch next.
placeholder
Gold Price Analysis Today | Forex Gold Analysis | XAU/USD Analysis - October 15, 2026Get the latest gold price analysis, forex gold insights, and XAU/USD analysis for October 15, 2026. Read on for the details.
Author  Mitrade
Oct 16, Fri
Get the latest gold price analysis, forex gold insights, and XAU/USD analysis for October 15, 2026. Read on for the details.
placeholder
Gold Price Analysis Today | Forex Gold Analysis | XAU/USD Analysis - October 16, 2026Get the latest gold price analysis, forex gold insights, and XAU/USD analysis for October 16, 2026. Read on for the details.
Author  Mitrade
Oct 16, Fri
Get the latest gold price analysis, forex gold insights, and XAU/USD analysis for October 16, 2026. Read on for the details.
placeholder
Gold Price Forecast: Why Did Gold Rebound After September PPI Rose by Most in Nearly Four Years? As of the European session on October 16, gold prices (XAUUSD) extended their rebound, with the latest price trading near $4,185, up about 0.4% on the day. Gold prices had previously drop
Author  TradingKey
Oct 16, Fri
As of the European session on October 16, gold prices (XAUUSD) extended their rebound, with the latest price trading near $4,185, up about 0.4% on the day. Gold prices had previously drop
goTop
quote