

Is Bitcoin’s recent upswing recovery rally or dead cat bounce?
- Bitcoin price continues its late New York session rally in the early Asian session, posting a 1.17% gain.
- While the short-term outlook might seem bullish, a few signs suggest a looming bearish outlook.
- BTC could trigger a steep correction around the halving event and resume the uptrend thereafter.
Bitcoin’s (BTC) directional bias has been unclear lately after its dip below $70,000. This development has split the community into bulls - expecting a resumption of the uptrend, and bears - looking for signs of a reversal.
Also read: Two theories why GBTC sticks to high fees despite bleeding billions
Bitcoin price action reveals telltale signs of correction
Bitcoin price set up a bearish swing failure pattern (SFP) in the second week of March, signaling a waning bullish momentum. While this sell signal resulted in an 11% correction the following week, BTC’s recovery rally does not seem to have the oomph required to sustain.
Bitcoin’s sell signal on the weekly was noted in a previous publication after it set up a bearish SFP. Our previous article also forecasted the recovery from this crash and how ETF flows could be influencing the price and how this short-term correction could be followed by a bounce that pushes BTC to sweep the current all-time high (ATH) of $73,949 or set up a new one at $75,000.
So far, the pioneer crypto is bouncing right on cue, and this move’s strength will be tested near the ATH, which will decide if the run-up is a dead cat bounce or a continuation of the uptrend.
Here are two reasons that support a dead cat bounce:
- Pre-halving ATH: As noted in our article, Bitcoin price setting up an ATH before the halving is a one-of-a-kind event. Glassnode’s report suggests that this development, backed by the buying pressure after ETF approval, could lead to a sell-off. The report suggests that halving could turn out to be an immediate sell-the-new event and that the declining ETF flows could be a factor.
Read more: Inflows from Bitcoin ETFs may weaken halving effect, says Glassnode amid price correction - Declining CME OI: This outlook does not give ETF flows the weighting as seen in the above point. Instead, it focuses mostly on the Chicago Mercantile Exchange’s (CME) Open Interest (OI) for Bitcoin futures. This metric has declined nearly 6% from 170.44k BTC on March 20 to 160.36k BTC on March 25.
The uptrend in Bitcoin price so far was not mainly due to Bitcoin spot ETF flows but rather the traditional finance BTC buyers via CME futures. If the ETF flows start to decline, falling in line with the bearish BTC CME futures OI, it could trigger a correction in Bitcoin price as well.
The bearish theories noted above hint at a potential correction in Bitcoin price and that the ongoing recovery rally could be a deception, aka a dead cat bounce. Let’s examine the on-chain metrics to determine if that is possible.
BTC on-chain metrics flash pessimistic outlook
The key BTC on-chain metrics suggest a bearish outlook. The active addresses, social dominance, and transaction volume are all sliding lower despite the bullish start of the week, indicating a waning bullish momentum. This non-conformity indicates a bearish divergence, suggesting a potential correction that falls in line with the dead cat bounce scenario noted above.
%20[10.50.28,%2026%20Mar,%202024]-638470317209976936.png)
BTC active addresses, social dominance, and transaction volume
How low can BTC go?
Assuming the ongoing rally leads to a correction, here are two key support or accumulation zones where investors can consider re-entering the markets.
- The weekly imbalance, extending from $59,111 to $53,120.
- The $45,156 weekly support level, which also harbors the imbalance, stretching from $47,712 to $43,890.
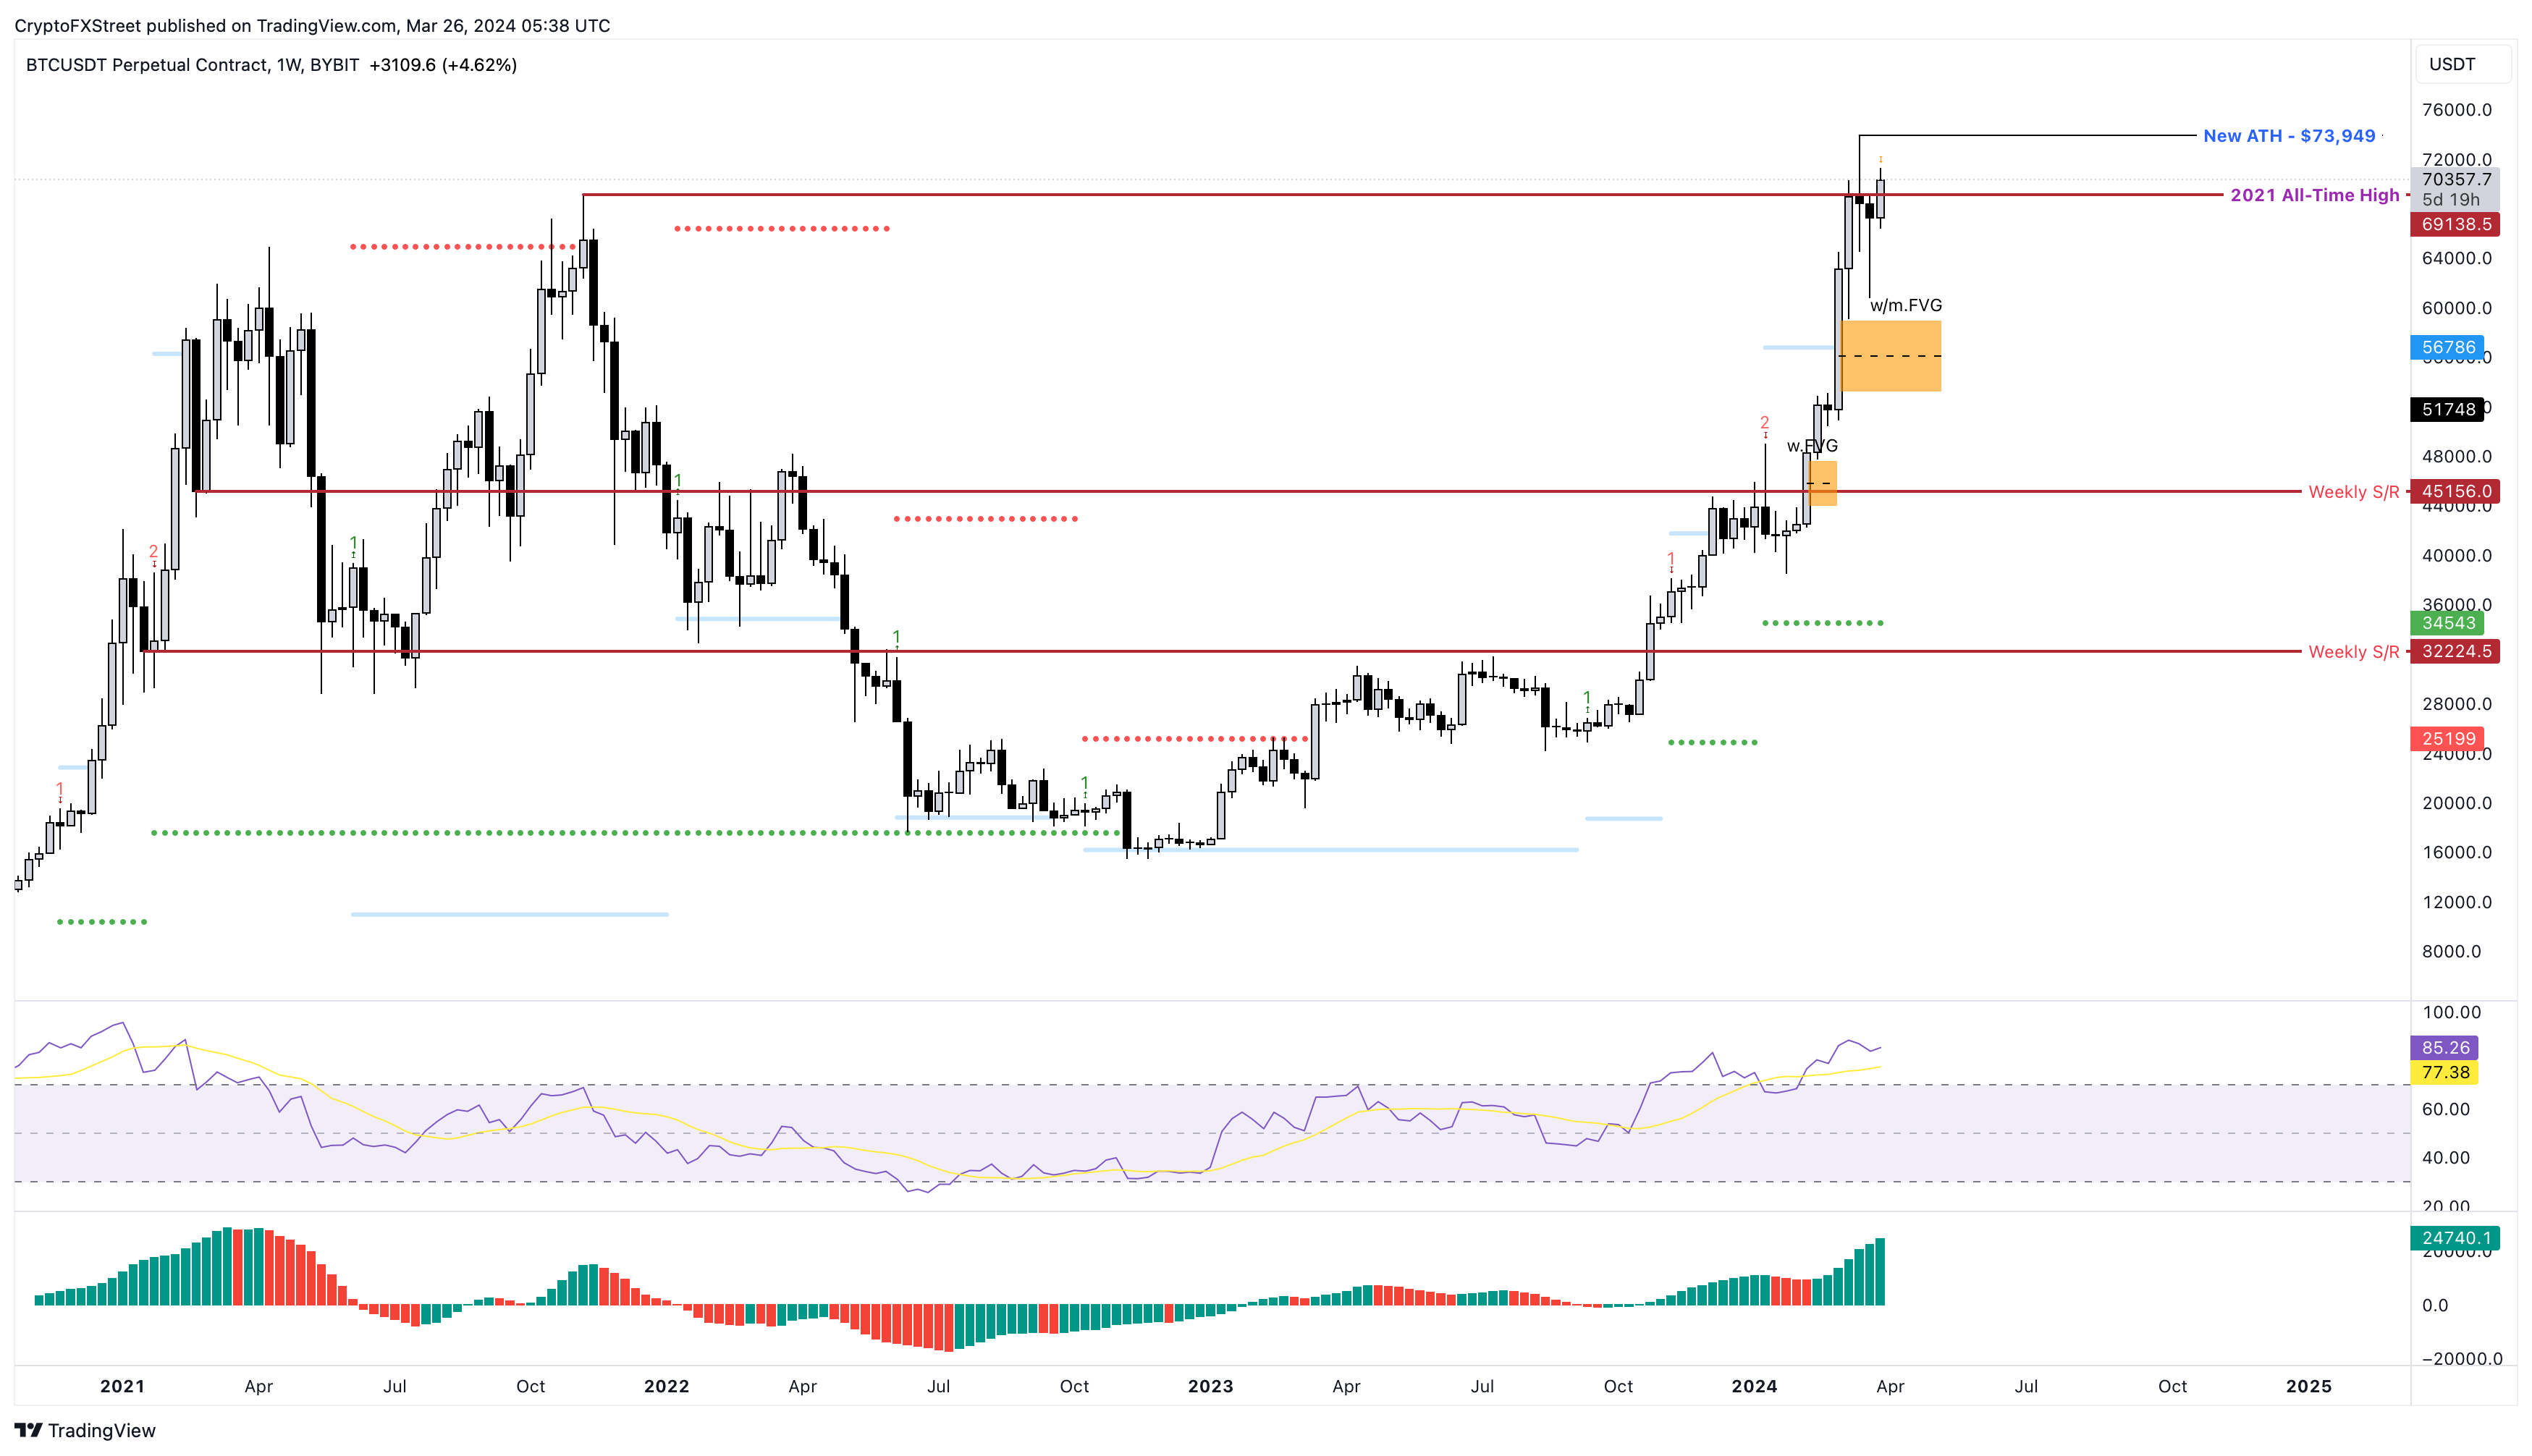
BTC/USDT 1-week chart
While the declining CME BTC futures OI might be concerning, if it improves, Bitcoin price could continue its ascent above $70,000. In a highly bullish outlook, BTC could eye a retest of a new ATH at $75,000, but if the pioneer crypto forms a base around this level, chances of continuing the uptrend are high. This development will invalidate the short-term correction thesis for Bitcoin and forecast an extension of the bull run to the next psychological level of $80,000.
Recommended Articles


