


Inflows from Bitcoin ETFs may weaken halving effect, says Glassnode amid price correction
- The history of price gains after each Bitcoin halving may be disrupted as the bull market came before this year’s event.
- Long-term holders will play a huge role in directional trading, says Glassnode.
- Bitcoin is still in overbought territory as JP Morgan warns about profit-taking despite the halving.
Bitcoin (BTC) spot ETF approval on January 10 gave a boost to its price and that of the general crypto market, sending the largest cryptocurrency to a new all-time high. While these ETFs have boosted the crypto market ahead of the upcoming bitcoin halving, a new report from Glassnode suggests that traders must adjust their strategies and exercise caution because the usual pattern during halving events, based on price rallies afterwards, may not hold this time.
Also read: Bitcoin price scenarios to consider with approaching BTC halving event
Bull markets and the Bitcoin halving
Bitcoin's price, which has dropped 9% from its recent all-time high of $73,580, is expected by many traders to post huge gains following the upcoming halving event in April. Bitcoin halving is an event that sees the rewards of miners slashed by 50%, reducing the rate at which new Bitcoin tokens enter circulation. As a result, traders usually expect the price of Bitcoin to rise post-halving, considering a diminishing supply rate causes a price increase, assuming demand stays constant or increases.
In a nod to this sentiment, past halving events have always been accompanied by a rise in Bitcoin's price.
- The first halving event, in November 2012, reduced block rewards to 25 BTC. Bitcoin's price rose from $13 to $1,152 the following year.
- The second halving event saw a price increase from $664 to $17,760 the next year.
- After reducing block rewards to 6.25 BTC, the third halving event boosted the price from $9,734 to $67,549 the following year.
- The next halving occurs in April, and some traders expect a similar pattern.
While historical halving events can't be relied upon, they've proven accurate in predicting Bitcoin's price. This also aligns with popular crypto analyst PlanB's stock-to-flow (S2F) model, which predicts Bitcoin's price based on its scarcity.
The analyst reiterated this in an X post on Sunday: "Every halving period (210,000 blocks, ~4y), there is a bull market in which bitcoin price pumps."
Read more: Bitcoin peaks at $69,324 with BTC fourth halving around the corner
New market dynamics will affect halving predictions
However, a recent report by crypto research firm Glassnode suggests that the price of Bitcoin may not follow previous post-halving patterns due to new market dynamics, especially as Bitcoin reached an all-time high pre-halving for the first time.
In the report, the research firm stated that the buying activity of ETFs already overshadows the sell pressure from miners to cover their cost of operations. The current daily mining rewards of 900 BTC, which will reduce to 450 BTC after the halving, don't compare to the scale of acquisition of the ETFs. Hence, "the ETFs are, in essence, preempting the halving's impact by already tightening the available supply through their substantial and continuous buying activity."
As a result, "the supply squeeze usually expected from halvings may already be in effect due to ETFs' large-scale bitcoin acquisitions." The report also suggests that the large holdings of long-term traders and the ETFs will influence directional trading as selling pressure from them can cause significant shifts in the market. This also indicates the diminishing influence of miners over the market.
Also read: Bitcoin Price Outlook: Will BTC foray higher as BlackRock BTC ETF nicks $10 Billion AUM?
The report went on to caution against the bullish sentiments that some traders are showing, as "the market structure suggests that we could witness another significant correction." This comes after predictions by US bank JP Morgan’s analysts that the price of Bitcoin is still in overbought territory and that more profit-taking may occur going into the halving.
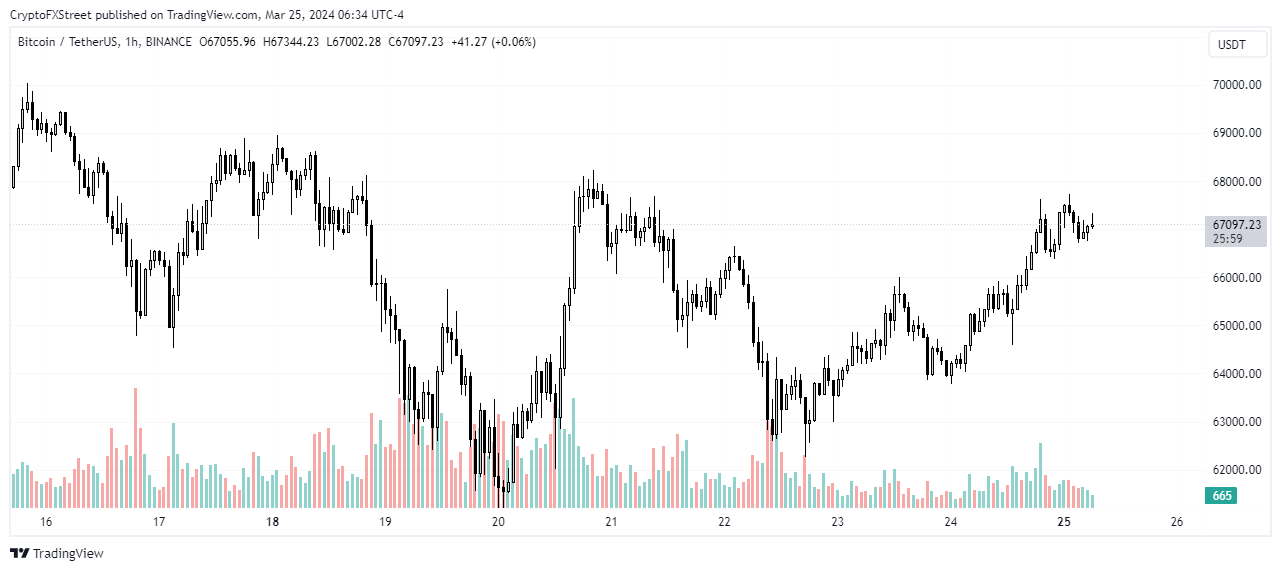
BTC/USDT 1-hour chart
At the time of writing, Bitcoin is trading at $66,905, up 2.8% in the last 24 hours.
Recommended Articles


