


Gold faces headwind as US Dollar and US yields climb
- Gold price rally stalls after strong US macroeconomic data.
- US Retail Sales exceed expectations, Industrial Production improved in August, boostinge US Dollar Index (DXY) to 100.92.
- Geopolitical tensions in the Middle East escalate with Hezbollah blaming Israel for recent blasts.
Gold prices fall ahead of the US Federal Reserve’s (Fed) monetary policy decision on Wednesday as the Greenback stages a recovery following a strong (relative to consensus) August US Retail Sales report. Therefore, US Treasury yields advanced, and the buck edged higher, a headwind for the golden metal.
The XAU/USD trades at $2,569, losing 0.50%. Expectations that the Fed will lower borrowing costs by 50 basis points (bps) remain at 63%, while odds for a 25 bps cut are 37%, according to CME FedWatch Tool data.
Data-wise, US Retail Sales were higher than expected, though they trailed July’s number, while Industrial Production improved in August.
TDS Senior Commodity Analyst Daniel Ghali noted that Gold’s last leg up “may have been a stop hunt, given the odd timing for an incursion into new all-time highs alongside evidence of new shorts being added by proprietary traders.”
At the time of writing, the US Dollar Index (DXY), which tracks the buck’s value against another six currencies, advanced 0.21% to 100.92, a headwind for Bullion prices. Meanwhile, US Treasury yields along the short and long ends of the curve rose.
Meanwhile, the Middle East conflict is at the risk of a possible escalation. Al-Jazeera reported that Lebanon’s Hezbollah blamed Israel for the spree of pager explosions, saying it will get “its fair punishment.”
US Department of State spokesperson Mathew Miller said the United States was not involved in the incident and did not know who was responsible.
Looking ahead, the US economic schedule will feature housing data ahead of the Fed's interest rate decision and Chair Jerome Powell's press conference on Wednesday.
Daily digest market movers: Gold price falls following US Retail Sales, Industrial Production reports
- US Retail Sales in August rose by 0.1% MoM, surpassing expectations of a -0.2% decline. Annually, Retail Sales grew by 2.1%, down from July's 2.9%.
- Industrial Production increased by 0.8% MoM in August, rebounding from a -0.9% contraction in the previous month.
- Data from the Chicago Board of Trade suggests the Federal Reserve is expected to cut at least 111 basis points this year, according to the fed funds rate futures contract for December 2024.
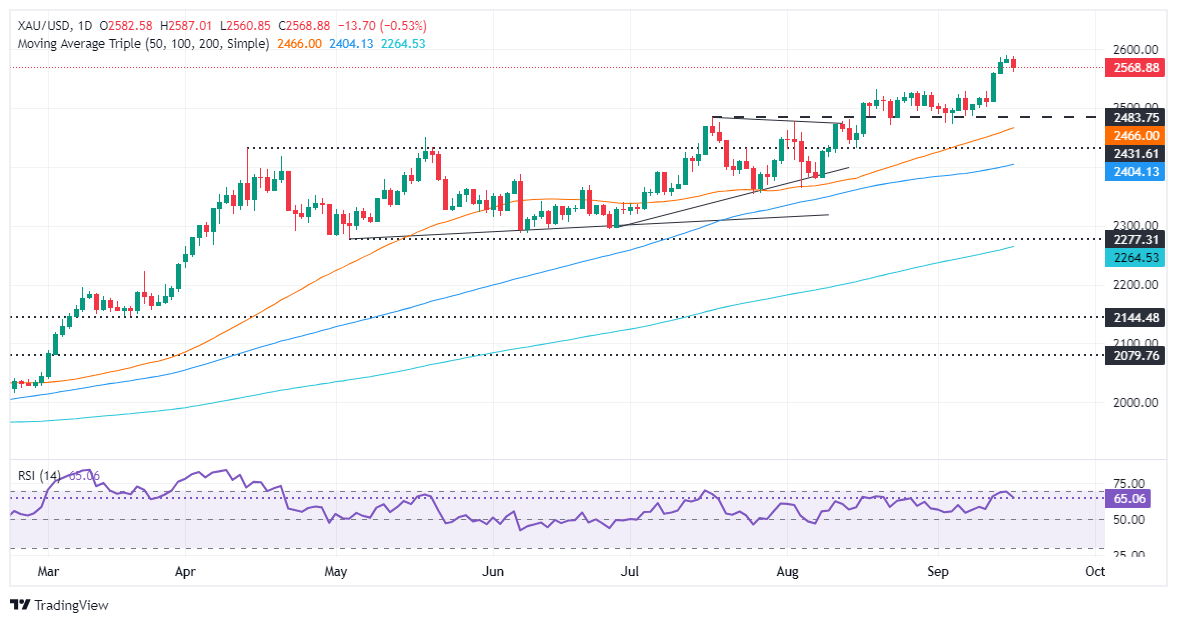
XAU/USD technical outlook: Gold price dips below $2,570
Gold prices remain upwardly biased despite retreating somewhat. The precious metal is about to form a three-candle ‘evening star’ — a bearish chart pattern. In the short term, momentum favors sellers as portrayed by the descending Relative Strength Index (RSI), breaking a previous peak level and indicating bears' strength.
In that outcome, Bullion prices could be set to test the $2,550 psychological barrier. Once cleared, the next stop will be the August 20 high, which turned support at $2,531, before aiming toward the September 6 low of $2,485.
Conversely, the XAU/USD uptrend will resume if buyers drag prices to the all-time high of $2,589. If surpassed, further upside could be expected with the psychological levels of $2,600, $2,650 and $2,700.
Gold FAQs
Gold has played a key role in human’s history as it has been widely used as a store of value and medium of exchange. Currently, apart from its shine and usage for jewelry, the precious metal is widely seen as a safe-haven asset, meaning that it is considered a good investment during turbulent times. Gold is also widely seen as a hedge against inflation and against depreciating currencies as it doesn’t rely on any specific issuer or government.
Central banks are the biggest Gold holders. In their aim to support their currencies in turbulent times, central banks tend to diversify their reserves and buy Gold to improve the perceived strength of the economy and the currency. High Gold reserves can be a source of trust for a country’s solvency. Central banks added 1,136 tonnes of Gold worth around $70 billion to their reserves in 2022, according to data from the World Gold Council. This is the highest yearly purchase since records began. Central banks from emerging economies such as China, India and Turkey are quickly increasing their Gold reserves.
Gold has an inverse correlation with the US Dollar and US Treasuries, which are both major reserve and safe-haven assets. When the Dollar depreciates, Gold tends to rise, enabling investors and central banks to diversify their assets in turbulent times. Gold is also inversely correlated with risk assets. A rally in the stock market tends to weaken Gold price, while sell-offs in riskier markets tend to favor the precious metal.
The price can move due to a wide range of factors. Geopolitical instability or fears of a deep recession can quickly make Gold price escalate due to its safe-haven status. As a yield-less asset, Gold tends to rise with lower interest rates, while higher cost of money usually weighs down on the yellow metal. Still, most moves depend on how the US Dollar (USD) behaves as the asset is priced in dollars (XAU/USD). A strong Dollar tends to keep the price of Gold controlled, whereas a weaker Dollar is likely to push Gold prices up.
Recommended Articles


