


Oil Price Forecast: Brent Falls Below $100 to Two-Month Low as Democratic Win Sparks Truce Hopes, Risks Retesting $80
TradingKey — International oil prices suffered a fresh round of heavy selling. Following the release of the U.S. midterm election results, in which the Democratic Party swept both the House of Representatives and the Senate, markets began betting that the Trump administration could face mounting pressure, potentially prompting the U.S. to reconsider military action against Iran.
On November 4, WTI crude (USOIL) plunged intraday to as low as $87.13 per barrel, a decline of over 9.3%, while Brent crude (UKOIL) hit a low of $93.22 per barrel, down about 10%, marking its largest single-day drop since May. Heading into November 5, oil prices continued their downward trend, with WTI trading at $86.96 per barrel, down 1.24%, and Brent crude at $94.07 per barrel, down 0.57%. Brent has retreated more than 20% from its late-October high near $118, sinking to its lowest level in over two months.
The Democratic victory reinforced market expectations of de-escalating warfare. U.S. Vice President Vance acknowledged that the monthslong war with Iran and the resulting surge in energy costs were key reasons for the Republican Party's midterm defeat. Democratic leaders, meanwhile, stated they would leverage Congress to push for an end to the conflict and constrain the Trump administration's tariff and military policies. With Democrats gaining control over budgets, hearings, and investigative powers, future military appropriations and operations could face stronger headwinds—a primary catalyst prompting traders to swiftly unwind crude oil risk premiums.
However, market bets on a ceasefire may have run ahead of themselves. The new Congress will not be officially seated until January 2027, leaving Trump considerable diplomatic and military maneuverability until then. Even if Democrats can curtail certain military appropriations, the U.S. president retains broad executive authority in ongoing conflicts, and Congress can hardly halt military operations immediately. Trump could currently opt to maintain limited strikes, expedite negotiations, or re-escalate military action against Iran; any of these paths would keep oil prices highly volatile.
Tehran has likewise signaled no clear concessions. Iran warned that shifts in the U.S. domestic political landscape do not necessarily translate into changes in its policy toward Iran, adding that it would mount an even larger-scale response if attacked again. Significant disagreements persist between the U.S. and Iran over the nuclear issue, sanctions relief, the unfreezing of overseas funds, and navigation arrangements in the Strait of Hormuz.
Beyond political factors, global supply outstripping demand once again forms another key narrative driving oil prices lower. JPMorgan estimates that the global oil market saw a daily supply surplus of about 1.1 million barrels in September, which widened further to 1.4 million barrels per day in October, approaching the prior year's average surplus of 1.3 million barrels per day. This indicates that the market has shifted from destocking to rebuilding inventories, stripping oil prices of the support previously provided by supply deficits.
As transportation gradually resumed in certain regions, Middle Eastern crude exports rebounded from approximately 9.8 million barrels per day in March to about 20.7 million barrels per day. At the same time, Latin American oil supplies have also been climbing. New production from oil-producing nations such as Brazil, Guyana, Argentina, and Venezuela has further expanded the volume of crude available to the global market. JPMorgan's assessment indicates that the market has transitioned from the previous inventory-depletion phase to re-accumulating stockpiles, meaning that even if Middle Eastern supply has not fully returned to pre-conflict levels, output gains from other regions are partially filling the void.
Source: TradingView
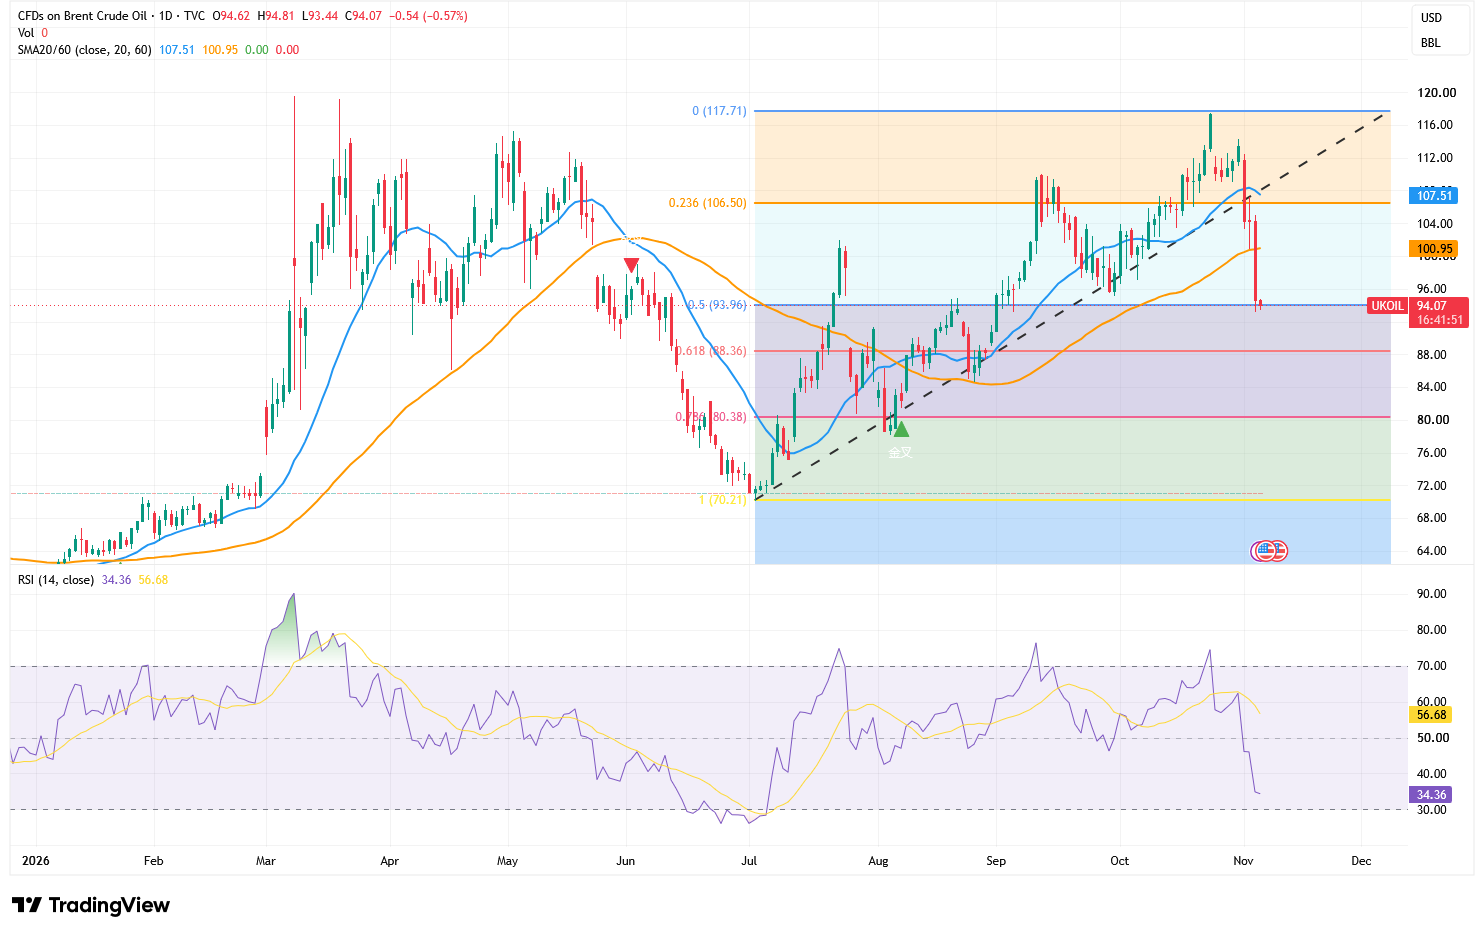
On the daily chart, Brent crude has breached its previous upward trendline and consecutively lost both its 20-day moving average at $107.51 and 60-day moving average at $100.95, recently trading at $94.07. Oil prices have pulled back approximately 20% from their October high of $117.71, with the medium-to-short-term technical structure flipping from bullish to bearish.
Currently, oil prices are testing the 50% Fibonacci retracement level at $93.96. Coinciding with the $94 psychological round-number mark, this level is critical in determining whether the decline will deepen further. If Brent can hold $94, an oversold technical rebound could emerge in the short term, with initial resistance seen at $100–$101; only a decisive reclaim of $106.50–$107.51 would meaningfully alleviate current bearish pressure.
The RSI has dropped to 34.36, well below its signal line at 56.68 and approaching the oversold threshold of 30, signaling that selling momentum remains potent, though the risk of chasing shorts is also mounting. In the near term, even if a rebound occurs, it should still be viewed as a technical correction within a downtrend until oil prices reclaim the 60-day moving average.
If Brent effectively breaks below $93.96 on a daily closing basis, the next support will shift down to $88.36, representing about 6% of further downside from current levels. If $88 is also breached on heavy volume, oil prices could test the 78.6% retracement level at $80.38, with potential downside nearing 15%.
Recommended Articles


