


Silver Price Forecast: XAG/USD slides to fresh two-month low below $59 as US yields eye more gains
- Silver price tumbles to near $58.50, the lowest level seen in two months.
- Surging US treasury Yields are keeping the Silver price under pressure.
- The FOMC minutes showed policymakers see at least one more interest rate hike this year.
Silver price (XAG/USD) posts a fresh two-month low at around $58.50 during the European trading session on Thursday. The white metal faces intense selling pressure as United States (US) bond yields eye more upside on the back of recovery signs in oil prices.
Higher yields on US-backed securities diminish the appeal of non-yielding assets, such as Silver.
As of writing, 10-year US Treasury Yields are up 1.3% to near 5.35%, closer to their two-decade high of 5.36%.
Analysts at Deutsche Bank highlight oil prices find bids after The Atlantic reported that the White House has asked the Pentagon to draw up options on strikes against Iran prior to midterms. They note that the renewed geopolitical headlines have quickly reinserted a risk premium into oil markets after the brief pullback.
Some recovery in oil prices have de-anchored global inflation fears again, a scenario that increases the odds of interest rate hikes by central banks.
Strategists at Societe Generale see US Treasury Yields rising to 5.5% after breaking above the stepping stone of 5.36%.
Meanwhile, the Federal Open Market Committee (FOMC) minutes of the September policy meeting have reaffirmed expectations of one more interest rate hike by the Federal Reserve (Fed) this year.
“Several officials warned that the AI buildout could eventually push aggregate demand ahead of supply, creating additional upward pressure on prices. The staff’s economic outlook was also stronger than in July, reinforcing the view that the economy could withstand further policy tightening. Against that backdrop, most participants considered another rate increase by year-end likely to be appropriate,” FOMC minutes showed.
Silver Technical Analysis
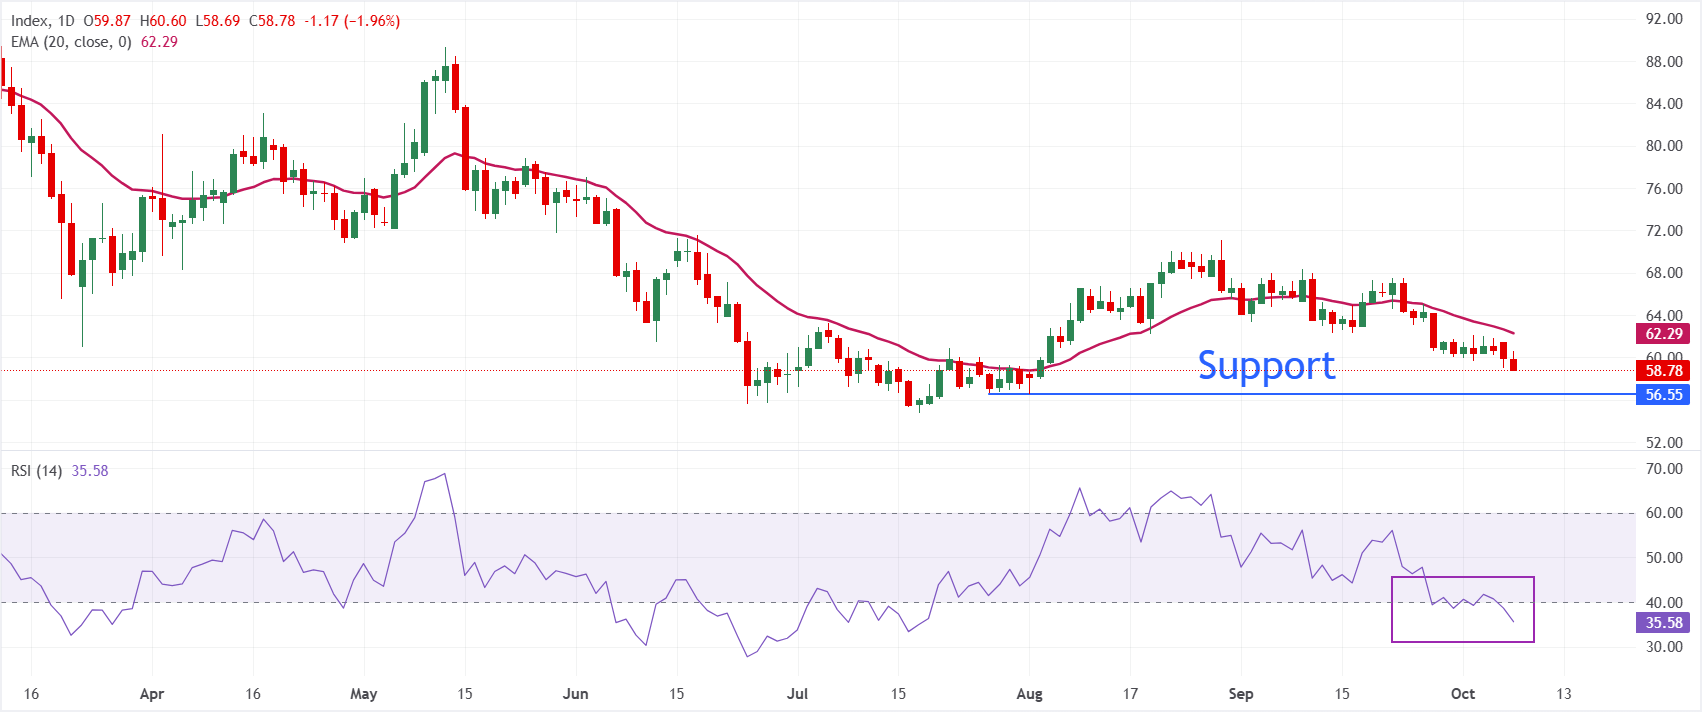
In the daily chart, XAG/USD trades at $58.50, maintaining a bearish near-term bias as price holds below the 20-day Exponential Moving Average (EMA) at $62.29. The metal has been retreating from recent highs, and the location of price under this key trend metric suggests that rallies remain capped for now. The Relative Strength Index (14) has slipped toward the mid-30s, hinting at persistent downside pressure without yet reaching extreme oversold conditions.
On the topside, initial resistance is defined by the 20-day EMA at $62.29, which would need to be reclaimed to ease the current bearish tone and open the way for a more sustained recovery. Looking down, the August low at $56.57 is the key support level.
(The technical analysis of this story was written with the help of an AI tool. Know more.)
Silver FAQs
Silver is a precious metal highly traded among investors. It has been historically used as a store of value and a medium of exchange. Although less popular than Gold, traders may turn to Silver to diversify their investment portfolio, for its intrinsic value or as a potential hedge during high-inflation periods. Investors can buy physical Silver, in coins or in bars, or trade it through vehicles such as Exchange Traded Funds, which track its price on international markets.
Silver prices can move due to a wide range of factors. Geopolitical instability or fears of a deep recession can make Silver price escalate due to its safe-haven status, although to a lesser extent than Gold's. As a yieldless asset, Silver tends to rise with lower interest rates. Its moves also depend on how the US Dollar (USD) behaves as the asset is priced in dollars (XAG/USD). A strong Dollar tends to keep the price of Silver at bay, whereas a weaker Dollar is likely to propel prices up. Other factors such as investment demand, mining supply – Silver is much more abundant than Gold – and recycling rates can also affect prices.
Silver is widely used in industry, particularly in sectors such as electronics or solar energy, as it has one of the highest electric conductivity of all metals – more than Copper and Gold. A surge in demand can increase prices, while a decline tends to lower them. Dynamics in the US, Chinese and Indian economies can also contribute to price swings: for the US and particularly China, their big industrial sectors use Silver in various processes; in India, consumers’ demand for the precious metal for jewellery also plays a key role in setting prices.
Silver prices tend to follow Gold's moves. When Gold prices rise, Silver typically follows suit, as their status as safe-haven assets is similar. The Gold/Silver ratio, which shows the number of ounces of Silver needed to equal the value of one ounce of Gold, may help to determine the relative valuation between both metals. Some investors may consider a high ratio as an indicator that Silver is undervalued, or Gold is overvalued. On the contrary, a low ratio might suggest that Gold is undervalued relative to Silver.
Recommended Articles


