


Gold bulls blink as hot US PPI, $100 Oil send yields flying
- Gold retreats as hot US PPI boosts Fed-tightening bets.
- WTI above $100 sends the US 10-year yield toward 4.93%.
- Friday CPI could decide whether September hike becomes unavoidable.
Gold price retraces by about 0.90% on Thursday as traders price in a hawkish Federal Reserve (Fed) following the release of the US Producer Price Index (PPI) for August. The risk-off sentiment in the market is supported by a jump in energy prices with Brent and WTI crude benchmarks rising above the $100 threshold. The XAU/USD trades at $4,360 at the time of writing.
XAU/USD falls as wholesale inflation and Crude spike revive Fed fears
The US PPI came in at 0.4% MoM, matching forecasts, but its annual rate reached 5.4%, slightly above the expected 5.3%. Excluding volatile items, the data were aligned with economists' predictions, though the monthly core increase was 0.2%, lower than the estimated 0.3%, and the yearly core figure was 4.6% as expected.
At the same time, the US Department of Labour revealed that Initial Jobless Claims for the week ending September 5 rose by 205K above forecasts of 205K but below the previous week's print.
The PPI reading, alongside surging energy prices, increased the chances that the Fed will raise interest rates by 25 basis points at next week’s meeting. Money markets see a nearly 70% chance for an increase, based on the CME FedWatch Tool.
West Texas Intermediate (WTI), the US Crude benchmark, cleared the $100 per barrel barrier for the first time since mid-May. In addition, US Treasury yields are rising with the 10-year benchmark note soaring nearly 7 basis points at 4.93%.
The US Dollar Index (DXY), which tracks the buck’s performance against six currencies, is up 0.2% to 98.99, exerting pressure on the yellow metal that is denominated in US Dollars.
Traders' focus shifts to Friday’s Consumer Price Index (CPI) release. August’s CPI is foreseen rising from 0.1% to 0.4% MoM, and for the last 12 months is expected to remain unchanged at 3.4%. Core CPI is estimated to hold at 0.2% Mo and to dip from 2.5% to 2.4% YoY.
The US docket will also feature the University of Michigan's preliminary Consumer Sentiment reading for September.
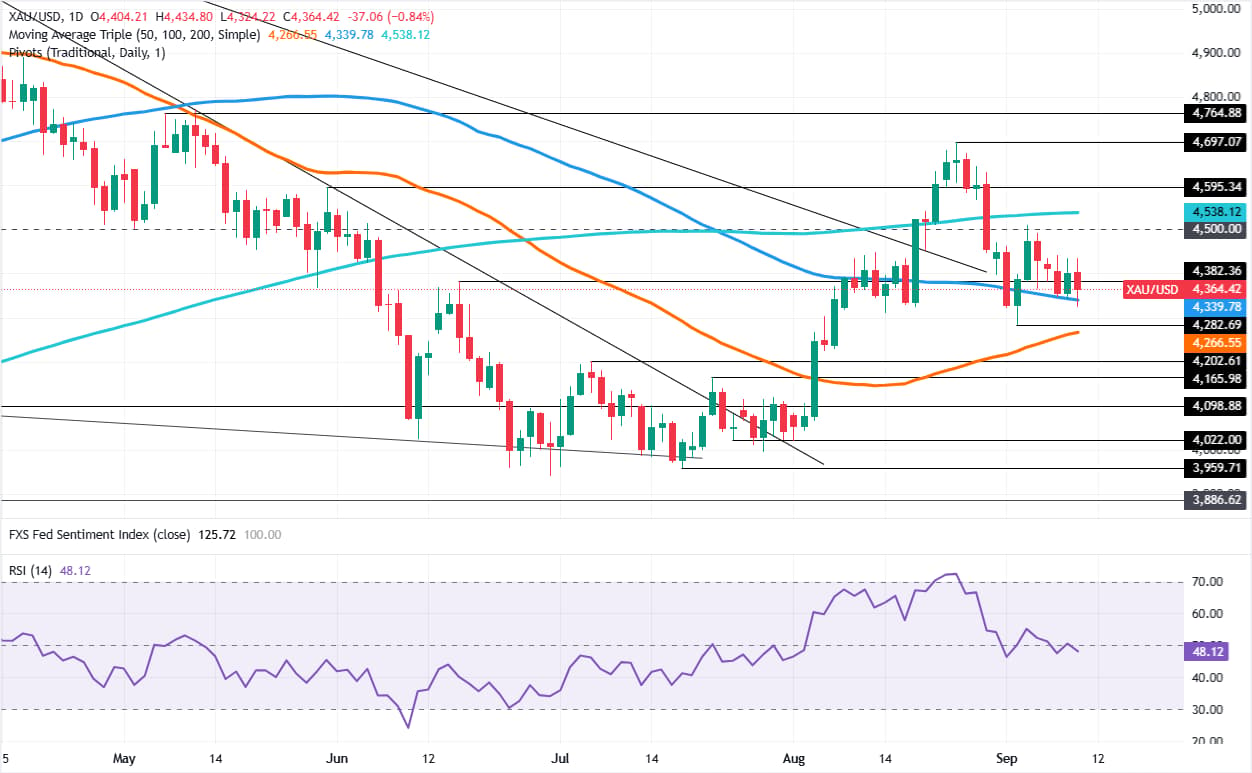
XAU/USD Price Forecast: Gold retreats toward 100-day SMA, eyes on $4,200
Gold price consolidated above the 100-day Simple Moving Average (SMA) of $4,339, keeping the yellow metal from testing the $4,282 September 2 low.
The Relative Strength Index (RSI) signals that further sideways trading lies ahead as the 200-day SMA is at $4,538, capping Bullion’s advance.
For a bearish continuation, XAU/USD must drop below the 100-day SMA and also clear the $4,300 mark. Below the next stop is $4,282, followed by the 50-day SMA at $4,266, and by $4,200.
On the upside, if Gold rises past $4,400, a move to the $4,450 psychological level is likely to. If hurdled, the $4,500 would be up for grabs, ahead of the 200-day SMA.
Gold FAQs
Gold has played a key role in human’s history as it has been widely used as a store of value and medium of exchange. Currently, apart from its shine and usage for jewelry, the precious metal is widely seen as a safe-haven asset, meaning that it is considered a good investment during turbulent times. Gold is also widely seen as a hedge against inflation and against depreciating currencies as it doesn’t rely on any specific issuer or government.
Central banks are the biggest Gold holders. In their aim to support their currencies in turbulent times, central banks tend to diversify their reserves and buy Gold to improve the perceived strength of the economy and the currency. High Gold reserves can be a source of trust for a country’s solvency. Central banks added 1,136 tonnes of Gold worth around $70 billion to their reserves in 2022, according to data from the World Gold Council. This is the highest yearly purchase since records began. Central banks from emerging economies such as China, India and Turkey are quickly increasing their Gold reserves.
Gold has an inverse correlation with the US Dollar and US Treasuries, which are both major reserve and safe-haven assets. When the Dollar depreciates, Gold tends to rise, enabling investors and central banks to diversify their assets in turbulent times. Gold is also inversely correlated with risk assets. A rally in the stock market tends to weaken Gold price, while sell-offs in riskier markets tend to favor the precious metal.
The price can move due to a wide range of factors. Geopolitical instability or fears of a deep recession can quickly make Gold price escalate due to its safe-haven status. As a yield-less asset, Gold tends to rise with lower interest rates, while higher cost of money usually weighs down on the yellow metal. Still, most moves depend on how the US Dollar (USD) behaves as the asset is priced in dollars (XAU/USD). A strong Dollar tends to keep the price of Gold controlled, whereas a weaker Dollar is likely to push Gold prices up.
Recommended Articles


