
NZD/JPY Price Analysis: Bullish momentum on the rise, short-term outlook still negative
- Daily chart reveals an ongoing tussle between buyers and sellers; RSI demonstrates growing buying.
- The hourly RSI stands in positive territory pointing south, while MACD shows a contraction of negative momentum.
- As long as the pair stands below the 20-day SMA, the outlook will be negative for the short term.
The NZD/JPY pair is trading at 90.98, with a gain of 0.22%. There is a continuous tug of war between both buyers and sellers, and neither manages to establish clear dominance. Though the pair demonstrates strengthened buyer momentum, it also retains an undercurrent of negative momentum trading below the 20-day Simple Moving Average (SMA). However, the overall trend will remain bullish if it holds above the 100 and 200-day SMAs.
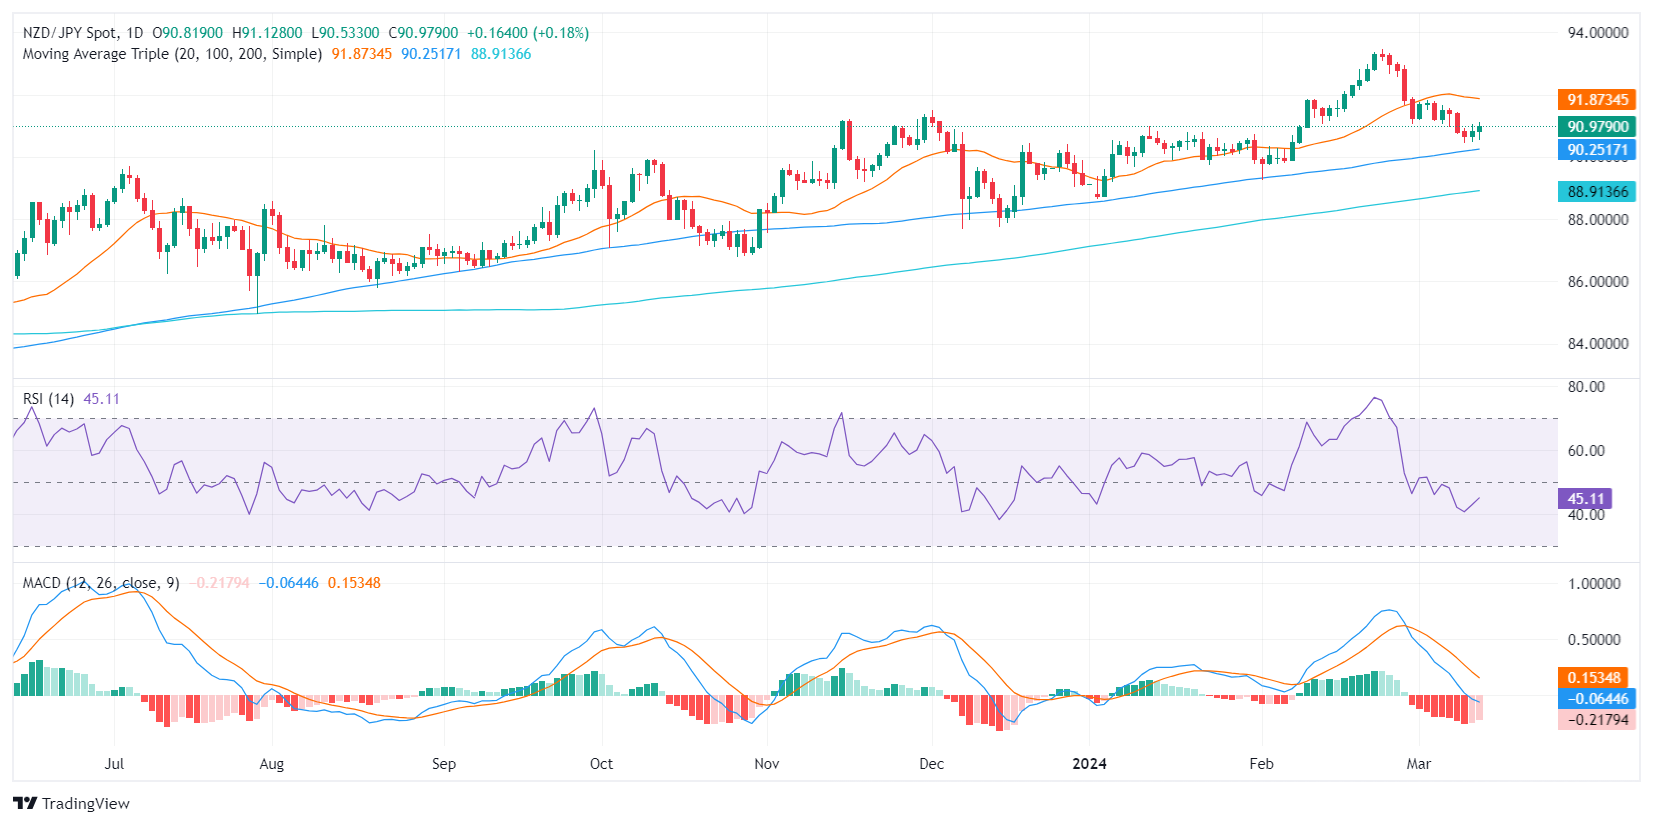
On the daily chart, the Relative Strength Index (RSI) for the NZD/JPY pair is currently in negative territory. The RSI, after bottoming out near 40 on Tuesday, has shown an upward trend, signaling growing buyer momentum. The Moving Average Convergence Divergence (MACD) histogram's red bars are on a downward trend, indicating a negative but less intense momentum.
NZD/JPY daily chart
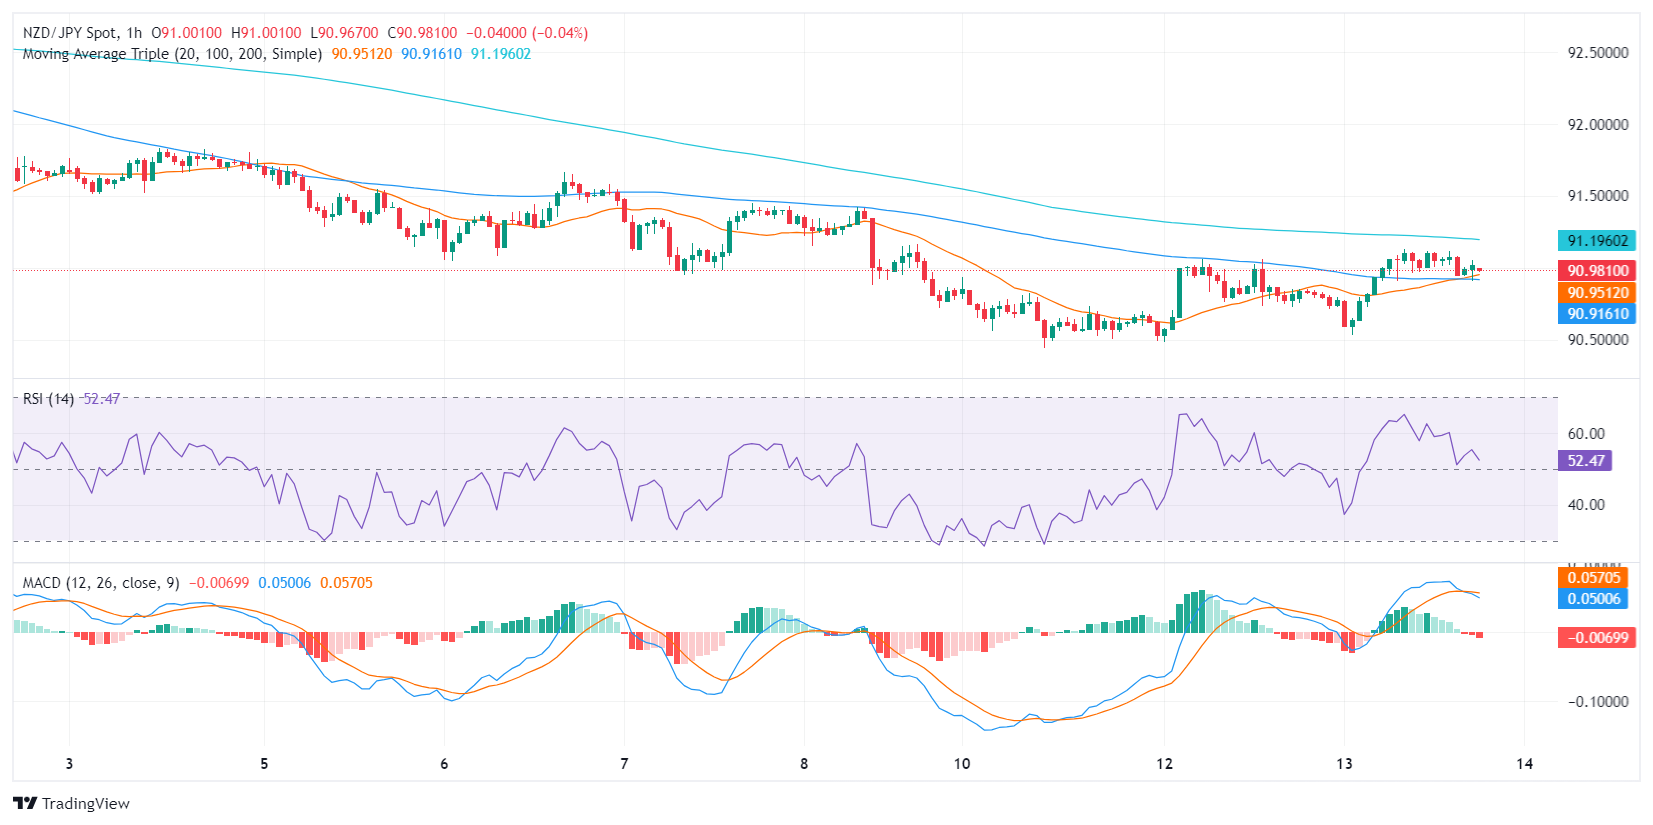
Upon examining the hourly charts, the RSI appears to oscillate in positive territory during recent hours but prints a negative slope. This is in contrast with the daily chart, suggesting a slowing buying momentum. The MACD histogram also shows rising red bars, reflecting a rising rate of negative momentum. In conclusion, the data shows that the bulls are gaining some traction on the daily chart, and now seem to be consolidating on the shorter timeframes. However, if the buyers want to confirm, the first target is the 20-day SMA at around 91.85.
NZD/JPY hourly chart
Related Articles


