EUR/JPY Price Analysis: The first upside barrier will emerge above 169.80

Source Fxstreet
  • EUR/JPY attracts some buyers around 169.50 in Monday’s early European session. 
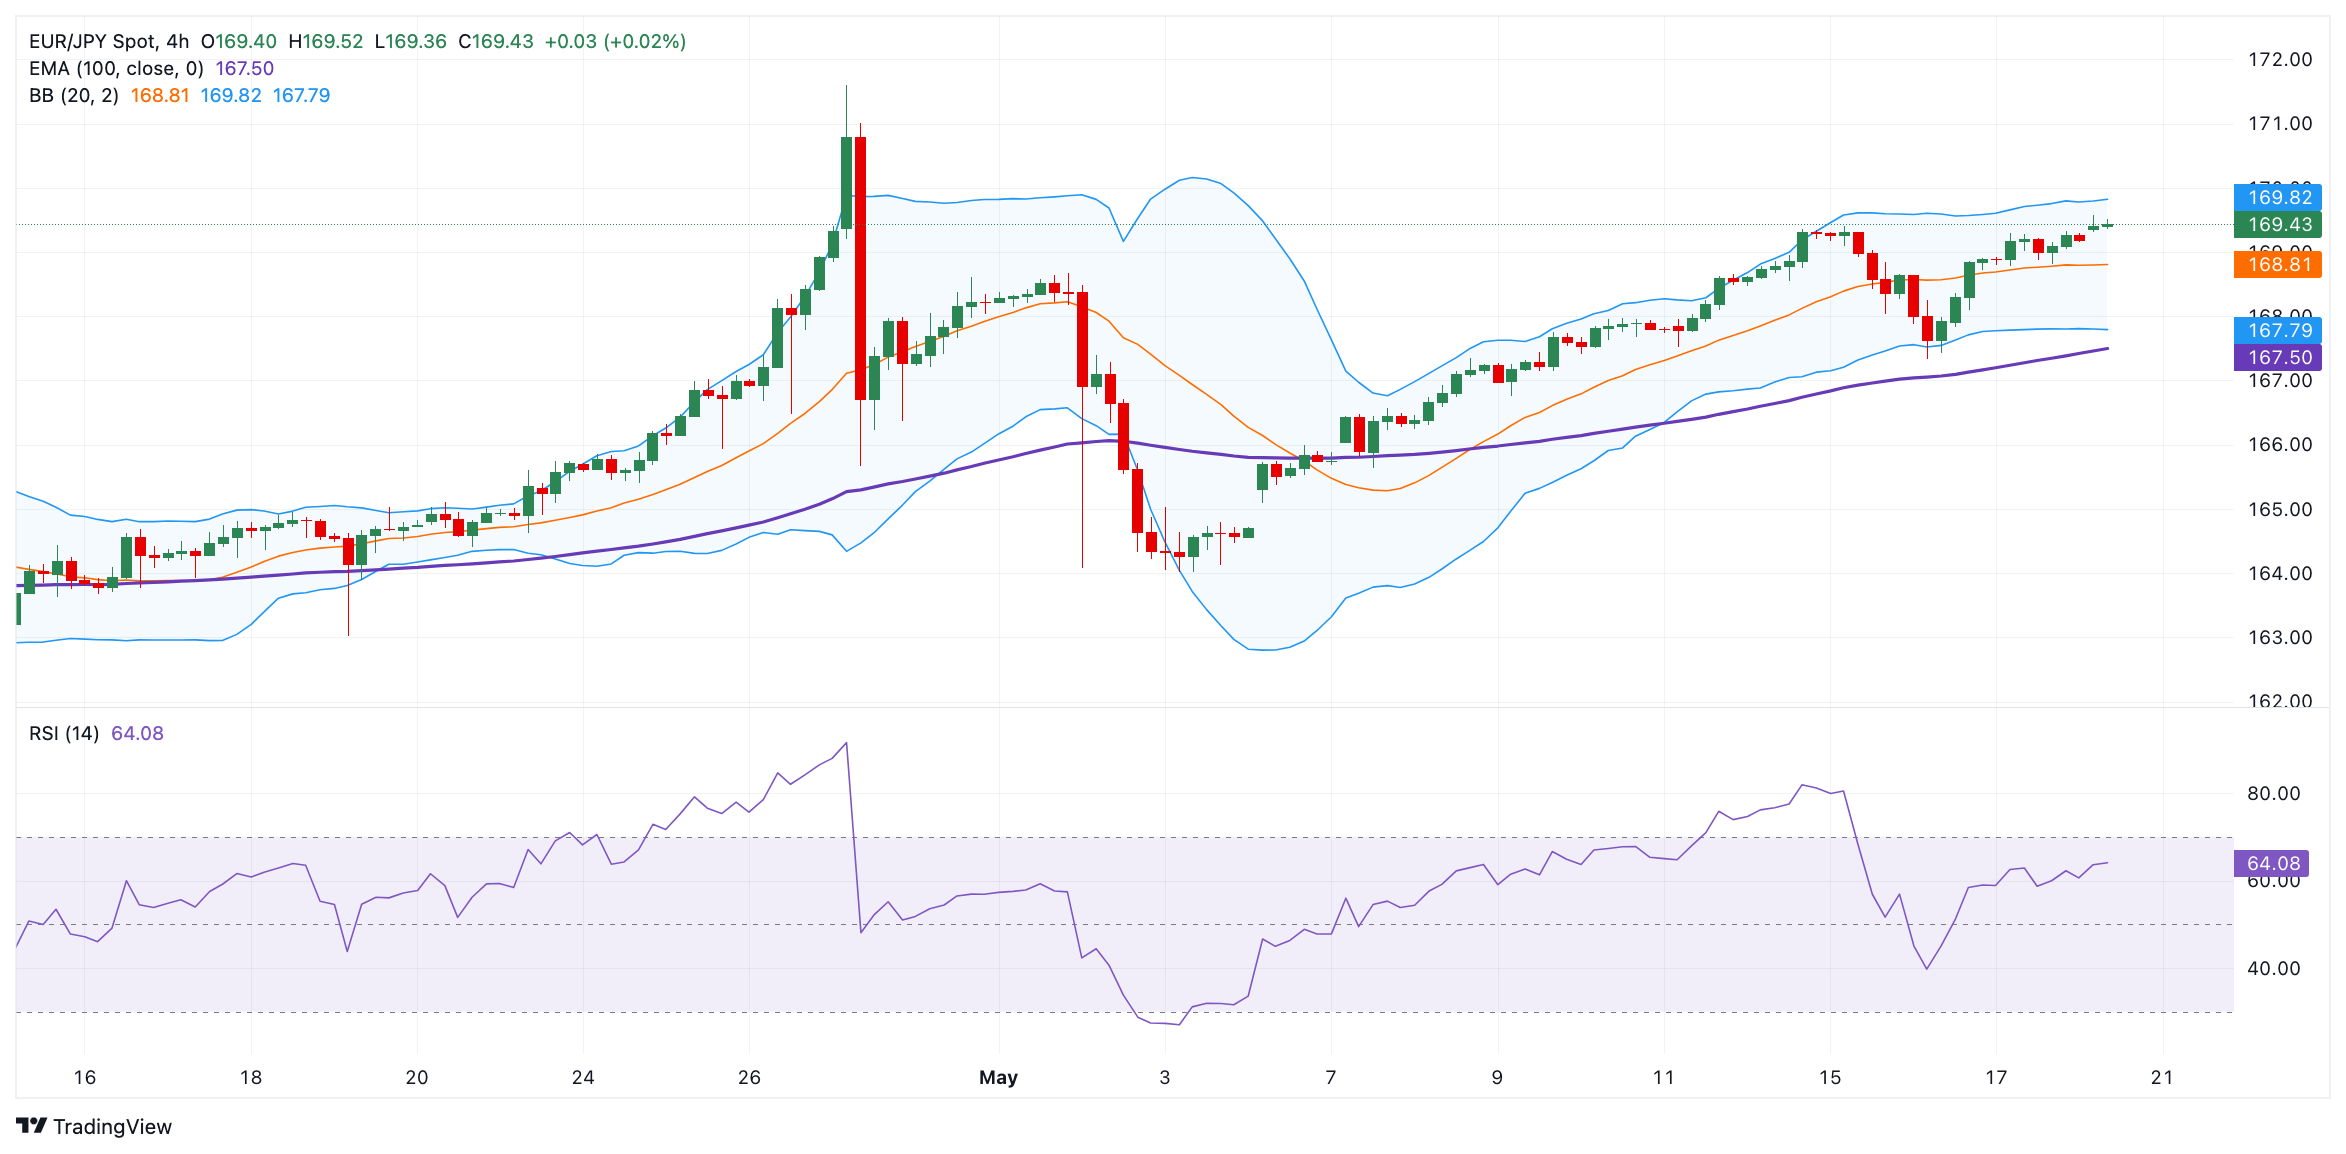
  • The positive outlook of the cross remains intact above the key EMA, with a bullish RSI indicator. 
  • The first upside target will emerge at 169.82; the initial support level is seen at 168.78.

The EUR/JPY cross gains traction near 169.50 during the early European trading hours on Monday. The weakened Japanese Yen (JPY) is driven by the weaker-than-expected Japan GDP growth numbers for Q1, challenging the Bank of Japan's (BoJ) push to get interest rates further away from near zero.

EUR/JPY keeps the bullish vibe unchanged as the cross holds above the 100-period Exponential Moving Averages (EMA) on the four-hour chart. Furthermore, the path of least resistance level for the cross is to the upside, with the Relative Strength Index (RSI) standing in bullish territory near 64.50.

The first upside barrier for EUR/JPY will emerge near the upper boundary of the Bollinger Band at 169.82. The next hurdle is seen at the 170.00 psychological round mark. A break above the latter will expose an all-time high of 171.60, en route to the 172.00 level. 

On the other hand, a low of May 17 at 168.78 acts as an initial support level for the cross. The additional downside filter to watch is the lower limit of the Bollinger Band at 167.79, followed by the 100-period EMA at 167.50, and then a low of May 16 at 167.33. A breach of this level will see a drop to a low of April 29 at 165.66.  

EUR/JPY four-hour chart

EUR/JPY

Overview
Today last price 169.44
Today Daily Change 0.25
Today Daily Change % 0.15
Today daily open 169.19
 
Trends
Daily SMA20 167.17
Daily SMA50 165.04
Daily SMA100 162.82
Daily SMA200 160.76
 
Levels
Previous Daily High 169.33
Previous Daily Low 168.78
Previous Weekly High 169.4
Previous Weekly Low 167.33
Previous Monthly High 171.6
Previous Monthly Low 162.28
Daily Fibonacci 38.2% 169.12
Daily Fibonacci 61.8% 168.99
Daily Pivot Point S1 168.87
Daily Pivot Point S2 168.55
Daily Pivot Point S3 168.32
Daily Pivot Point R1 169.41
Daily Pivot Point R2 169.64
Daily Pivot Point R3 169.96


Disclaimer: For information purposes only. Past performance is not indicative of future results.
placeholder
Ethereum (ETH) Price Closes Above $3,900 — Is a New All-Time High Possible Before 2024 Ends?Once again, the price of Ethereum (ETH) has risen above $3,900. This bounce has hinted at a further price increase for the altcoin before the end of the year.
Author  Beincrypto
Dec 17, 2024
Once again, the price of Ethereum (ETH) has risen above $3,900. This bounce has hinted at a further price increase for the altcoin before the end of the year.
placeholder
Analyst Flags XRP as Market’s ‘Best Risk/Reward’ Play as Token Tests Critical $1.60 SupportCrypto analyst Scott Melker identifies a prime risk/reward setup for XRP as it tests key support at $1.60, offering a tight stop-loss against potential upside targets near $2.00.
Author  Mitrade
Feb 03, Tue
Crypto analyst Scott Melker identifies a prime risk/reward setup for XRP as it tests key support at $1.60, offering a tight stop-loss against potential upside targets near $2.00.
placeholder
Ethereum Price Forecast: ETH faces heavy distribution as price slips below average cost basis of investorsEthereum (ETH) extended its decline on Wednesday, dropping more than 5% over the past 24 hours toward the $2,100 level, which is below the $2,310 average cost basis or realized price of investors, according to CryptoQuant's data.
Author  FXStreet
Feb 05, Thu
Ethereum (ETH) extended its decline on Wednesday, dropping more than 5% over the past 24 hours toward the $2,100 level, which is below the $2,310 average cost basis or realized price of investors, according to CryptoQuant's data.
placeholder
Bitcoin Drops to $70,000. U.S. Government Refuses to Bail Out Market, End of Bull Market or Golden Pit? The U.S. government refuses to bail out Bitcoin, and with Fed rate cuts nowhere in sight, a continued downward trend to test for a bottom is likely after a brief rebound.During the mid-da
Author  TradingKey
Feb 05, Thu
The U.S. government refuses to bail out Bitcoin, and with Fed rate cuts nowhere in sight, a continued downward trend to test for a bottom is likely after a brief rebound.During the mid-da
placeholder
Bitcoin Surrenders $65,000 as Analysts Warn of ‘Structural’ Market BreakBitcoin plunges 11% to break $65k as analysts term the crash "structural," citing a $1 trillion market wipeout and $2.09 billion in daily liquidations.
Author  Mitrade
Feb 06, Fri
Bitcoin plunges 11% to break $65k as analysts term the crash "structural," citing a $1 trillion market wipeout and $2.09 billion in daily liquidations.
Related Instrument
goTop
quote