

Hammer Candlestick Pattern: Definition, Importance & Usage Examples
1. What is a Hammer Candlestick?
A Hammer Candlestick is a distinctive pattern in technical analysis that signals a potential bullish reversal. It is characterized by a small body at the top with a long lower shadow, at least twice the length of the body, and little to no upper shadow. This creates a candlestick shape resembling a hammer.
This formation suggests that although the selling pressure was initially strong, driving the price down, significant buying interest emerged, pushing the price back up to close near the opening level or even surpassing it. The presence of a Hammer Candlestick indicates that the market is testing for a bottom and may be on the cusp of a turnaround, as buyers begin to outweigh sellers. For the pattern to be confirmed as a bullish reversal, the following period should close higher, indicating a shift in momentum.
2. What is a Hammer Candlestick?
1.1 Concept and form
A Hammer Candlestick is a distinctive pattern in technical analysis that signals a potential bullish reversal. It is characterized by a small body at the top with a long lower shadow, at least twice the length of the body, and little to no upper shadow. This creates a candlestick shape resembling a hammer.

Source: Moomoo.com
This formation suggests that although the selling pressure was initially strong, driving the price down, significant buying interest emerged, pushing the price back up to close near the opening level or even surpassing it. The presence of a Hammer Candlestick indicates that the market is testing for a bottom and may be on the cusp of a turnaround, as buyers begin to outweigh sellers. For the pattern to be confirmed as a bullish reversal, the following period should close higher, indicating a shift in momentum.
1.2 Examples
Example 1: The 4-hour gold chart demonstrates that the emergence of a hammer candlestick amidst a downward trend, followed by subsequent bullish candlesticks, frequently indicates either the conclusion of the bearish trend or a temporary pause in its downward momentum.

Gold price chart (Source: Mitrade)
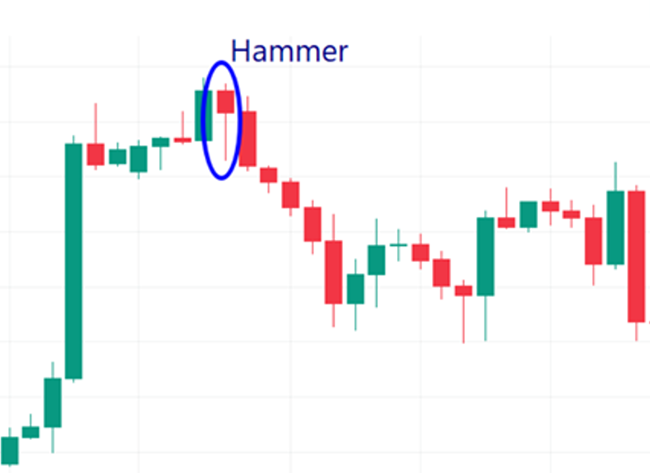
Example 2: The 4-hour EUR/USD chart below displays a hammer candlestick pattern emerging at the peak of an upward trend, followed by a reversal in price direction. However, this candlestick pattern is also known as a hanging man, belonging to the hammer candlestick group, as will be clarified in the following section.

EUR/USD price chart (Source: Mitrade)
1.3 Categorization
According to the identification characteristics of the hammer candlestick, within the hammer candlestick group, there can be classified into 4 types with different names:
Hammer candlestick (Bullish hammer)
Hanging man candlestick (Bearish hammer)
Inverted hammer candlestick
Shooting star candlestick
- Bullish Hammer Candlestick: This pattern appears at the bottom of a downtrend and signals a potential bullish reversal.

Source: IG
- Bearish Hammer (or Hanging Man): This pattern looks identical to the bullish hammer but occurs at the top of an uptrend. It signals a potential bearish reversal if followed by a downward price movement.
")
Source: Yahoo Finance
- Inverted Hammer Candlestick: Similar to the bullish hammer, this pattern also suggests a bullish reversal. It features a long upper wick, a small real body, and little to no lower wick. The price opens at the bottom of a downtrend, then buyers push the price up, reflected in the extended upper wick before it returns down towards the opening level but closes above it.

Source: Yahoo Finance
- Shooting star: The upper end has a small body and a long wick, whereas the lower wick is short or absent. The Shooting Star signals a bearish reversal because buyers drove the price higher, but sellers took control and pulled it down to near its starting level. A bearish candle with a lower closing price than the Shooting Star confirms the reversal. This pattern alerts traders to profit-taking or short-selling.

Source: Investobull
2. Importance of Hammer Candlestick Chart
The Hammer Candlestick Chart is a critical tool in technical analysis, signaling potential bullish reversals in the market. This pattern is easily recognizable by its small real body and a long lower shadow, which is at least twice the size of the body, resembling a hammer.
The importance of this chart lies in its ability to indicate that, despite opening at a high and trading significantly lower, the security's price has closed near its opening value, suggesting strong buying interest. When accompanied by subsequent price increases, the Hammer Candlestick can confirm a shift in momentum from bearish to bullish.
It is particularly significant after a downtrend, as it may suggest that the market is attempting to find a bottom, hinting at a capitulation by sellers and a potential increase in price. However, traders are advised to seek confirmation through additional indicators, as the Hammer Candlestick on its own does not guarantee a reversal but rather suggests the possibility of one. This makes it an invaluable pattern for investors looking to capitalize on early signs of market recovery
There are some advantages and disadvantages of the Hammer Candlestick pattern:
Advantages | Disadvantages |
|
|
3. The difference between Hammer Candlestick and Doji
The Hammer Candlestick and Doji are both significant patterns in technical analysis, offering insights into market sentiment and potential price movements. The visual characteristics of the Hammer candlestick and Dragonfly Doji share many similarities, differing primarily in the body segment of the candlestick.

Bitcoin price chart (Source: Mitrade)
Comparison | Hammer candlestick | Dragonfly Doji |
Appearance | + A small but clear candle body. + A long lower shadow (or wick) and little to no upper shadow. | + A dragonfly Doji forms when the open, high, and close are all the same (or very close). It creates a small or nearly no candle body. + A long lower shadow (or wick) and little to no upper shadow. |
Interpretation | A hammer typically forms during a downtrend and signals a potential bullish reversal. It suggests that despite initial selling pressure, buyers stepped in to push the price back up, often indicating that the bottom of the downtrend may be near. | The Dragonfly Doji represents indecision in the market, with its small real body and shadows on both sides, reflecting a balance between buyers and sellers. Unlike the Hammer, which suggests a potential upside reversal following a decline, the Doji could precede either a price reversal or continuation, depending on subsequent price action. |
While both patterns are valuable, they serve as indicators under different market conditions and should be confirmed by other technical analysis methods for greater accuracy.
4. The difference between Hammer Candlestick and Hanging Man
The Hammer Candlestick and Hanging Man are both significant patterns in the realm of technical analysis, each serving as a potential harbinger of trend reversals. Despite their visual similarity, they are differentiated by the context in which they appear. The Hammer is identified at the bottom of a downtrend, signaling a bullish reversal. This pattern suggests that although selling pressure was present, by the end of the period, buyers managed to push the prices back up, indicating a potential increase in buying interest and a possible shift in market sentiment.

Source: Bestanalysis.in
Conversely, the Hanging Man forms at the top of an uptrend, mirroring the Hammer in shape but not in implication. The long lower shadow of the Hanging Man indicates that sellers are starting to outnumber buyers, driving the price down during the session, only for it to close near the high, reflecting uncertainty and potential weakness among buyers. If confirmed with subsequent bearish price action, it can signal a bearish reversal, suggesting that the uptrend may be running out of steam and that a downward trend could ensue.
Both patterns require confirmation; for the Hammer, a bullish continuation, and for the Hanging Man, a bearish follow-through. This confirmation helps traders to avoid false signals and to trade with greater confidence in the anticipated trend reversal. The key takeaway is that while both patterns indicate a struggle between buyers and sellers, the Hammer suggests a shift in control from sellers to buyers, whereas the Hanging Man indicates that buyers may be losing their grip, with sellers poised to take over. Understanding these nuances can be pivotal for traders looking to capitalize on shifts in market trends.
5. Integrating other technical indicators
One of the drawbacks of the Hammer candlestick is its potential for false signals. Moreover, relying solely on a single Hammer candlestick pattern to forecast price trends can introduce significant risks. Therefore, combining the Hammer candlestick with other technical indicators or using it within a specific context to form a price pattern can assist traders in making more accurate predictions for the next price trend.
5.1 Candlestick chart pattern
 AT&T price chart (Source: Mitrade)
In the stock price chart of AT&T above, it can be observed that despite the presence of several hammer candles during a downtrend, there was not necessarily a subsequent reversal.
- Following the hammer candle (in blue circle) within the downtrend, a bearish Marubozu candle with a gap down from the hammer's body indicated the continuation of the downtrend. However, when the hammer candle (in red circle) appeared at the end of the downtrend, it was followed by a Doji candle and subsequently a bullish Marubozu candle, signaling a clear reversal confirmation.
5.2 Combining with moving average
To predict price trends in short-term trading, the 4-hour price chart of the EUR/AUD forex pair can be chosen. This chart can be combined with the 5-period Moving Average (MA5) and the 9-period Moving Average (MA9).

EUR/AUD price chart (Source: Mitrade)
In the above price chart, during a downtrend, a hammer candlestick appears, followed by a bullish candlestick along with the MA5 line (in green) crossing above the MA9 line (in red), indicating a confirmation signal of an ensuing uptrend.
5.3 Combining with Fibonacci Retracement
Traders can utilize Fibonacci retracements to identify support and resistance levels. The hammer pattern, along with these levels, helps traders spot reversal points on charts.

FR40 Index price chart (Source: Mitrade)
In the FR40 Index price chart above, the first hammer candlestick appears during the downward trend but remains below key Fibonacci retracement levels such as 38.2%, 50%, or 61.8%. However, the second hammer candlestick appears, and its closing price aligns precisely with the 50% Fibonacci retracement level. This alignment can strongly indicate a trend reversal thereafter.
In addition to the technical indicators introduced above, traders can also utilize other technical indicators such as RSI and MACD, combined with hammer candles across various time frames, to align with their trading strategies. Moreover, implementing risk management techniques through the use of stop-loss orders or trailing stops can significantly contribute to minimizing potential losses during the investment process.
6. FAQs about Hammer Candlestick Pattern
#6.1 Is the hammer candlestick bullish or bearish?
The hammer candlestick is considered a bullish pattern, typically occurring at the bottom of a downtrend. It signals a potential reversal in price direction, indicating that selling pressure is subsiding and buyers are gaining control.
For the pattern to be confirmed as bullish, the candle following the hammer must close above its price, suggesting a shift in momentum from sellers to buyers. Traders often seek additional confirmation through higher trading volume or other bullish indicators before considering a change in trend.
#6.2 Which chart is the best for intraday trading?
The best chart type often depends on personal preference, trading style, and the specific securities you’re trading. However, price action trading is often highlighted as a crucial strategy for success in day trading, which relies on understanding the price movements to time market entries. For this, a chart that clearly shows price action, such as a candlestick chart, can be very beneficial.
These charts provide visual cues about the open, high, low, and close values within a specific timeframe, making it easier to identify trends and patterns. Additionally, incorporating technical indicators can offer insights into market momentum and volatility, aiding in decision-making for intraday trades. They make it easier to identify patterns and execute short-term trades. Keep an eye on candlestick patterns like the Hammer, Doji, and Engulfing patterns for potential trading opportunities.
#6.3 How can I trade using the Hammer Candlestick Pattern?
To trade using the Hammer Candlestick Pattern, one should look for confirmation with a higher close on the following day to validate the pattern. It's also important to consider the volume during the formation of the hammer; higher volume can indicate stronger buying pressure.
Additionally, placing a stop loss below the hammer's low can help manage risk. It's crucial to remember that no pattern guarantees a market turn, and the Hammer Candlestick should be used in conjunction with other analysis methods to make informed trading decisions.
#6.4 How should traders manage risks when trading based on hammer candlestick patterns?
Answer: Traders should manage risk by setting stop-loss orders and position sizing to protect themselves from significant losses. Stop-loss orders can be placed below the low of the hammer candlestick to limit potential downside risk, while position sizing ensures that losses are kept within acceptable limits relative to the trader's account size. Additionally, trailing stops can be used to lock in profits as the trade moves in the desired direction.
Before making any trading decisions, it is important to equip yourself with sufficient fundamental knowledge, have a comprehensive understanding of market trends, be aware of risks and hidden costs, carefully consider investment targets, level of experience, risk appetite, and seek professional advice if necessary.
Furthermore, the content of this article is solely the author's personal opinion and does not necessarily constitute investment advice. The content of this article is for reference purposes only, and readers should not use this article as a basis for any investment decisions.
Investors should not rely on this information as a substitute for independent judgment or make decisions solely based on this information. It does not constitute any trading activity and does not guarantee any profits in trading.
If you have any inquiries regarding the data, information, or content related to Mitrade in this article, please contact us via email: insights@mitrade.com. The Mitrade team will carefully review the content to continue improving the quality of the article.


