USD/THB plunges and approaches the 100-day SMA, USD cushioned by Fed officials

Source Fxstreet
  • USD/THB edged lower in Friday's session to stand at 36.10, showcasing a loss of 0.36%, as the bears maintain steady control.
  • Data released during the week indicates a weak US economy, igniting market predictions for early interest rate cuts from the Federal Reserve.
  • The hopes of sooner rate cuts were offset by the cautious tone of the Fed officials.

The USD/THB continued to lose ground on Friday despite the cautious tone seen in the latest Federal Reserve (Fed) officials' words.

US economic data published over the course of the week revealed signs of a potential economic slowdown. The indicators in question included April's Consumer Price Index (CPI) and Retail Sales figures as well as mounting weekly unemployment claims - all of which momentarily pushed the US Dollar into a selling pressure spiral. Nevertheless, the USD regained traction as Fed officials including Atlanta’s Fed President Raphael Bostic and his Cleveland Fed counterpart, Loretta Mester, reassured markets of their satisfaction with the unfolding inflation scenario and its accordance with the current monetary policy expressing that they need further confidence to start cutting. However, if data continues to underperform, the USD might see further losses.

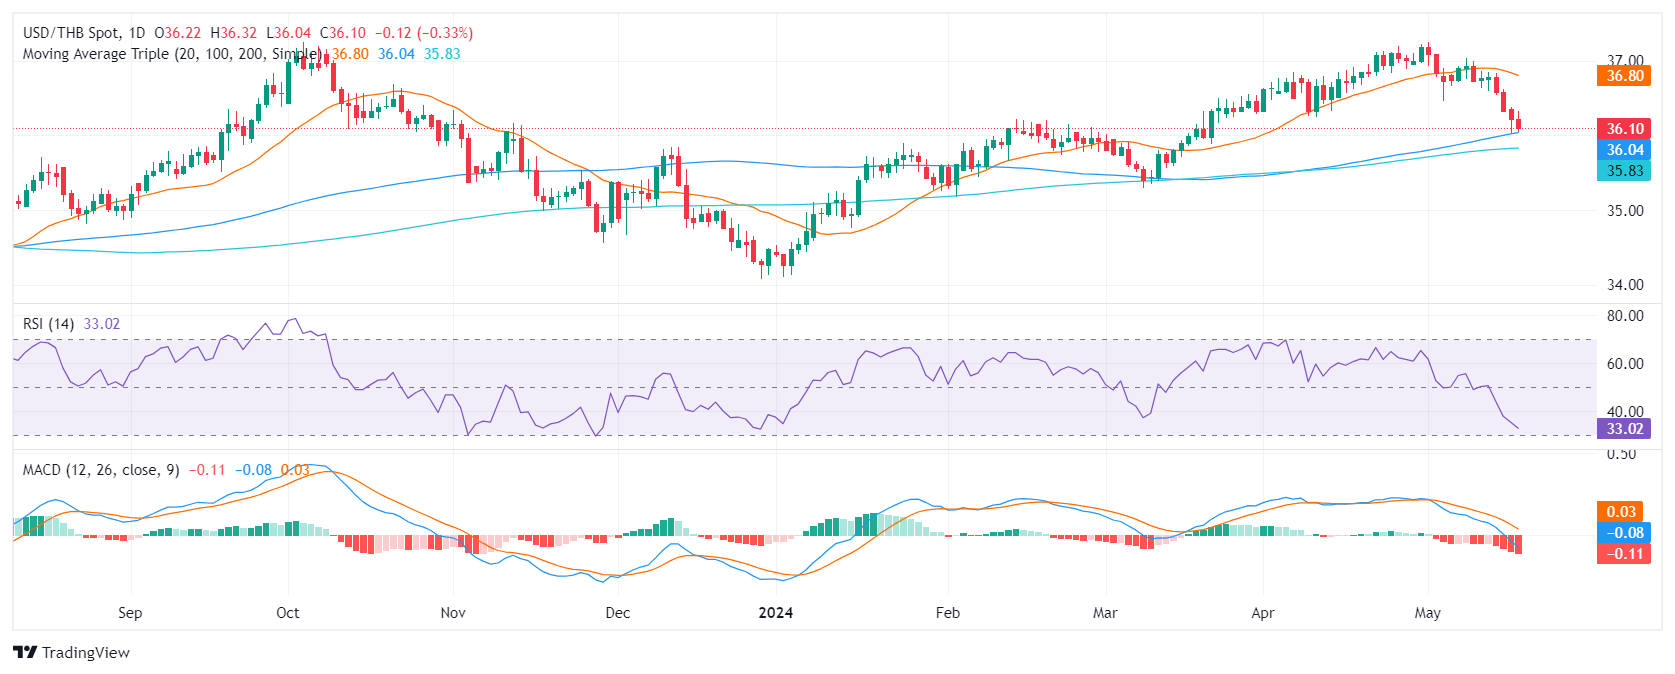
USD/THB technical analysis

The daily Relative Strength Index (RSI) for the pair reveals a trend toward negative territory and approached oversold conditions. Simultaneously, the Moving Average Convergence Divergence (MACD) histogram presents flat red bars, signaling negative momentum with no expected substantial shift for the session.

USD/THB daily chart

Expanding to the broader picture, the USD/THB is situated beneath its 20-day Simple Moving Average (SMA). This indicates a robust sign of inherent bearish sentiment in the short term. Regardless of the short-term pessimistic view, the pair's ability to stay above its 100 and 200-day SMAs remains essential to keep the positive, long-term trend intact.


Disclaimer: For information purposes only. Past performance is not indicative of future results.
placeholder
Gold Price Forecast: XAU/USD declines below $4,050 on USD strength and hawkish Fed comments Gold price (XAU/USD) extends the decline to around $4,030 during the early Asian session on Tuesday. The precious metal edges lower as traders dialed back expectations of a US interest rate cut next month.
Author  FXStreet
Nov 18, Tue
Gold price (XAU/USD) extends the decline to around $4,030 during the early Asian session on Tuesday. The precious metal edges lower as traders dialed back expectations of a US interest rate cut next month.
placeholder
Top 3 Price Prediction: Bitcoin, Ethereum, Ripple – BTC, ETH and XRP Look for a Foothold After a Sharp ShakeoutBitcoin trades near $92,600 after a dip below $90,000, while Ethereum around $3,118 and XRP near $2.21–$2.23 sit on key support zones, as BTC, ETH and XRP all try to turn a sharp correction into a tradable rebound rather than a deeper slide.
Author  Mitrade
Nov 19, Wed
Bitcoin trades near $92,600 after a dip below $90,000, while Ethereum around $3,118 and XRP near $2.21–$2.23 sit on key support zones, as BTC, ETH and XRP all try to turn a sharp correction into a tradable rebound rather than a deeper slide.
placeholder
Could XRP Really Catch Ethereum? Analysts Revisit the Question as ETF Tailwinds BuildAs US spot XRP ETFs roll out and issuers like Canary Capital and Franklin Templeton step in, analysts say XRP’s market cap could climb on growing utility and ETF accumulation—but overtaking Ethereum’s $373 billion smart-contract powerhouse remains a long-shot, at least for now.
Author  Mitrade
Nov 20, Thu
As US spot XRP ETFs roll out and issuers like Canary Capital and Franklin Templeton step in, analysts say XRP’s market cap could climb on growing utility and ETF accumulation—but overtaking Ethereum’s $373 billion smart-contract powerhouse remains a long-shot, at least for now.
placeholder
Bitcoin's Drop to $86K Approaches 'Max Pain' Zone, Yet Presents Potential Buying OpportunityAnalysts identify the $84,000 to $73,000 range as Bitcoin's likely "max pain" territory where capitulation may occur.
Author  Mitrade
Nov 21, Fri
Analysts identify the $84,000 to $73,000 range as Bitcoin's likely "max pain" territory where capitulation may occur.
placeholder
Market Meltdown: BTC, ETH, and XRP Capitulate as Bears Seize ControlBitcoin trades around $85,900 after breaking below $86,000, with Ethereum under $2,791 and XRP below $1.99 as BTC, ETH and XRP extend weekly losses of 8–10%, forcing traders to focus on supports at $85,000, $2,749 and $1.77 for clues on whether this sell-off has further to run.
Author  Mitrade
Nov 21, Fri
Bitcoin trades around $85,900 after breaking below $86,000, with Ethereum under $2,791 and XRP below $1.99 as BTC, ETH and XRP extend weekly losses of 8–10%, forcing traders to focus on supports at $85,000, $2,749 and $1.77 for clues on whether this sell-off has further to run.
goTop
quote