

GBP/USD Price Forecast: Surpasses 1.3000 as bullish momentum builds
- GBP/USD clears 100-day SMA; aims for October’s 30 high of 1.3047.
- Buyers may push toward 1.3100, with 50-day SMA resistance at 1.3118.
- Failure to hold 1.3000 could see the pair retreat to 1.2908 support level.
The Pound Sterling advanced against the Greenback during the North American session, with buyers reclaiming the 1.3000 figure and clearing the 100-day Simple Moving Average (SMA) resistance at 1.2982. At the time of writing, the GBP/USD trades at 1.3011, up by 0.43%.
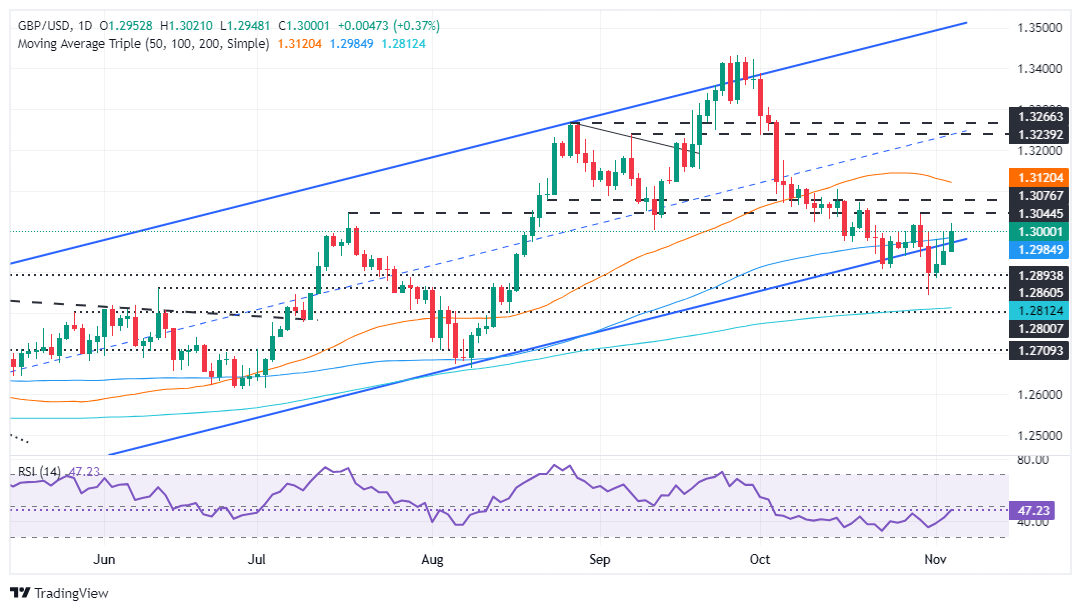
GBP/USD Price Forecast: Technical outlook
After briefly consolidating on Monday, the GBP/USD cleared the 1.3000 figure, though it remains slightly tilted to the downside. Buyers would need to regain October’s 30 swing high of 1.3047 to take control and push the pair toward 1.3100. Once done and those levels are removed, the next resistance would be the 50-day SMA at 1.3118.
On the other hand, sellers would need to drag the GBP/USD below 1.3000 and the 100-day SMA for a bearish resumption. In that outcome, the next support would be the October 24 and 25 low of 1.2908, followed by the October 31 pivot low of 1.2843 ahead of the 200-day SMA at 1.2810.
Oscillators suggest that bulls are gathering steam, with the Relative Strength Index (RSI) aiming up. However, it remains shy of cracking its 50 neutral line. Therefore, caution is warranted.
GBP/USD Price Chart – Daily
British Pound PRICE Today
The table below shows the percentage change of British Pound (GBP) against listed major currencies today. British Pound was the strongest against the Swiss Franc.
| USD | EUR | GBP | JPY | CAD | AUD | NZD | CHF | |
|---|---|---|---|---|---|---|---|---|
| USD | -0.21% | -0.34% | -0.08% | -0.26% | -0.68% | -0.49% | 0.00% | |
| EUR | 0.21% | -0.14% | 0.13% | -0.05% | -0.50% | -0.28% | 0.22% | |
| GBP | 0.34% | 0.14% | 0.24% | 0.07% | -0.36% | -0.15% | 0.36% | |
| JPY | 0.08% | -0.13% | -0.24% | -0.18% | -0.61% | -0.44% | 0.09% | |
| CAD | 0.26% | 0.05% | -0.07% | 0.18% | -0.43% | -0.25% | 0.28% | |
| AUD | 0.68% | 0.50% | 0.36% | 0.61% | 0.43% | 0.19% | 0.71% | |
| NZD | 0.49% | 0.28% | 0.15% | 0.44% | 0.25% | -0.19% | 0.51% | |
| CHF | -0.01% | -0.22% | -0.36% | -0.09% | -0.28% | -0.71% | -0.51% |
The heat map shows percentage changes of major currencies against each other. The base currency is picked from the left column, while the quote currency is picked from the top row. For example, if you pick the British Pound from the left column and move along the horizontal line to the US Dollar, the percentage change displayed in the box will represent GBP (base)/USD (quote).
Recommended Articles


