EUR/GBP Price Analysis: Outlook promising, must hold the 20-day SMA line

Source Fxstreet
  • Technical indicators suggest that buying pressure is rising, supporting the bullish outlook.
  • The pair needs to break above 0.8400 to confirm a bullish continuation.
  • A consolidation above the 20-day SMA would also favor a promising outlook.

The EUR/GBP pair seems to be consolidating in a sideways range after last week’s sharp gains, and rose by 0.35% on Monday to 0.8395.

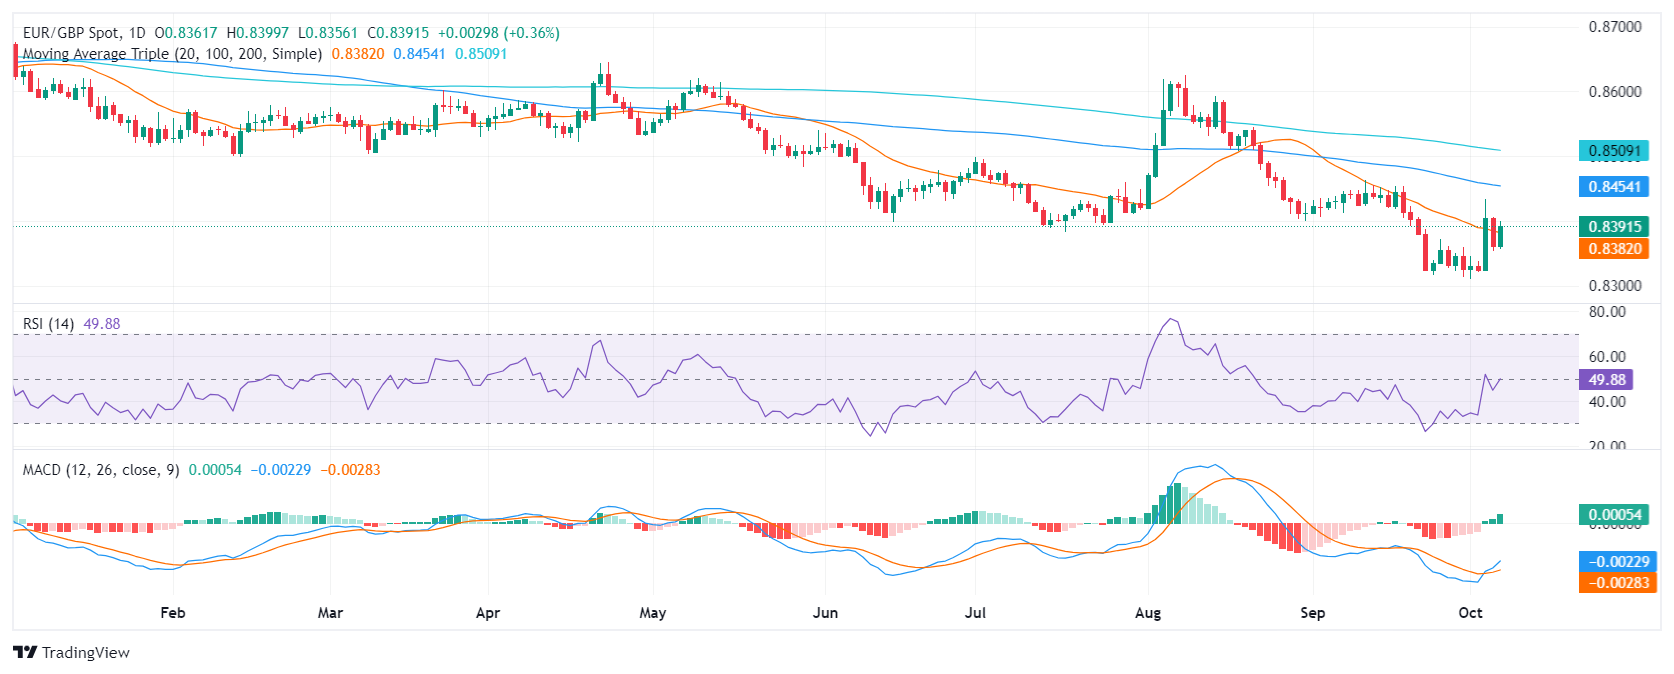
The daily Relative Strength Index (RSI) is currently rising near its middle point suggesting that buying pressure is rising. The Moving Average Convergence Divergence (MACD) is also green and rising, further suggesting that the tide is in favor of the bulls.

A break above the 0.8400 resistance level could trigger a bullish continuation and would open the door for further gains towards 0.8450 and 0.8500. A drop below the 0.8320 support level could lead to further declines. Above the 0.8380 line where the 20-day Simple Moving Average (SMA) converges, serves as a strong support which the bulls must hold to continue rising.

EUR/GBP daily chart

Disclaimer: For information purposes only. Past performance is not indicative of future results.
placeholder
Bitcoin Suffers Year’s Strongest Waterfall-Style Decline. Will It Next Drop to the $60,000 Mark?During the Asian trading session on June 4, Bitcoin continued its multi-day slump, briefly dropping below the $62,000 mark to $61,338. As of press time, Bitcoin was trading at $63,844, wi
Author  TradingKey
10 hours ago
During the Asian trading session on June 4, Bitcoin continued its multi-day slump, briefly dropping below the $62,000 mark to $61,338. As of press time, Bitcoin was trading at $63,844, wi
placeholder
Bitcoin drops below $65K amid reinforced bear market signalsBitcoin (BTC) dipped further below $65,000 on Wednesday, with onchain data from Glassnode signaling a market firmly in a bear phase. The decline has pushed prices back into a key valuation range between the Realized Price and the True Market Mean.
Author  FXStreet
18 hours ago
Bitcoin (BTC) dipped further below $65,000 on Wednesday, with onchain data from Glassnode signaling a market firmly in a bear phase. The decline has pushed prices back into a key valuation range between the Realized Price and the True Market Mean.
placeholder
Forex Today: US Dollar stays resilient ahead of key US dataHere is what you need to know on Wednesday, June 3:
Author  FXStreet
Yesterday 10: 27
Here is what you need to know on Wednesday, June 3:
placeholder
$1.5 Billion in Crypto Assets Liquidated, Bitcoin Falls Below $66,000 Mark. What Is the Reason?On June 2, Eastern Time, the cryptocurrency market suffered its most severe wave of concentrated liquidations so far this year. Bitcoin ( BTC) fell below the $70,000 psychological support
Author  TradingKey
Yesterday 06: 32
On June 2, Eastern Time, the cryptocurrency market suffered its most severe wave of concentrated liquidations so far this year. Bitcoin ( BTC) fell below the $70,000 psychological support
placeholder
WTI rises to near $93.00 as Iran launches missiles toward Kuwait, BahrainWest Texas Intermediate (WTI) gains ground for the third successive day, trading around $92.90 per barrel during the Asian hours on Wednesday.
Author  FXStreet
Yesterday 01: 24
West Texas Intermediate (WTI) gains ground for the third successive day, trading around $92.90 per barrel during the Asian hours on Wednesday.
Related Instrument
goTop
quote