


USD/CHF Price Prediction: Surges in bullish breakout from multi-week range
Source Fxstreet
- USD/CHF breaks out of the range it has been straight-jacketed in for weeks.
- The pair has probably started a new uptrend with odds now favoring the acquisition of bullish targets.
USD/CHF decisively breaks out of the top of its multi-week range, probably ending its protracted sideways market trend. A close clearly above 0.8540 and the range ceiling would cement bullish expectations.
The move means the pair has probably changed its short-term trend from range-bound to bullish, and since it is a fundamental principle of technical analysis that “the trend is your friend” the odds favor a continuation higher.
USD/CHF 4-hour Chart
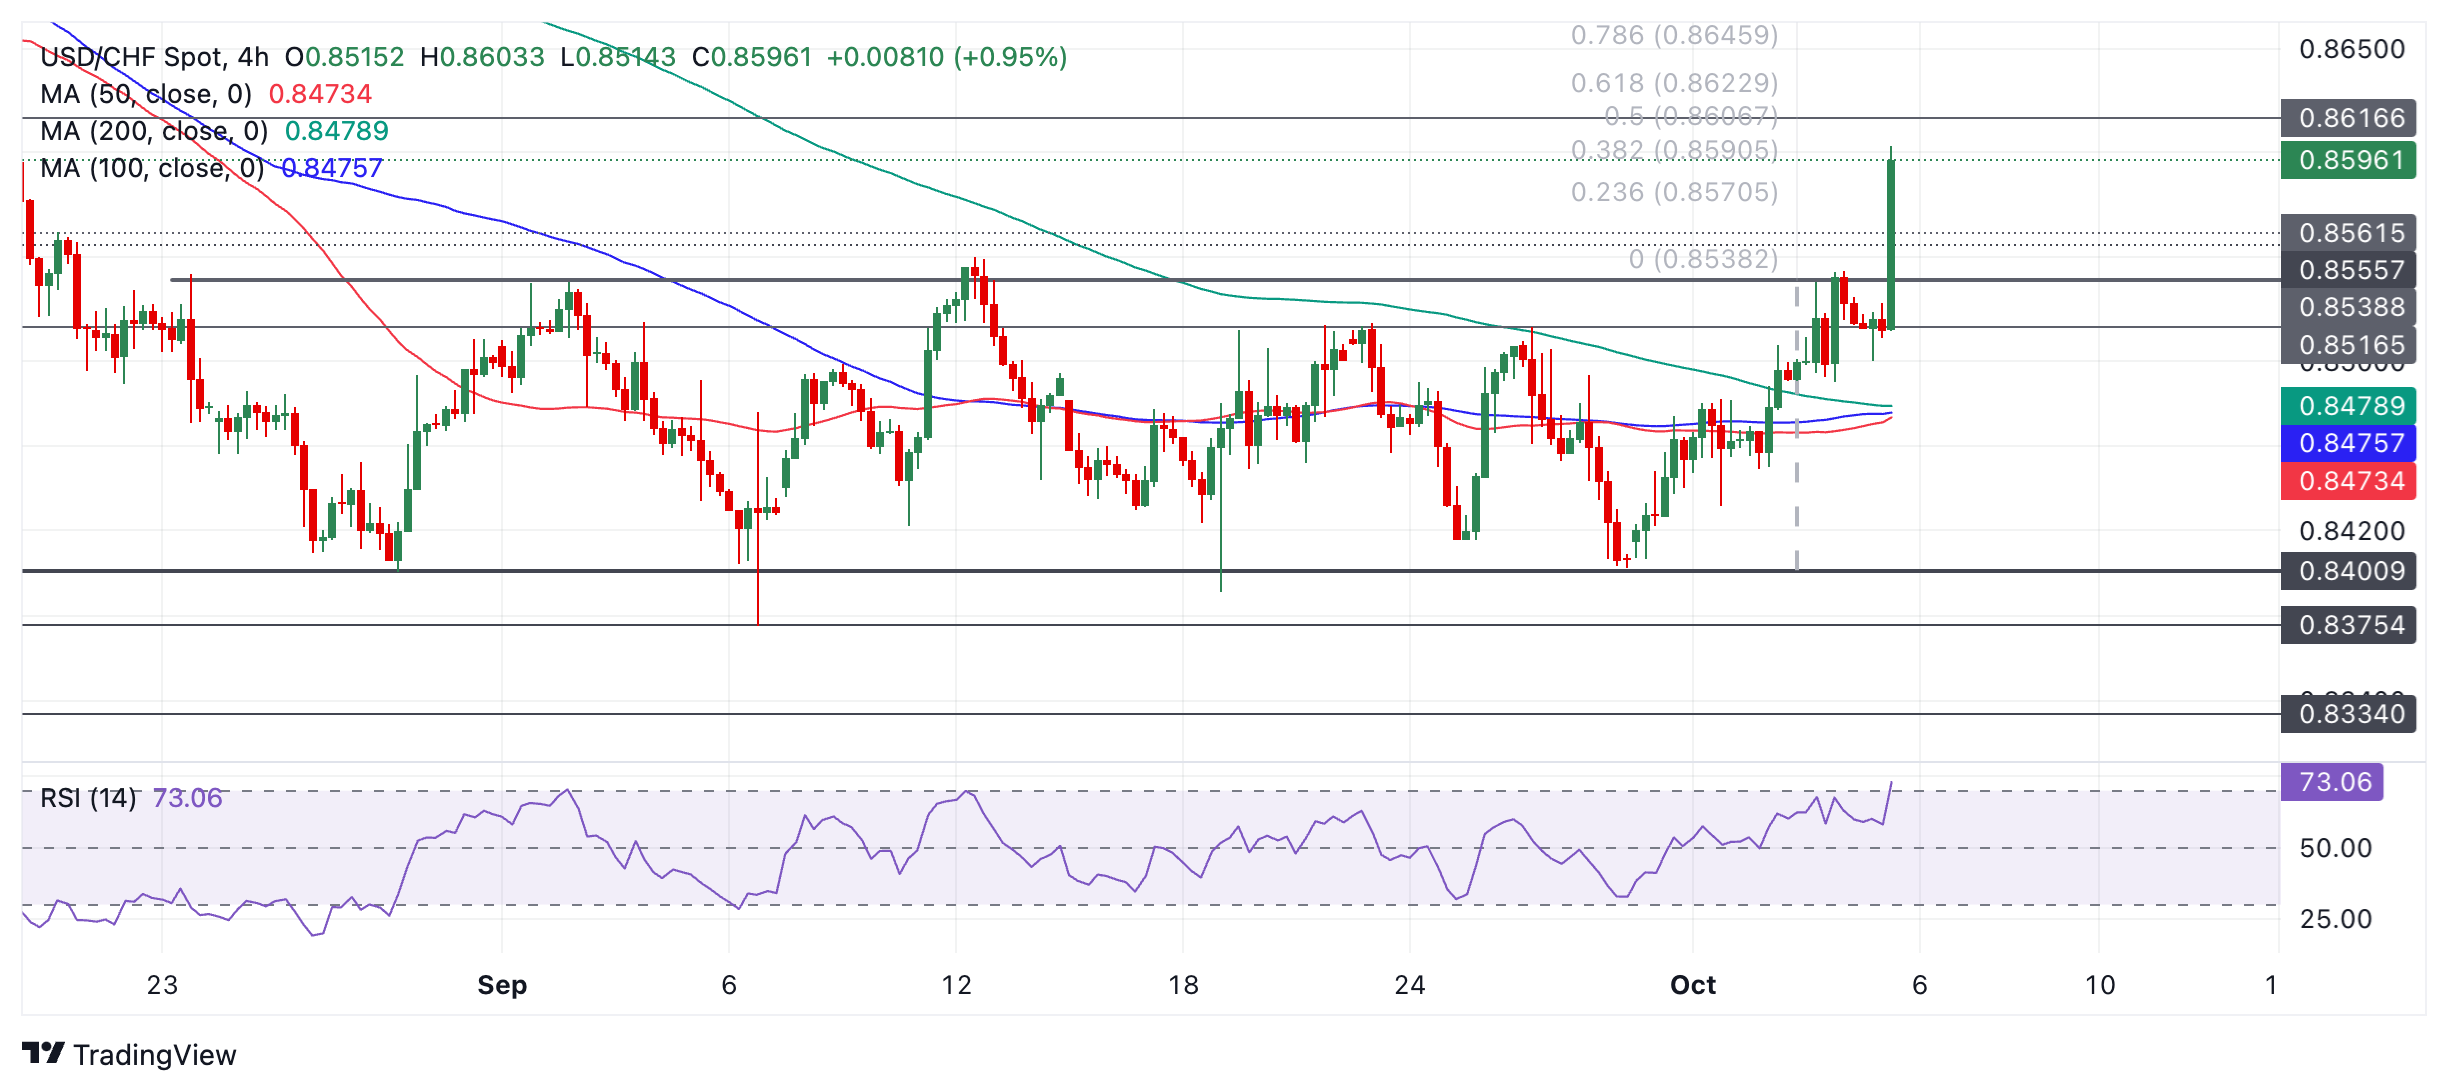
USD/CHF is now likely to reach an upside target at a minimum of 0.8617 (August 14 swing low), or 0.8622 (Fibonacci 61.8% extrapolation of the height of the range higher). A really bullish move could reach 0.8675, the 100% extrapolation of the height of the range.
Disclaimer: For information purposes only. Past performance is not indicative of future results.
Recommended Articles

Dollar presses 102 as the 10-year yield sits at 5.14% — and October hike odds are only 17%The dollar index closed at 101.99 (+0.20%) on Monday after briefly topping 102.07, while the 10-year Treasury yield rose to 5.14% and the 2-year hit 4.774% — yet futures price only about a 17% chance of a hike at the October 27-28 FOMC, versus roughly 90% for December. The driver is a global bond selloff, not a Fed repricing: France's 10-year OAT jumped to 4.84% ~ 4.94% and the OAT-Bund spread widened to 140 ~ 146bp. Here are the levels, the cross-asset read-through and what to watch.
The dollar index closed at 101.99 (+0.20%) on Monday after briefly topping 102.07, while the 10-year Treasury yield rose to 5.14% and the 2-year hit 4.774% — yet futures price only about a 17% chance of a hike at the October 27-28 FOMC, versus roughly 90% for December. The driver is a global bond selloff, not a Fed repricing: France's 10-year OAT jumped to 4.84% ~ 4.94% and the OAT-Bund spread widened to 140 ~ 146bp. Here are the levels, the cross-asset read-through and what to watch.
The Fed will sit still on October 28 — but 100 of 100 economists now expect a December hikeA Reuters poll run October 16-20 found 94 of 100 economists expecting the Fed to hold at 3.75-4.00% on October 28 — and all 100 expecting a hike in December, against less than half a month earlier. The market is close to the same price, with CME FedWatch at roughly 17% for October and 82.8% for December. With the Fed in blackout since October 17, here are the five dates that decide the rest of the year, what each one is priced for, and the two directions each can take.
A Reuters poll run October 16-20 found 94 of 100 economists expecting the Fed to hold at 3.75-4.00% on October 28 — and all 100 expecting a hike in December, against less than half a month earlier. The market is close to the same price, with CME FedWatch at roughly 17% for October and 82.8% for December. With the Fed in blackout since October 17, here are the five dates that decide the rest of the year, what each one is priced for, and the two directions each can take.
Get the latest gold price analysis, forex gold insights, and XAU/USD analysis for October 23, 2026. Read on for the details.
Nasdaq closes at 26,008.86 — 8.9 points above 26,000, and the credit market never blinkedThe Nasdaq Composite fell 2.60% to 26,008.86 on October 22, its worst session since June, as Meta sank 6.98% on 2026 capex guidance of $135–145 billion. But the equal-weight S&P 500 rose 0.73%, high-yield credit was flat and 10-year yields fell 20 basis points. This was an AI de-rating, not a risk-off event — here is the transmission chain, the 29,000 / 28,200 levels and what would prove it wrong.
The Nasdaq Composite fell 2.60% to 26,008.86 on October 22, its worst session since June, as Meta sank 6.98% on 2026 capex guidance of $135–145 billion. But the equal-weight S&P 500 rose 0.73%, high-yield credit was flat and 10-year yields fell 20 basis points. This was an AI de-rating, not a risk-off event — here is the transmission chain, the 29,000 / 28,200 levels and what would prove it wrong.
Brent tops $113 on Saudi supply risk — but the diesel line in the EIA report is the tellBrent's December contract settled at $113.17 on October 22, up 4.00% and the highest close since May 4, after Saudi Arabia restricted refined-product shipments. The same session's EIA report showed crude stocks down 3.06 million barrels and gasoline down 2.95 million — but distillates built 1.68 million. That single line decides whether $113 holds: here are the data, the 108.8 / 114.0 / 119.3 levels and the two scenarios.
Brent's December contract settled at $113.17 on October 22, up 4.00% and the highest close since May 4, after Saudi Arabia restricted refined-product shipments. The same session's EIA report showed crude stocks down 3.06 million barrels and gasoline down 2.95 million — but distillates built 1.68 million. That single line decides whether $113 holds: here are the data, the 108.8 / 114.0 / 119.3 levels and the two scenarios.
Related Instrument


