USD/INR remains stable due to reduced volatility, potential RBI interventions

Source Fxstreet
  • The Indian Rupee may receive support from expected foreign inflows into domestic equities following US Consumer Price Index data.
  • Traders expect RBI interventions to prevent the INR from weakening beyond the 84.00 level.
  • The US inflation report has increased the odds of a 25-basis points rate cut by the Fed in September.

The USD/INR pair moves sideways on Thursday as traders speculate potential market interventions by the Reserve Bank of India (RBI) to prevent the Indian Rupee (INR) from weakening beyond the 84.00 level. Traders await Consumer Price Index and Industrial Output data from India scheduled to be released later in the day.

Additionally, subdued crude Oil prices provide support for the Indian Rupee against the US Dollar (USD). India, the world’s third-largest Oil importer, stands to benefit from lower import costs. Concerns over weakened Oil demand have offset the impact of Hurricane Francine on the United States (US) Oil production, the world's largest crude producer.

The Indian Rupee may receive support from the expected rise in foreign inflows into domestic equities following August’s US Consumer Price Index (CPI) data. This US inflation report has heightened the likelihood that the Federal Reserve (Fed) will begin its easing cycle with a 25-basis points interest rate cut in September.

According to the CME FedWatch Tool, markets are fully anticipating at least a 25 basis point (bps) rate cut by the Federal Reserve at its September meeting. The likelihood of a 50 bps rate cut has sharply decreased to 15.0%, down from 44.0% a week ago.

Daily Digest Market Movers: Indian Rupee consolidates amid thin volatility

  • India is considering relaxing investment rules for Chinese firms to stimulate its manufacturing sector. Additionally, the country has eased visa issuance for Chinese nationals to support local manufacturing. India's trade deficit with China has nearly doubled since 2020, according to a Reuters’ report.
  • The US Consumer Price Index dipped to 2.5% year-on-year in August, from the previous reading of 2.9%. The index has fallen short of the expected 2.6% reading. Meanwhile, headline CPI stood at 0.2% MoM. Core CPI ex Food & Energy, remained unchanged at 3.2% YoY. On a monthly basis, core CPI rose to 0.3% from the previous 0.2% reading.
  • The first US presidential debate between former President Donald Trump and Democratic nominee Kamala Harris in Pennsylvania was won by Harris, according to a CNN poll. The debate began with a critical focus on the economy, inflation, and economic policies.
  • On Tuesday, Reuters reported that six Indian bankers indicated that investors are urging the Indian federal government to increase the issuance of short-term and green bonds and to restart auctions for floating-rate bonds. These recommendations were discussed during a series of meetings about the government’s borrowing strategy for the latter half of the fiscal year.
  • Chicago Fed President Austan Goolsbee remarked on Friday that Fed officials are starting to align with the broader market's sentiment that a policy rate adjustment by the US central bank is imminent, according to CNBC. FXStreet’s FedTracker, which uses a custom AI model to evaluate Fed officials' speeches on a dovish-to-hawkish scale from 0 to 10, rated Goolsbee's comments as dovish, assigning them a score of 3.2.
  • India's FX Reserves reached a record high of $683.99 billion as of August 30, up from $681.69 billion previously. This surge is largely due to a substantial influx of foreign exchange into the Indian economy, spurred by robust economic growth and the long-anticipated inclusion of Indian assets in JPMorgan's major emerging market debt index, which has enhanced foreign investment.

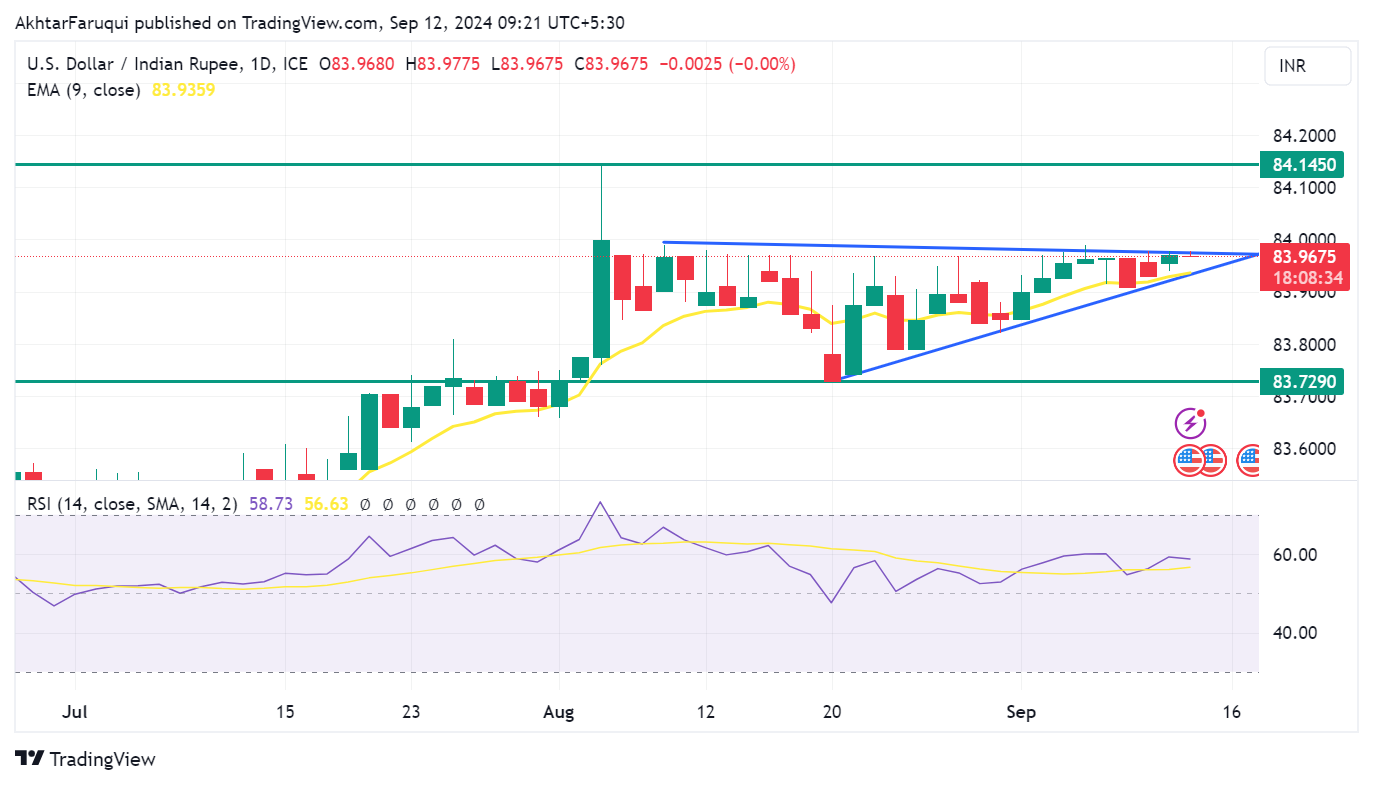
Technical Analysis: USD/INR remains below 84.00, tests upper boundary of the symmetrical triangle

The Indian Rupee remains slightly below 84.00 on Thursday. Analysis of the daily chart shows that the USD/INR pair is consolidating within a symmetrical triangle pattern, indicating reduced volatility and a phase of consolidation. However, the 14-day Relative Strength Index (RSI) remains above 50, suggesting that the bullish trend is still in play.

On the downside, the nine-day Exponential Moving Average (EMA) at 83.93 could serve as immediate support, aligning with the lower boundary of the symmetrical triangle near 83.90. A drop below this level might indicate a bearish shift, potentially applying downward pressure on the USD/INR pair and driving it toward its six-week low around 83.72.

On the resistance side, the USD/INR pair is consolidating, along with the upper boundary of the symmetrical triangle near the 84.00 level. A breakout above this point could propel the pair toward the all-time high of 84.14, recorded on August 5.

USD/INR: Daily Chart

Indian economy FAQs

The Indian economy has averaged a growth rate of 6.13% between 2006 and 2023, which makes it one of the fastest growing in the world. India’s high growth has attracted a lot of foreign investment. This includes Foreign Direct Investment (FDI) into physical projects and Foreign Indirect Investment (FII) by foreign funds into Indian financial markets. The greater the level of investment, the higher the demand for the Rupee (INR). Fluctuations in Dollar-demand from Indian importers also impact INR.

India has to import a great deal of its Oil and gasoline so the price of Oil can have a direct impact on the Rupee. Oil is mostly traded in US Dollars (USD) on international markets so if the price of Oil rises, aggregate demand for USD increases and Indian importers have to sell more Rupees to meet that demand, which is depreciative for the Rupee.

Inflation has a complex effect on the Rupee. Ultimately it indicates an increase in money supply which reduces the Rupee’s overall value. Yet if it rises above the Reserve Bank of India’s (RBI) 4% target, the RBI will raise interest rates to bring it down by reducing credit. Higher interest rates, especially real rates (the difference between interest rates and inflation) strengthen the Rupee. They make India a more profitable place for international investors to park their money. A fall in inflation can be supportive of the Rupee. At the same time lower interest rates can have a depreciatory effect on the Rupee.

India has run a trade deficit for most of its recent history, indicating its imports outweigh its exports. Since the majority of international trade takes place in US Dollars, there are times – due to seasonal demand or order glut – where the high volume of imports leads to significant US Dollar- demand. During these periods the Rupee can weaken as it is heavily sold to meet the demand for Dollars. When markets experience increased volatility, the demand for US Dollars can also shoot up with a similarly negative effect on the Rupee.

Disclaimer: For information purposes only. Past performance is not indicative of future results.
placeholder
Gold Price Forecast: XAU/USD drifts higher above $4,200 as Fed delivers expected cutGold price (XAU/USD) gains momentum to around $4,235 during the early Asian session on Thursday. The precious metal extends its upside after the US Federal Reserve (Fed) delivered an expected third consecutive interest rate cut and maintained its outlook for just one cut in 2026.
Author  FXStreet
Dec 11, Thu
Gold price (XAU/USD) gains momentum to around $4,235 during the early Asian session on Thursday. The precious metal extends its upside after the US Federal Reserve (Fed) delivered an expected third consecutive interest rate cut and maintained its outlook for just one cut in 2026.
placeholder
Gold remains bid as lack of Fed clarity and geopolitical frictions persistGold (XAU/USD) advances modestly on Friday as traders seem to book profits ahead of the weekend, yet clings to gains of over 0.51% after reaching a seven-week high of $4,353. At the time of writing, XAU/USD trades at $4,302 as traders digest comments from Federal Reserve (Fed) officials.
Author  FXStreet
Yesterday 01: 34
Gold (XAU/USD) advances modestly on Friday as traders seem to book profits ahead of the weekend, yet clings to gains of over 0.51% after reaching a seven-week high of $4,353. At the time of writing, XAU/USD trades at $4,302 as traders digest comments from Federal Reserve (Fed) officials.
placeholder
Ethereum Price Slips Lower — $3,000 Looms as the Key BattlegroundEthereum is attempting to recover from a $3,026 low but remains below $3,200 and the 100-hour SMA, with a bearish trend line near $3,175 capping rebounds as bulls need a clean break above $3,200 to target $3,250–$3,400, while a drop below $3,050 risks a retest of $3,000 and $2,940.
Author  Mitrade
Yesterday 03: 25
Ethereum is attempting to recover from a $3,026 low but remains below $3,200 and the 100-hour SMA, with a bearish trend line near $3,175 capping rebounds as bulls need a clean break above $3,200 to target $3,250–$3,400, while a drop below $3,050 risks a retest of $3,000 and $2,940.
placeholder
Macro Analysts: Hawkish Japan Could Push Bitcoin Below $70KAnalysts predict Bitcoin may face further declines towards the $70,000 mark if the Bank of Japan raises interest rates as expected.
Author  Mitrade
Yesterday 05: 48
Analysts predict Bitcoin may face further declines towards the $70,000 mark if the Bank of Japan raises interest rates as expected.
placeholder
Bitcoin Slides 5% as Sellers Lean In — Can BTC Reclaim $88,000?Bitcoin has dropped back below $88,000 after rolling over from $90,500, with price still trading under the 100-hour Simple Moving Average. The sell-off found a floor at $85,151, and BTC is now consolidating near that base, but rebounds are facing pressure from a bearish trend line around $89,000. Bulls need to retake $88,000–$89,000 to ease downside risk; failure to do so keeps $85,500–$85,000 and then $83,500 in play, with $80,000 as the deeper “line in the sand.” Bitcoin (BTC) is back in damage-control mode after a sharp pullback wiped out recent gains. The price failed to reclaim the $90,000–$90,500 band, rolled over, and slid through $88,500 before briefly dipping under $87,000. Buyers did show up around $85,000, but the rebound so far looks more like stabilization than a clear trend reversal. Bitcoin dips hard, finds a bid near $85,000(h3) BTC’s latest move lower began when it couldn’t build follow-through above $90,000 and $90,500. Once that upside stalled, sellers took control and pushed price down through $88,500. The slide accelerated enough to spike below $87,000, but the market didn’t free-fall. Bulls defended the $85,000 zone, printing a low at $85,151. Since then, Bitcoin has been consolidating below the 23.6% Fibonacci retracement of the drop from the $93,560 swing high to the $85,151 low — a clue that the bounce is still shallow and that sellers haven’t fully backed off yet. Structurally, BTC is still on the back foot: It’s trading below $88,000, and It remains below the 100-hour Simple Moving Average, keeping short-term trend pressure pointed downward. Resistance is layered, and $89,000 is the problem area(h3) If bulls try to turn this into a recovery, they’ll have to climb through multiple ceilings in quick succession. First, BTC faces resistance around $87,150, followed by a more meaningful barrier near $87,500. From there, the market’s attention snaps back to $88,000 — the level BTC just lost and now needs to reclaim. A close back above $88,000 would improve the tone, but it doesn’t solve the bigger issue: there’s a bearish trend line on the hourly BTC/USD chart (Kraken feed) with resistance near $89,000, which also lines up with the next technical hurdle. If BTC can push through $89,000 and hold, the rebound could extend toward $90,000, with follow-through targets at $91,000 and $91,500. But until price clears that $88,000–$89,000 zone, rallies are at risk of being sold rather than chased. If BTC fails to reclaim resistance, the downside path is clear(h3) The near-term bear case is simple: if Bitcoin can’t climb back above the $87,000 area and keep traction, sellers may attempt another leg lower. Support levels line up like this: Immediate support: $85,500 First major support: $85,000 Next support: $83,500 Then $82,500 in the near term Below that, the major “don’t break this” level is still $80,000. If BTC slips under $80,000, the risk of acceleration to the downside increases significantly — not because it’s magic, but because it’s the kind of psychological and structural level that tends to trigger forced de-risking. Indicators: momentum still leans bearish(h3) The intraday indicators aren’t offering much comfort yet: Hourly MACD is losing pace in the bearish zone. Hourly RSI remains below 50, suggesting sellers still have the upper hand on short timeframes. So while the $85,000 defense held for now, the market hasn’t flipped bullish — it’s just stopped bleeding.
Author  Mitrade
4 hours ago
Bitcoin has dropped back below $88,000 after rolling over from $90,500, with price still trading under the 100-hour Simple Moving Average. The sell-off found a floor at $85,151, and BTC is now consolidating near that base, but rebounds are facing pressure from a bearish trend line around $89,000. Bulls need to retake $88,000–$89,000 to ease downside risk; failure to do so keeps $85,500–$85,000 and then $83,500 in play, with $80,000 as the deeper “line in the sand.” Bitcoin (BTC) is back in damage-control mode after a sharp pullback wiped out recent gains. The price failed to reclaim the $90,000–$90,500 band, rolled over, and slid through $88,500 before briefly dipping under $87,000. Buyers did show up around $85,000, but the rebound so far looks more like stabilization than a clear trend reversal. Bitcoin dips hard, finds a bid near $85,000(h3) BTC’s latest move lower began when it couldn’t build follow-through above $90,000 and $90,500. Once that upside stalled, sellers took control and pushed price down through $88,500. The slide accelerated enough to spike below $87,000, but the market didn’t free-fall. Bulls defended the $85,000 zone, printing a low at $85,151. Since then, Bitcoin has been consolidating below the 23.6% Fibonacci retracement of the drop from the $93,560 swing high to the $85,151 low — a clue that the bounce is still shallow and that sellers haven’t fully backed off yet. Structurally, BTC is still on the back foot: It’s trading below $88,000, and It remains below the 100-hour Simple Moving Average, keeping short-term trend pressure pointed downward. Resistance is layered, and $89,000 is the problem area(h3) If bulls try to turn this into a recovery, they’ll have to climb through multiple ceilings in quick succession. First, BTC faces resistance around $87,150, followed by a more meaningful barrier near $87,500. From there, the market’s attention snaps back to $88,000 — the level BTC just lost and now needs to reclaim. A close back above $88,000 would improve the tone, but it doesn’t solve the bigger issue: there’s a bearish trend line on the hourly BTC/USD chart (Kraken feed) with resistance near $89,000, which also lines up with the next technical hurdle. If BTC can push through $89,000 and hold, the rebound could extend toward $90,000, with follow-through targets at $91,000 and $91,500. But until price clears that $88,000–$89,000 zone, rallies are at risk of being sold rather than chased. If BTC fails to reclaim resistance, the downside path is clear(h3) The near-term bear case is simple: if Bitcoin can’t climb back above the $87,000 area and keep traction, sellers may attempt another leg lower. Support levels line up like this: Immediate support: $85,500 First major support: $85,000 Next support: $83,500 Then $82,500 in the near term Below that, the major “don’t break this” level is still $80,000. If BTC slips under $80,000, the risk of acceleration to the downside increases significantly — not because it’s magic, but because it’s the kind of psychological and structural level that tends to trigger forced de-risking. Indicators: momentum still leans bearish(h3) The intraday indicators aren’t offering much comfort yet: Hourly MACD is losing pace in the bearish zone. Hourly RSI remains below 50, suggesting sellers still have the upper hand on short timeframes. So while the $85,000 defense held for now, the market hasn’t flipped bullish — it’s just stopped bleeding.
goTop
quote