


USD/JPY Price Forecast: Bulls fail to break the 200-day SMA around 158.50
- USD/JPY pulls back below 158.30 after rejection at the 200-day SMA, at 158.56
- Softer-than-expected Japanese producer prices are keeping the JPY from appreciating further.
- The US Dollar treads water with investors awaiting key US inflation reports due later this week.
The US Dollar (USD) edges lower against the Japanese Yen (JPY) on Tuesday, although it maintains its broader bullish trend intact, favoured by a risk-averse market. USD/JPY bulls found resistance at the 200-day SMA, in the 158.50 area, again on Monday, and the pair pulled back during Tuesday's early trading to reach session lows sub-158.30.
Data from Japan released earlier on Tuesday showed an unexpected slowdown in factory inflation, as September's Producer Prices Index (PPI) contracted 0.3% for the second consecutive month against market expectations of a 0.5% increase. Year.-over-Year, Japan’s PPI rose at a 6.9% pace, also against expectations of a steady 7.6% rate, but still at levels pressuring the Bank of Japan (BoJ) to tighten its monetary policy further.
Later on, BoJ Governor Kazuho Ueda observed that underlying inflation is nearing 2% and reaffirmed the bank's commitment to keep it anchored at those levels, which leaves the door open to further interest rate hikes. The Yen, however, hardly moved on Ueda’s comments.
The US Dollar, on the other hand, has been trading on a moderately softer tone during the Asian session, with US markets returning after a partial close on Monday. Investors, however, are likely to look from the sidelines on Tuesday, awaiting US Consumer Price Index (CPI) and Producer Price Index (PPI) figures later in the week for further hints about the timing of the Federal Reserve’s (Fed) next rate hike.
Technical Analysis: The USD needs additional impulse to break the 200-day SMA
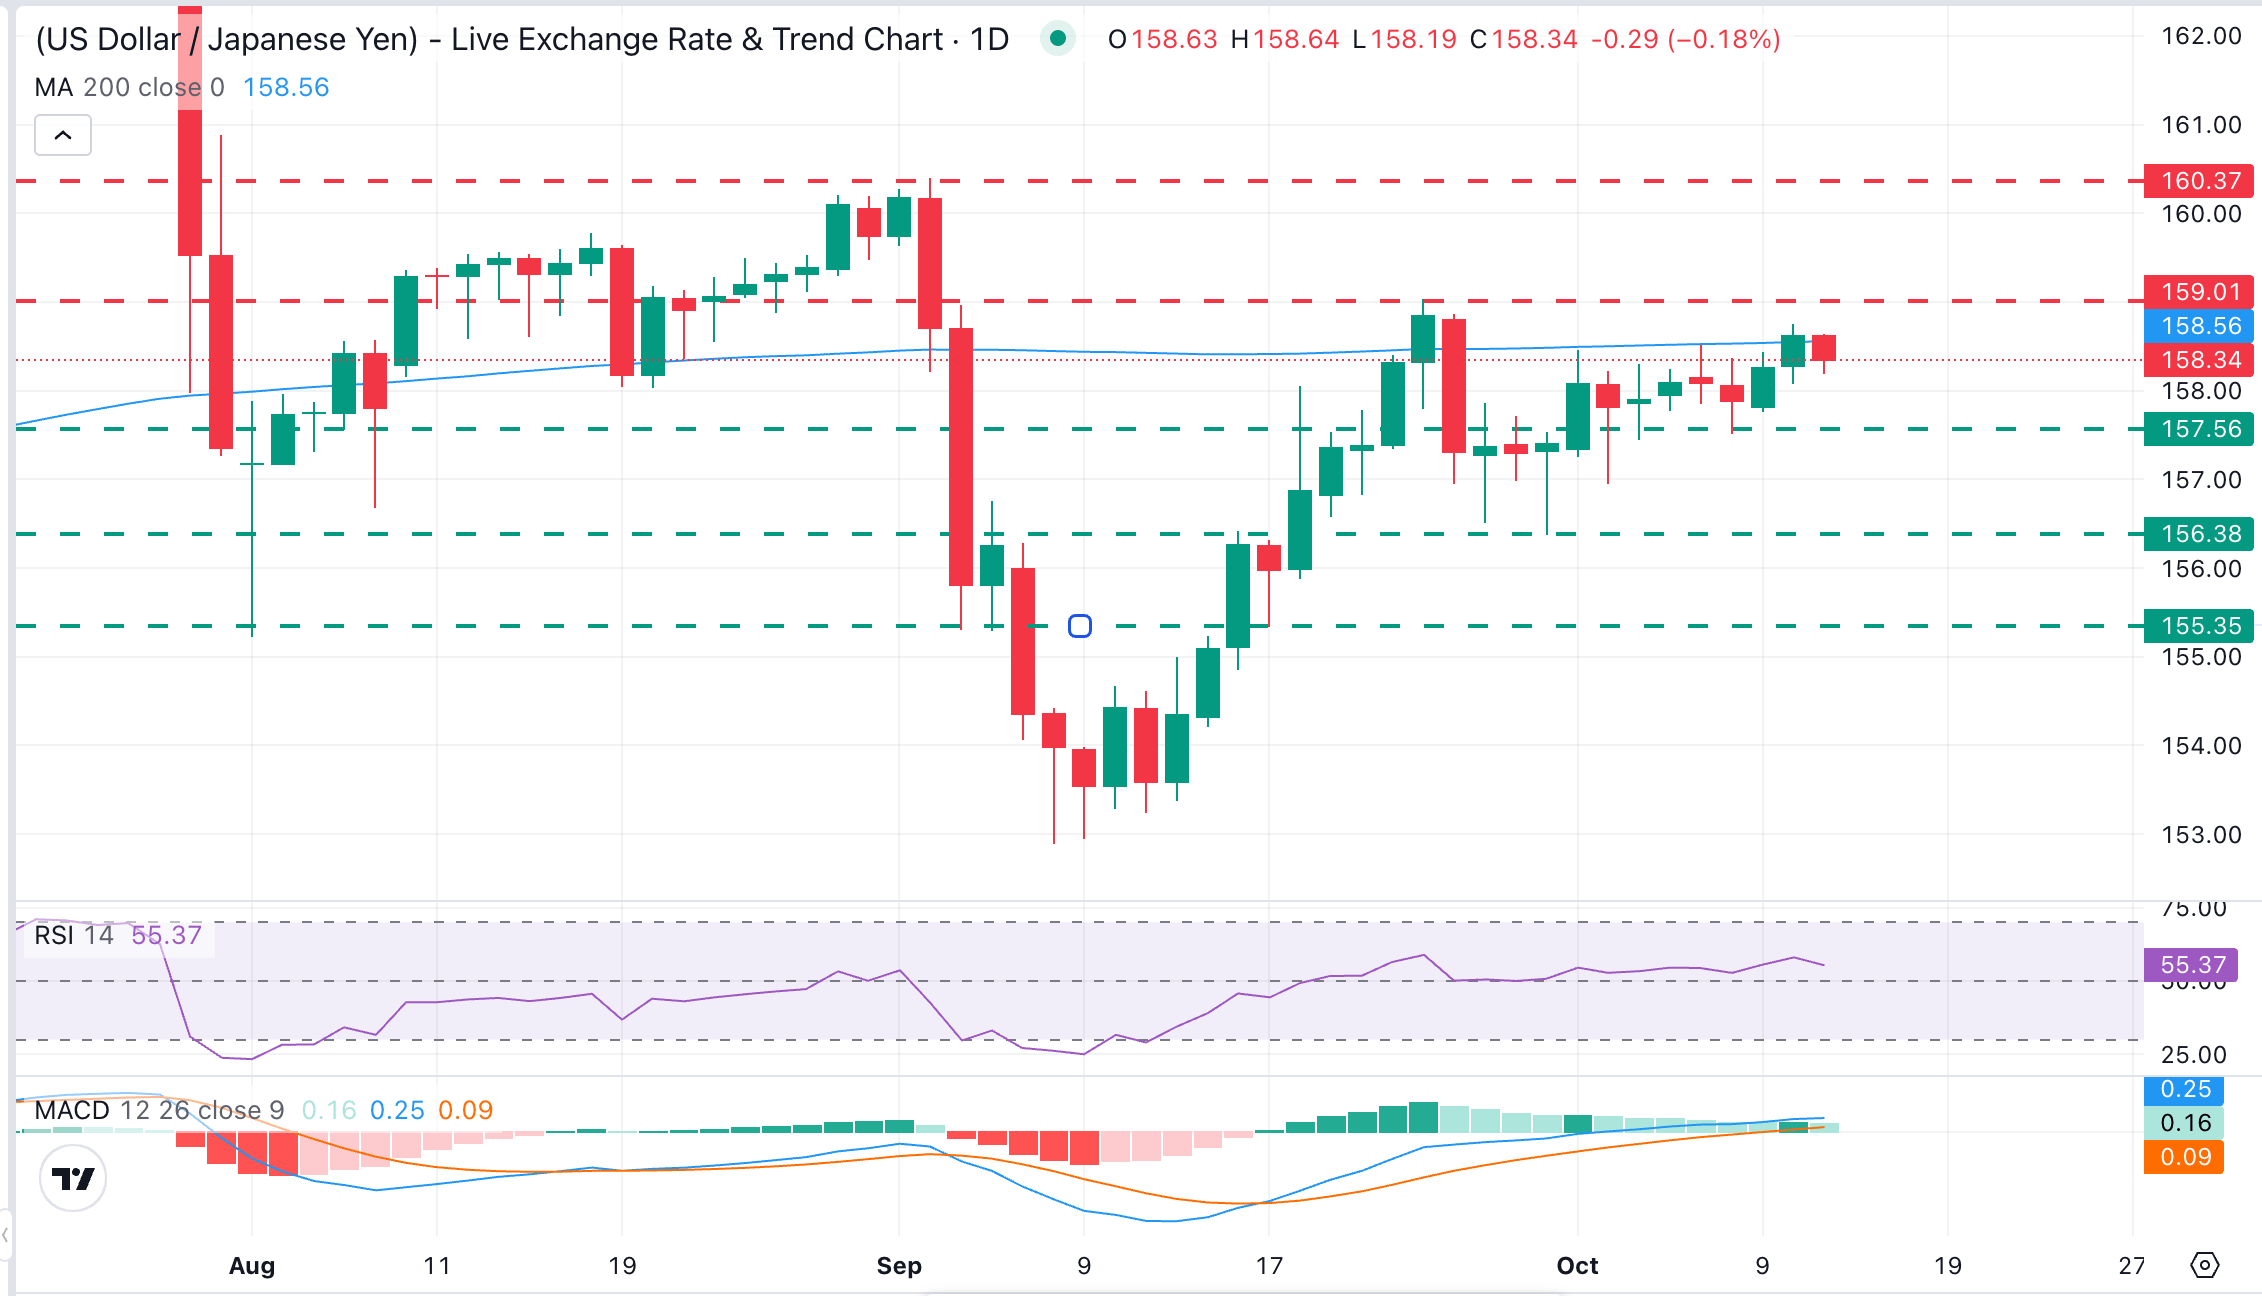
USD/JPY trades at 158.30, keeping the broader constructive tone intact so far, yet with rallies capped below the 200-day simple moving average (SMA) at 158.56. The Relative Strength Index (RSI) in the daily chart lies around 55, and the Moving Average Convergence Divergence (MACD) is slightly positive, but the pair seems to need fresh motivation to break the range top.
Immediate resistance is seen at the mentioned SMA at 158.56, which closes the path towards the September 24 high around 159.00 and the key 160.00 area. On the downside, the October 6 and 8 lows at the 157.50 area are likely to test bears ahead of the late September lows at 156.38 and the September 17 low at 155.34.
(The technical analysis of this story was written with the help of an AI tool. Know more.)
Japanese Yen Price Today
The table below shows the percentage change of Japanese Yen (JPY) against listed major currencies today. Japanese Yen was the strongest against the US Dollar.
| USD | EUR | GBP | JPY | CAD | AUD | NZD | CHF | |
|---|---|---|---|---|---|---|---|---|
| USD | -0.16% | -0.09% | -0.19% | -0.08% | -0.02% | -0.11% | -0.20% | |
| EUR | 0.16% | 0.06% | -0.04% | 0.11% | 0.12% | 0.06% | -0.04% | |
| GBP | 0.09% | -0.06% | -0.13% | -0.02% | 0.04% | -0.02% | -0.10% | |
| JPY | 0.19% | 0.04% | 0.13% | 0.12% | 0.19% | 0.09% | 0.02% | |
| CAD | 0.08% | -0.11% | 0.02% | -0.12% | 0.06% | -0.03% | -0.11% | |
| AUD | 0.02% | -0.12% | -0.04% | -0.19% | -0.06% | -0.09% | -0.18% | |
| NZD | 0.11% | -0.06% | 0.02% | -0.09% | 0.03% | 0.09% | -0.07% | |
| CHF | 0.20% | 0.04% | 0.10% | -0.02% | 0.11% | 0.18% | 0.07% |
The heat map shows percentage changes of major currencies against each other. The base currency is picked from the left column, while the quote currency is picked from the top row. For example, if you pick the Japanese Yen from the left column and move along the horizontal line to the US Dollar, the percentage change displayed in the box will represent JPY (base)/USD (quote).
Recommended Articles


