


GBP/JPY Price Forecast: 200-day SMA holds as downside risks linger
- GBP/JPY steadies as the Japanese Yen gives back part of its intervention-driven gains.
- Japan’s planned tax cuts and household handouts raise doubts about durable support for the Yen.
- The pair remains supported by the 200-day SMA despite a bearish near-term technical bias.
GBP/JPY trades in a narrow range on Thursday, with the British Pound (GBP) modestly outperforming the Japanese Yen (JPY). The Yen stays on the back foot for a third consecutive day, reversing part of the intervention-driven rally that briefly sent GBP/JPY below 210.00 at the start of the week.
At the time of writing, GBP/JPY changes hands near 212.53, finding support at the 200-day Simple Moving Average (SMA).
Yen support questioned as Japan turns to tax cuts and handouts
Rabobank’s Bas van Geffen notes that only days after the Japanese Ministry of Finance and the US Treasury intervened in FX markets to prop up the Yen, “the cabinet approved a plan to cut the sales tax on food for two years.” He adds that, “on top of that, the government is planning handouts to lower-income households.”
Rabobank highlights that “the tax cut costs JPY 4 trillion (around 0.6% of GDP) in lost revenues annually, and the government did not specify how it would fund this shortfall.” The prime minister has tried to reassure investors that the measures are temporary, while Finance Minister Katayama has “pledged to refrain from financing this tax cut through Japan’s deficit.”
Crucially for JPY, Rabobank argues that “these tax cuts do not lead to investments that could structurally improve Japan’s economic growth – which could have lent JPY some of the necessary support.” They add that, “paradoxically, the cost of effective growth-enhancing policies would probably eclipse the budgetary implications of Takaichi’s food tax cuts,” leaving the Yen without the kind of durable, growth-based backing that markets are looking for.
Technical analysis
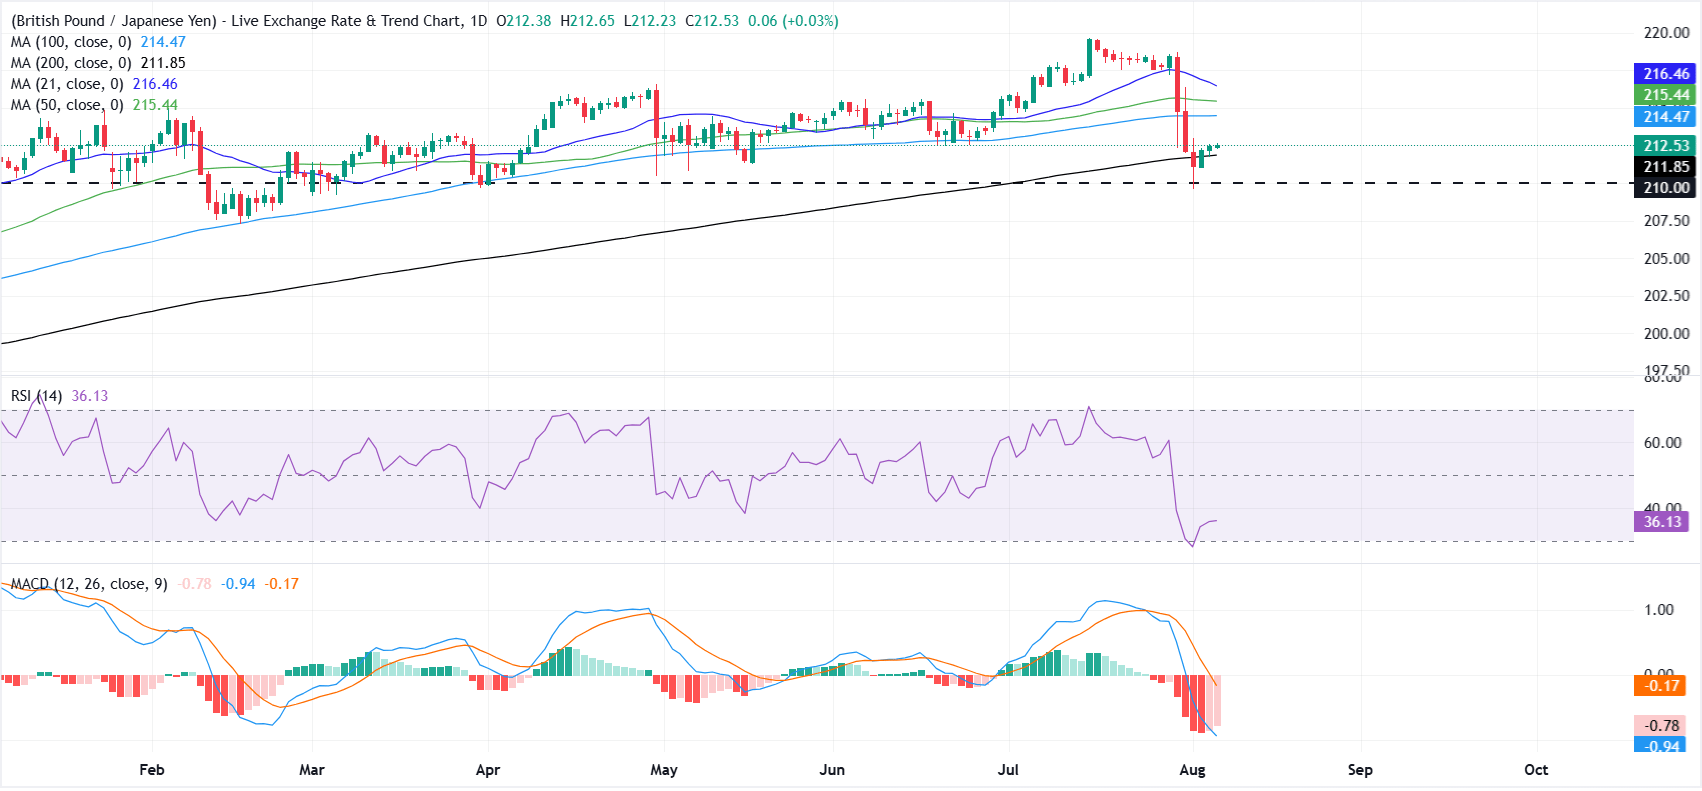
On the daily chart, GBP/JPY holds below the 100-day, 50-day and 21-day Simple Moving Averages (SMAs), which keeps the near-term bias bearish and the pair structurally capped.
The pair is still anchored above the longer-term 200-day SMA at 211.85, but the slide away from recent highs, together with a subdued Relative Strength Index (RSI) around 36 and a negative Moving Average Convergence Divergence (MACD) line below zero, indicate that downside momentum remains dominant.
On the topside, immediate resistance is seen at the 100-day SMA at 214.47, followed by the 50-day SMA at 215.44 and then the 21-day SMA near 216.47, which together define a dense cap on recovery rallies.
On the downside, initial support emerges at the 200-day SMA at 211.85, ahead of the horizontal floor around 210.00. A daily close below these levels would open the way for a deeper corrective phase, while holding above them would keep GBP/JPY in a broader consolidation despite the current bearish bias.
(The technical analysis of this story was written with the help of an AI tool. Know more.)
Japanese Yen Price Today
The table below shows the percentage change of Japanese Yen (JPY) against listed major currencies today. Japanese Yen was the strongest against the Swiss Franc.
| USD | EUR | GBP | JPY | CAD | AUD | NZD | CHF | |
|---|---|---|---|---|---|---|---|---|
| USD | 0.12% | 0.04% | 0.08% | -0.08% | 0.25% | 0.06% | 0.33% | |
| EUR | -0.12% | -0.08% | -0.02% | -0.20% | 0.10% | -0.03% | 0.21% | |
| GBP | -0.04% | 0.08% | 0.04% | -0.12% | 0.19% | 0.03% | 0.30% | |
| JPY | -0.08% | 0.02% | -0.04% | -0.15% | 0.16% | 0.01% | 0.28% | |
| CAD | 0.08% | 0.20% | 0.12% | 0.15% | 0.31% | 0.17% | 0.43% | |
| AUD | -0.25% | -0.10% | -0.19% | -0.16% | -0.31% | -0.14% | 0.10% | |
| NZD | -0.06% | 0.03% | -0.03% | -0.01% | -0.17% | 0.14% | 0.29% | |
| CHF | -0.33% | -0.21% | -0.30% | -0.28% | -0.43% | -0.10% | -0.29% |
The heat map shows percentage changes of major currencies against each other. The base currency is picked from the left column, while the quote currency is picked from the top row. For example, if you pick the Japanese Yen from the left column and move along the horizontal line to the US Dollar, the percentage change displayed in the box will represent JPY (base)/USD (quote).
Recommended Articles


