

USD/JPY Price Analysis: Creeps higher as buyers target 157.00
Source Fxstreet
- USD/JPY rises, trading at 156.86, nearing the key psychological resistance at 157.00.
- U.S. economic data showing rapid business growth since 2022 bolsters the pair.
- Technical analysis: Resistance at 157.00, 158.44 (April 26 high), and YTD high of 160.32.
- Supports identified at Tenkan-Sen (156.05), Senkou Span A (155.61), and Kijun-Sen (155.18).
The USD/JPY registered gains for the second consecutive trading day but were marginal. The pair trades at 156.86, up by 0.03%, as economic indicators in the United States showed that business activity remains resilient, growing at the fastest pace since 2022.
USD/JPY Price Analysis: Technical outlook
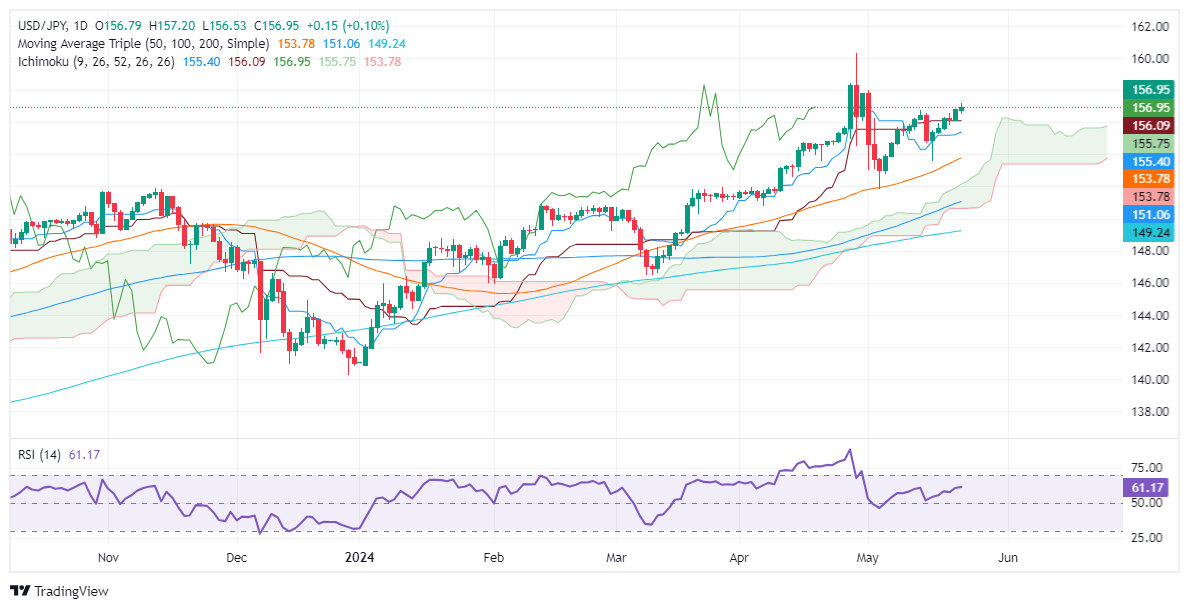
The USD/JPY uptrend is persisting, but it is encountering strong resistance at the psychological 157.00 after clearing the May 14 high of 156.76. If buyers manage to surpass 157.00. that could lead to further gains. The next resistance emerges at 158.44, the April 26 high, and eventually challenges the year-to-date (YTD) high of 160.32.
On the downside, if the pair falls below the Tenkan-Sen at 156.05, it will expose the Senkou Span A at 155.61, followed by the Kijun-Sen at 155.18.
USD/JPY Price Action – Daily Chart
Disclaimer: For information purposes only. Past performance is not indicative of future results.
Recommended Articles

Bitcoin fell sharply last week, testing the short-term defense line at $62,000, with the outcome of US-Iran negotiations becoming a key factor.On August 3, Bitcoin ( BTC) extended its rec
International oil prices plunged during Asian trading hours on Monday. US President Donald Trump announced a suspension of a new round of military action against Iran and plans to restart
US President Donald Trump says Iran talks to begin Monday after canceling attackUS President Donald Trump said that fresh round of Iran talks would begin Monday after he cancelled a planned attack on Iran partially in response to pleas from US allies in the Middle East, including Saudi Arabia, Bloomberg reported on Monday.
US President Donald Trump said that fresh round of Iran talks would begin Monday after he cancelled a planned attack on Iran partially in response to pleas from US allies in the Middle East, including Saudi Arabia, Bloomberg reported on Monday.
As Microsoft ( MSFT) and Google ( GOOGL) sequentially delivered stellar cloud computing report cards, Amazon ( AMZN) also proved with an earnings report that far exceeded expectations tha
WTI holds losses around $82.50 on renewed US-Iran diplomatic hopesWest Texas Intermediate (WTI) oil price remains in the negative territory for the second successive day, trading around $82.60 per barrel during the Asian hours on Friday. Crude oil prices have lost ground following renewed hopes for a diplomatic solution to the US-Iran conflict.
West Texas Intermediate (WTI) oil price remains in the negative territory for the second successive day, trading around $82.60 per barrel during the Asian hours on Friday. Crude oil prices have lost ground following renewed hopes for a diplomatic solution to the US-Iran conflict.
Related Instrument


