
AUD/USD Price Analysis: Uptrend probably resuming
- AUD/USD is probably resuming its short-term uptrend after completing a correction.
- A break above 0.6624 would help confirm the bullish case.
- AUD/USD may have formed a Measured Move with a final target at around 0.6690.
AUD/USD is trading in the 0.6590s on Thursday after finding support from the 50 Simple Moving Average (SMA) and mounting a recovery.
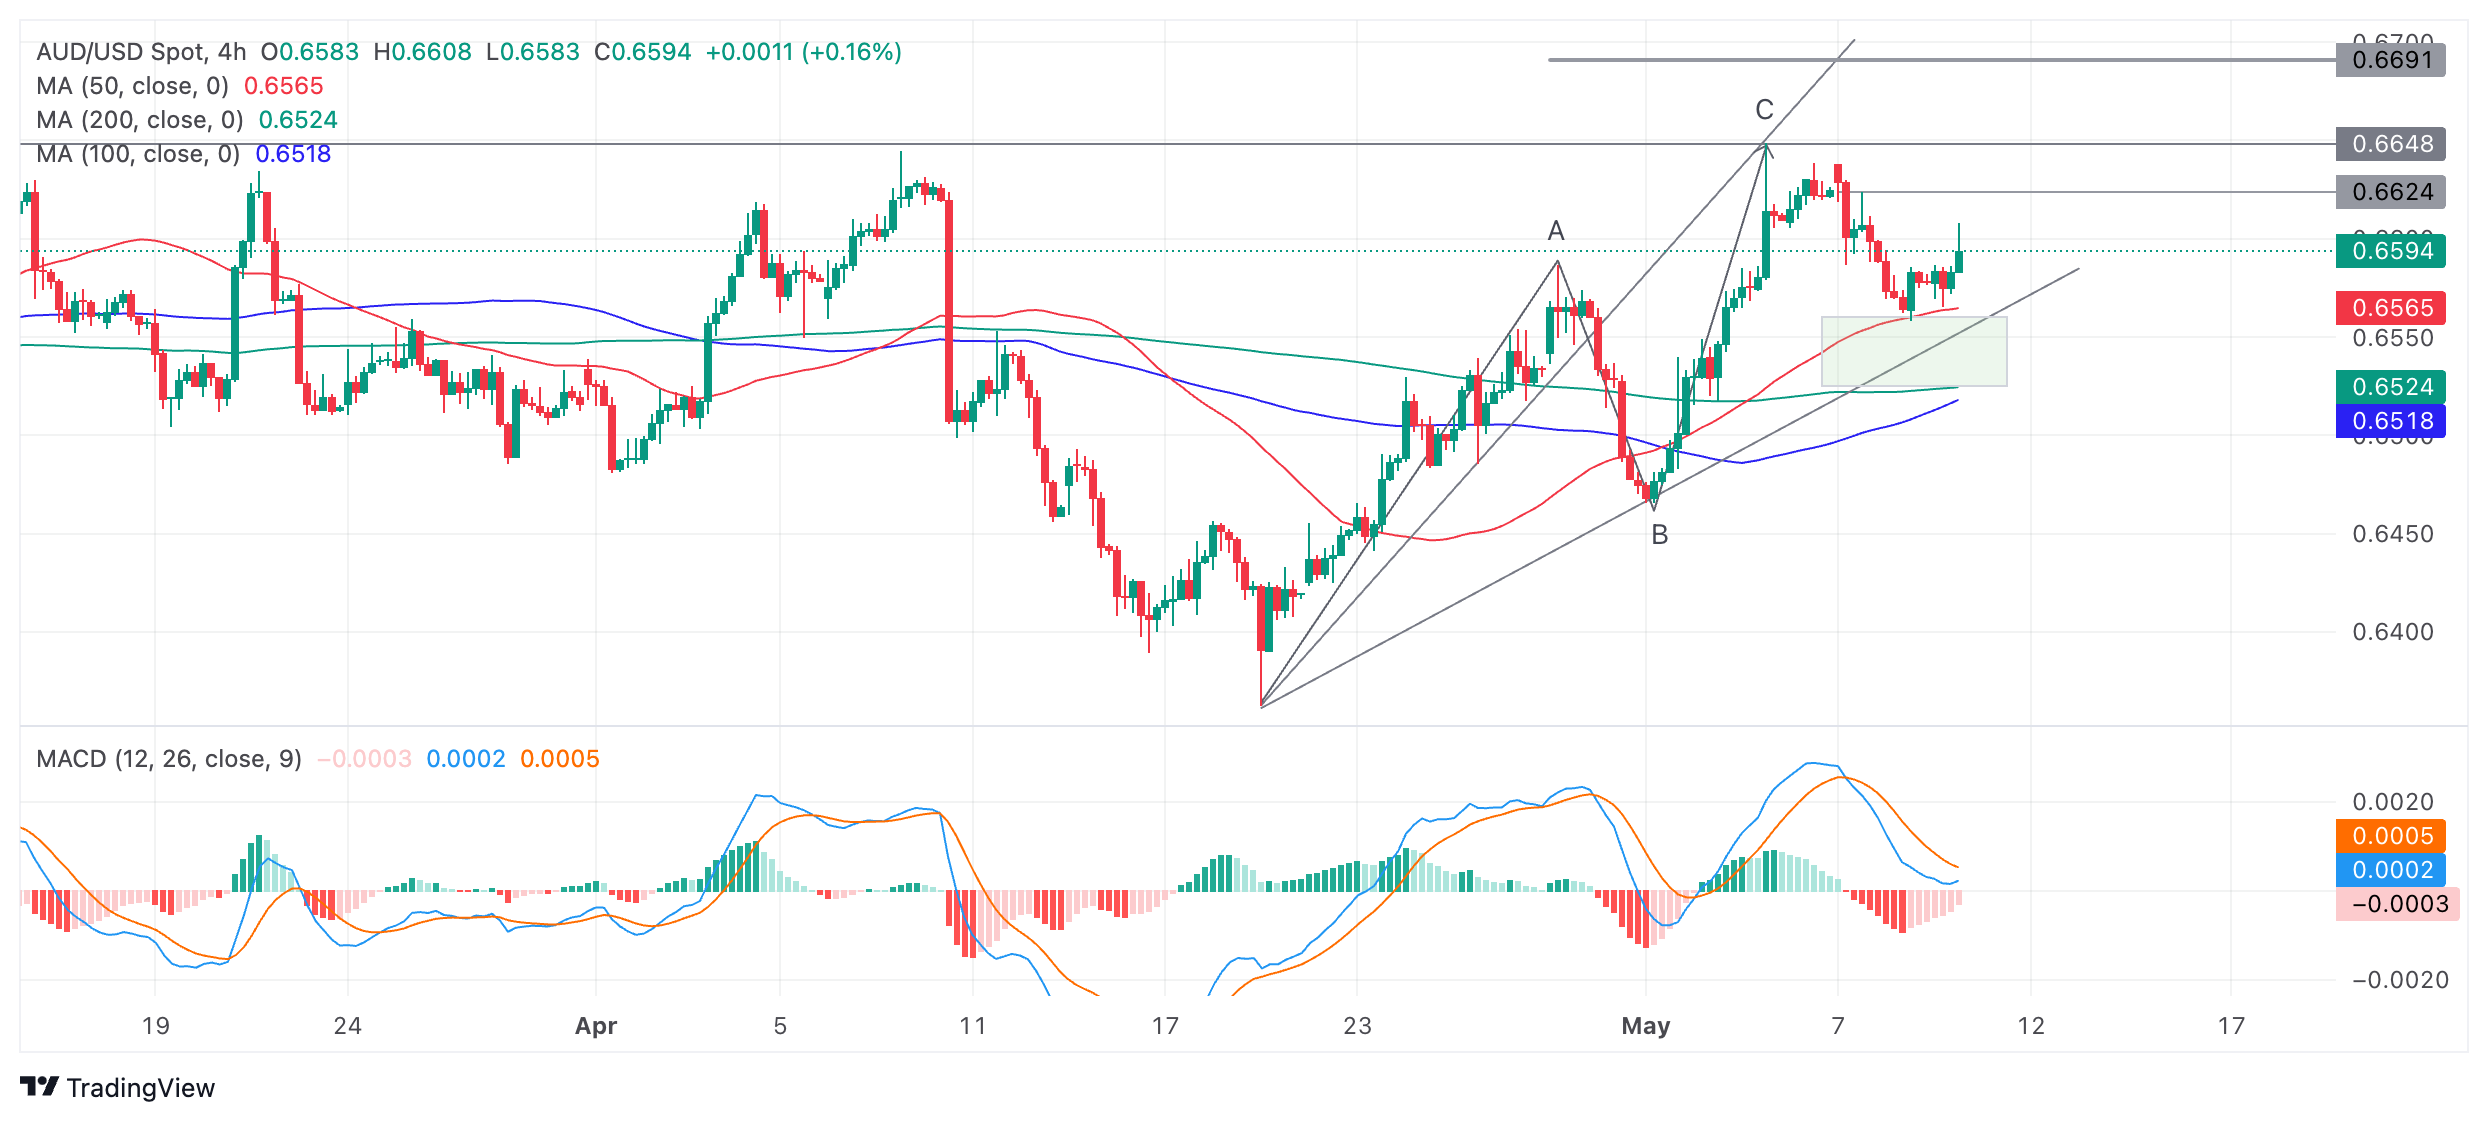
The pair is probably resuming its short-term uptrend, evidenced by the rising sequence of peaks and troughs since the April 19 lows, visible on the 4-hour chart
AUD/USD 4-hour Chart
Given the old trader’s adage that “the trend is your friend” the resumption of the uptrend suggests AUD/USD will continue higher.
A break above the 0.6608 and then the 0.6624 highs would provide more confirmation that the uptrend was resuming. The next upside targets for the uptrend lie at the 0.6649 resistance level of the May 3 high and then at a target at around 0.6680-90.
The second target is generated by a possible Measured Move pattern that AUD/USD has formed since the April 19 lows. These patterns are like large zig-zags composed of three waves, labeled A, B and C on the chart. The general expectation is that wave C will be either the same length as A or a Fibonacci 0.681 of A.
Wave C has already reached the Fibonacci 0.681 target of the Measured Move at the May 3 highs, however, there is a chance it could go all the way to the second target where C=A at 0.6690.
The Moving Average Convergence Divergence (MACD) momentum indicator is painting red histogram bars indicating a negative bias. This suggests price might be vulnerable to more downside. It is possible the correction from the May 3 highs may have further to run before the uptrend properly resumes.
The rectangular pale green zone drawn on the chart just above the lower trendline is likely to continue providing a cushion of support for price. From there price will probably resume its uptrend. A break below the trendline, however, would be a bearish sign, suggesting a potential reversal of the trend.
Related Articles


