

Silver Price Analysis: Breaks out above top of four-year range and rallies above $32.00

Source Fxstreet
  • Silver price breaks out of a four-year consolidation zone and rallies strongly. 
  • The precious metal could still go higher once the current pull back ends and the uptrend resumes. 

Silver (XAG/USD) price has broken decisively above key resistance at $30.00 and risen parabolically, hitting its first upside target at $32.28. 

The precious metal has since pulled back to trade just above $32.00 at the time of writing, but it is firmly in an uptrend which – given the old saying that “the trend is your friend” – is expected to continue. 

4-hour Chart 
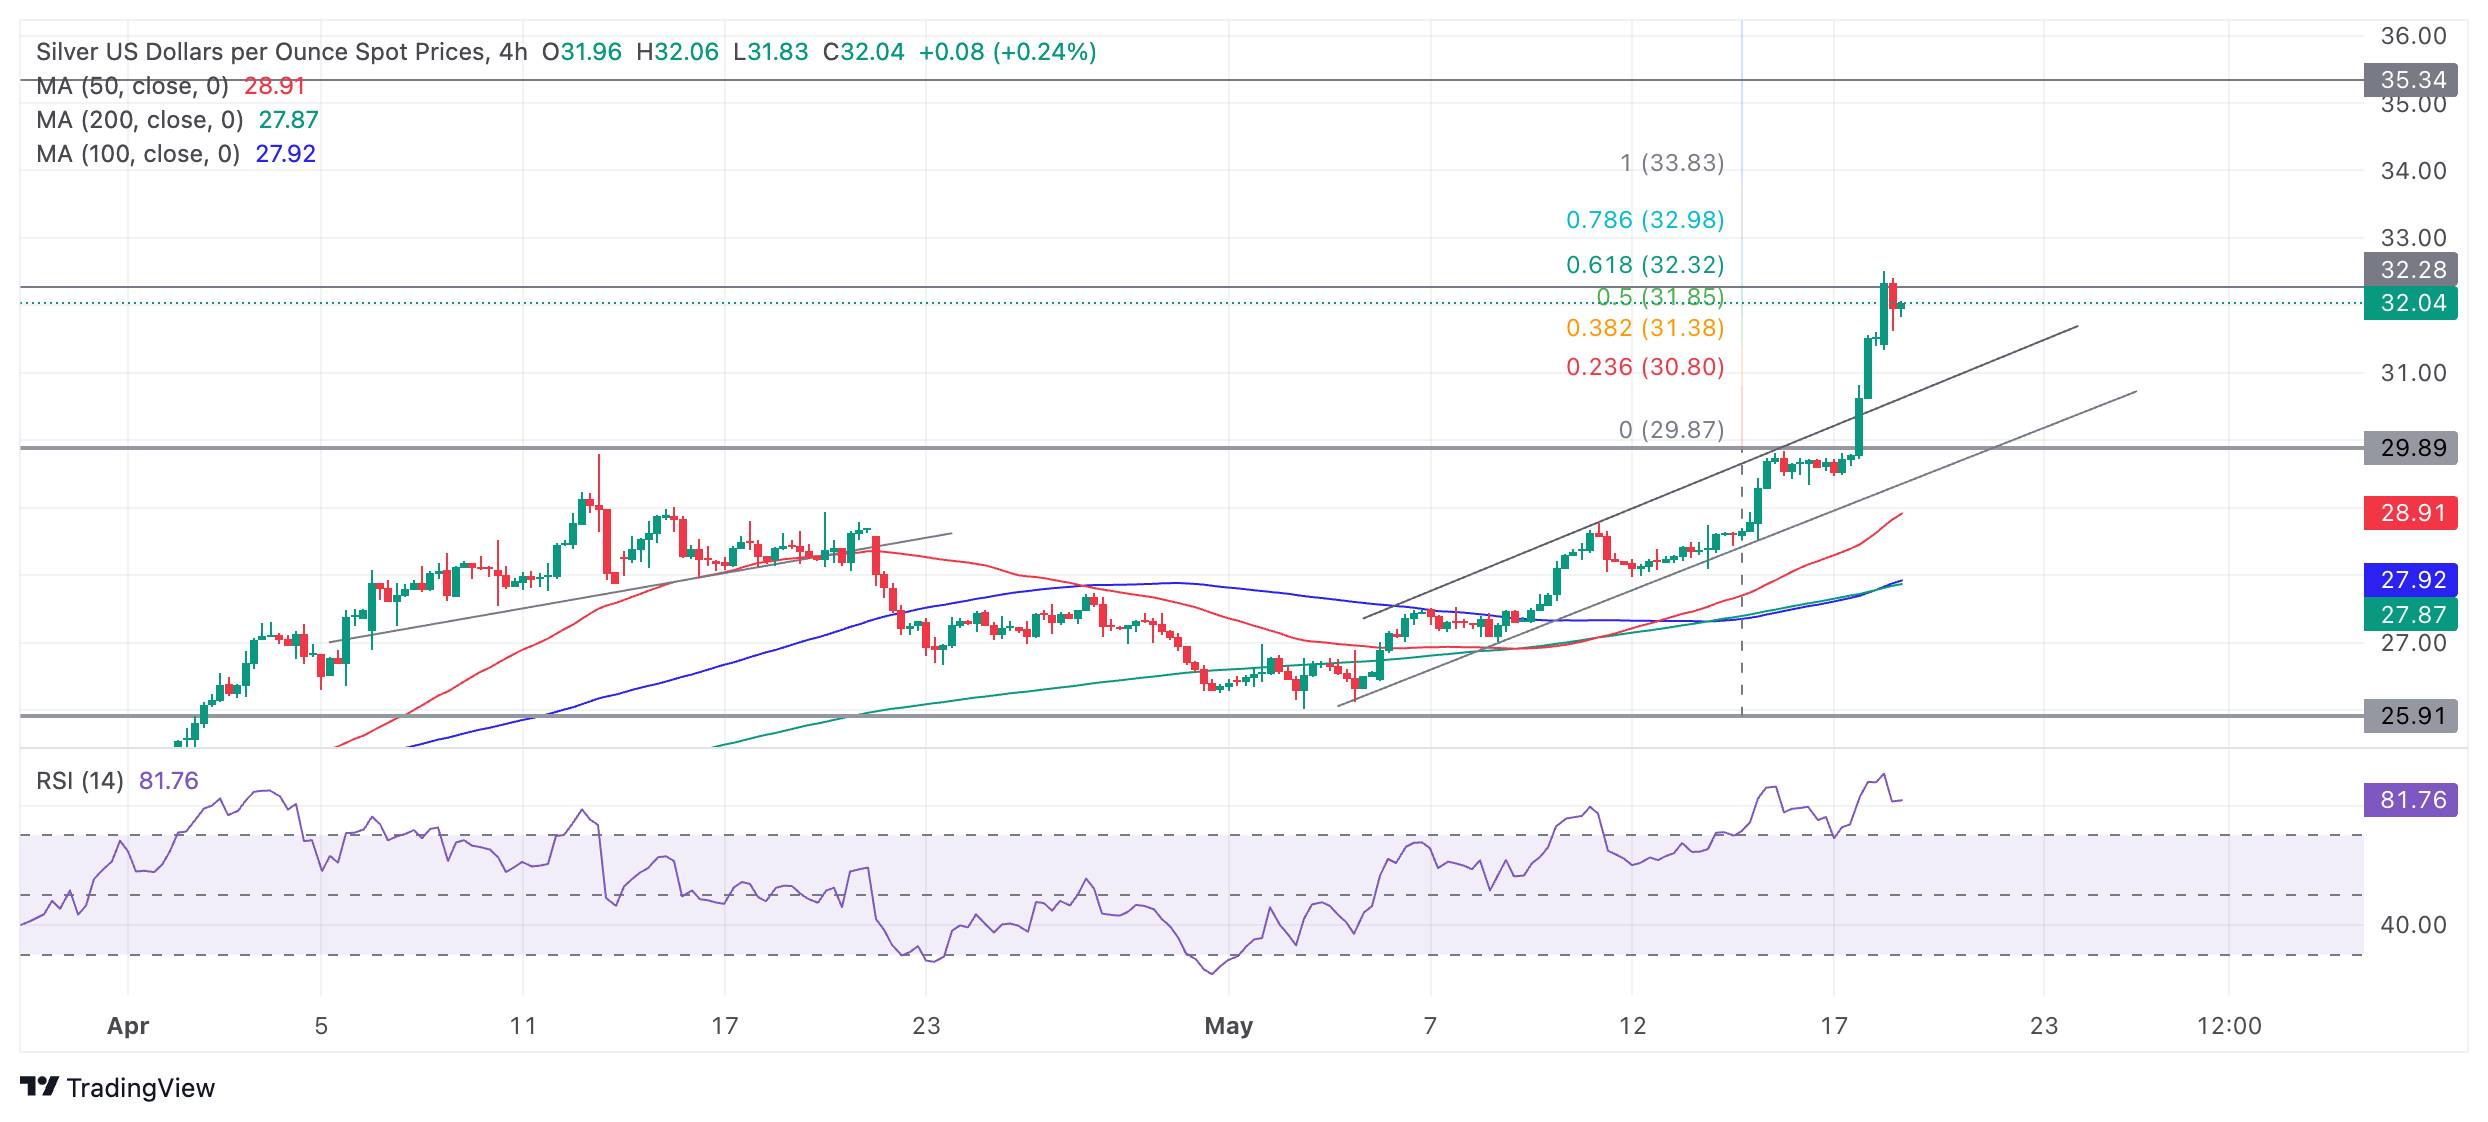
The Relative Strength Index (RSI) is in the overbought zone, suggesting traders should not add to their long holdings. If the RSI exits overbought on a closing basis it will signal a deeper correction is taking place. 

Any correction is likely to meet initial support at the top of the rising channel, at around $31.20. Given the trend is bullish, Silver is likely to resume rallying after its correction finalizes. 

The decisive break above $30.00 resulted in a steep upside move as it represents the ceiling of a four-year consolidation range. The rally rapidly met the first target at $32.28, the Fibonacci 0.618 extension of the upper part of the consolidation range higher. 

Silver could still go much higher, however, as the break above $30.00 was an important milestone for price and increased confidence could draw more bulls to the trade. The next target to the upside is $33.83, the full height of the range extrapolated higher, followed by $35.34, a key former high.

It would require a decisive break below the rising channel lows in the $29.00s to bring the short-term uptrend into doubt.

A decisive break would be one accompanied by a long red candlestick that closed near its lows or three red candlesticks in a row. 

Disclaimer: For information purposes only. Past performance is not indicative of future results.
placeholder
Forex Today: Yet to be confirmed US-Iran MOU caps US Dollar's upsideHere is what you need to know on Friday, May 29:
Author  FXStreet
9 hours ago
Here is what you need to know on Friday, May 29:
placeholder
How Trumponomics Influenced Oil Price Volatility in the Iran War Understand how the Strait of Hormuz shock moved markets, and what CFD traders watched next.
Author  Rachel Weiss
16 hours ago
Understand how the Strait of Hormuz shock moved markets, and what CFD traders watched next.
placeholder
Finding The Best Japan Stocks to Buy? These are Top Japanese Companies to Watch Discover the best Japanese stocks to buy, including AI semiconductor leaders, Buffett-backed trading houses, and undervalued Japan stocks benefiting from corporate reforms and yen trends.
Author  Mitrade
16 hours ago
Discover the best Japanese stocks to buy, including AI semiconductor leaders, Buffett-backed trading houses, and undervalued Japan stocks benefiting from corporate reforms and yen trends.
placeholder
WTI falls to near $87.00 on potential US-Iran ceasefire extensionWest Texas Intermediate (WTI) oil price extends its losses for the third successive day, trading around $87.20 per barrel during the Asian hours on Friday.
Author  FXStreet
18 hours ago
West Texas Intermediate (WTI) oil price extends its losses for the third successive day, trading around $87.20 per barrel during the Asian hours on Friday.
placeholder
Trump’s ‘Copper Tariffs’ June Countdown. US Copper Imports Surge, Will Copper Prices Hit New Highs?On May 27, Bloomberg reported that copper trading activity has intensified as market expectations of potential copper tariffs under a Trump administration heat up, prompting traders to sh
Author  TradingKey
Yesterday 08: 08
On May 27, Bloomberg reported that copper trading activity has intensified as market expectations of potential copper tariffs under a Trump administration heat up, prompting traders to sh
Related Instrument
goTop
quote